- Sign up
- Sign In
 AI PPT Maker
 Templates
 PPT Bundles
 Design Services
 Business PPTs
 Business Plan
 Management
 Strategy
 Introduction PPT
 Roadmap
 Self Introduction
 Timelines
 Process
 Marketing
 Agenda
 Technology
 Medical
 Startup Business Plan
 Cyber Security
 Dashboards
 SWOT
SWOT Proposals
 Education
 Pitch Deck
 Digital Marketing
 KPIs
KPIs Project Management
 Product Management
 Artificial Intelligence
 Target Market
 Communication
 Supply Chain
 Google Slides
 Research Services
 One Pagers
 All Categories
Track business performance PowerPoint Presentation Templates and Google Slides
DISPLAYING: 60 of 67 Item(s)
Page


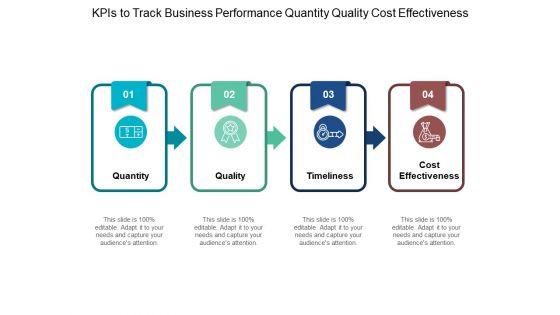


Presenting this set of slides with name kpis to track business performance quantity quality cost effectiveness ppt powerpoint presentation styles show. This is a four stage process. The stages in this process are Marketing, Business, Management, Planning, Strategy. This is a completely editable PowerPoint presentation and is available for immediate download. Download now and impress your audience.
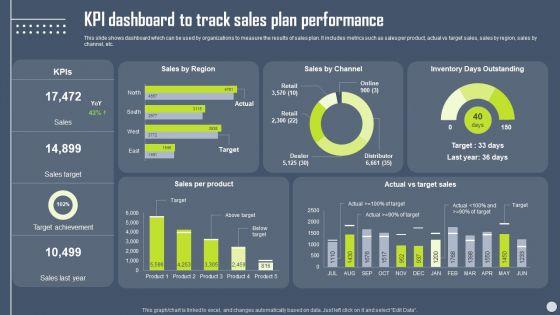
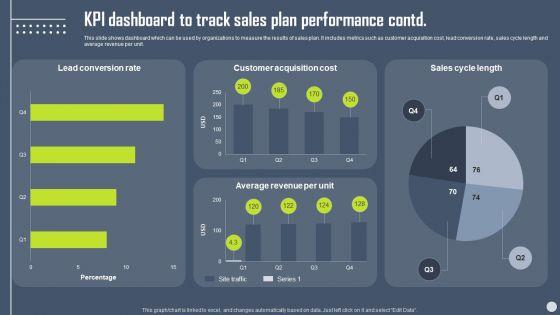
This slide shows dashboard which can be used by organizations to measure the results of sales plan. It includes metrics such as sales per product, actual vs target sales, sales by region, sales by channel, etc. Boost your pitch with our creative Boosting Yearly Business Revenue KPI Dashboard To Track Sales Plan Performance Topics PDF. Deliver an awe-inspiring pitch that will mesmerize everyone. Using these presentation templates you will surely catch everyones attention. You can browse the ppts collection on our website. We have researchers who are experts at creating the right content for the templates. So you dont have to invest time in any additional work. Just grab the template now and use them.
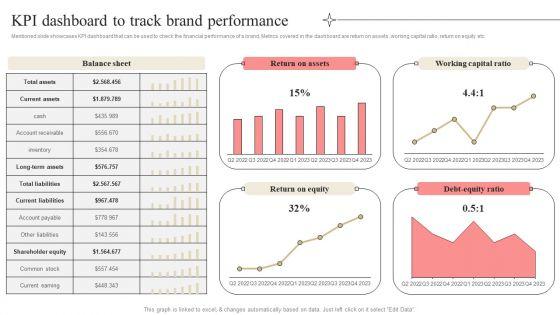

Mentioned slide showcases KPI dashboard that can be used to check the financial performance of a brand. Metrics covered in the dashboard are return on assets, working capital ratio, return on equity etc. Coming up with a presentation necessitates that the majority of the effort goes into the content and the message you intend to convey. The visuals of a PowerPoint presentation can only be effective if it supplements and supports the story that is being told. Keeping this in mind our experts created Developing Market Leading Businesses KPI Dashboard To Track Brand Performance Summary PDF to reduce the time that goes into designing the presentation. This way, you can concentrate on the message while our designers take care of providing you with the right template for the situation.
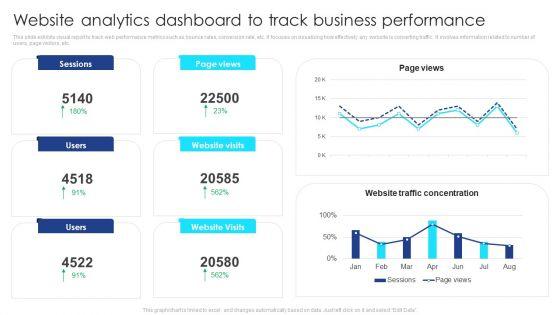

This slide exhibits visual report to track web performance metrics such as bounce rates, conversion rate, etc. It focuses on visualizing how effectively any website is converting traffic. It involves information related to number of users, page visitors, etc. Pitch your topic with ease and precision using this Website Analytics Dashboard To Track Business Performance Guidelines PDF. This layout presents information on Website Analytics, Dashboard To Track, Business Performance. It is also available for immediate download and adjustment. So, changes can be made in the color, design, graphics or any other component to create a unique layout.


This slide showcases dashboard that can help organization to track on job training program. Its key components are absenteeism rate, overtime hours, training duration and cost and overall labor effectiveness rate. From laying roadmaps to briefing everything in detail, our templates are perfect for you. You can set the stage with your presentation slides. All you have to do is download these easy-to-edit and customizable templates. Business Development Program Dashboard To Track Employee Performance Portrait PDF will help you deliver an outstanding performance that everyone would remember and praise you for. Do download this presentation today.


This slide covers the dashboard that depicts metrics to track company sales performance that focuses on number of sales, cost breakdown, accumulated revenues, incremental sales, etc. Are you in need of a template that can accommodate all of your creative concepts This one is crafted professionally and can be altered to fit any style. Use it with Google Slides or PowerPoint. Include striking photographs, symbols, depictions, and other visuals. Fill, move around, or remove text boxes as desired. Test out color palettes and font mixtures. Edit and save your work, or work with colleagues. Download Digital Transition Plan For Managing Business Dashboard Depicting Kpis To Track Sales Performance Guidelines PDF and observe how to make your presentation outstanding. Give an impeccable presentation to your group and make your presentation unforgettable.
This slide provides information regarding corporate branding performance tracking dashboard in terms of leads, conversion metrics, web traffic, etc. If you are looking for a format to display your unique thoughts, then the professionally designed Corporate Branding Performance Tracking Dashboard Corporate Branding Strategy To Revitalize Business Identity Slides PDF is the one for you. You can use it as a Google Slides template or a PowerPoint template. Incorporate impressive visuals, symbols, images, and other charts. Modify or reorganize the text boxes as you desire. Experiment with shade schemes and font pairings. Alter, share or cooperate with other people on your work. Download Corporate Branding Performance Tracking Dashboard Corporate Branding Strategy To Revitalize Business Identity Slides PDF and find out how to give a successful presentation. Present a perfect display to your team and make your presentation unforgettable.
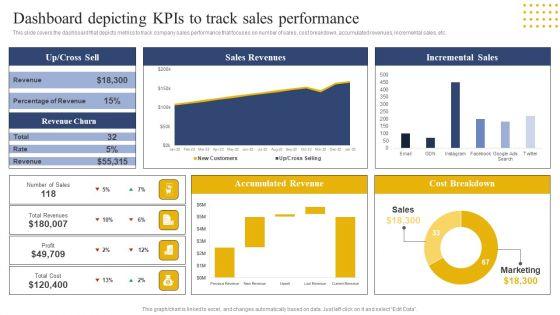
This slide covers the dashboard that depicts metrics to track company sales performance that focuses on number of sales, cost breakdown, accumulated revenues, incremental sales, etc. From laying roadmaps to briefing everything in detail, our templates are perfect for you. You can set the stage with your presentation slides. All you have to do is download these easy-to-edit and customizable templates. Transition Plan For Business Management Dashboard Depicting Kpis To Track Sales Performance Template PDF will help you deliver an outstanding performance that everyone would remember and praise you for. Do download this presentation today.
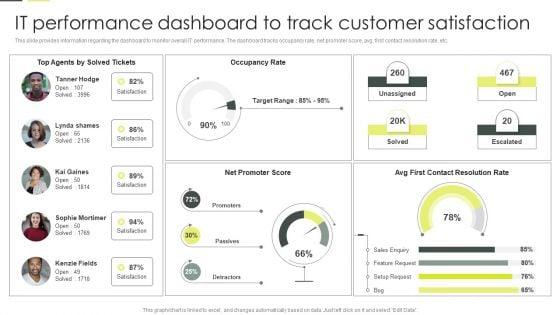

This slide provides information regarding the dashboard to monitor overall IT performance. The dashboard tracks occupancy rate, net promoter score, avg. first contact resolution rate, etc. Find a pre designed and impeccable Building An IT Strategy Plan For Business Expansion IT Performance Dashboard To Track Customer Satisfaction Download PDF. The templates can ace your presentation without additional effort. You can download these easy to edit presentation templates to make your presentation stand out from others. So, what are you waiting for Download the template from Slidegeeks today and give a unique touch to your presentation.
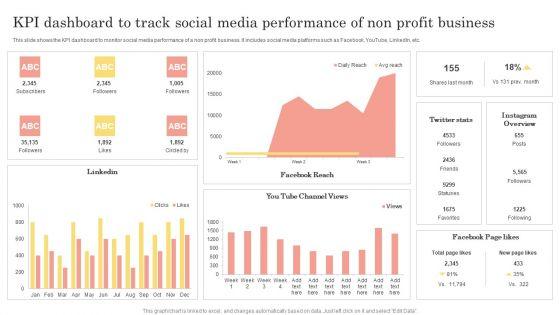

This slide shows the KPI dashboard to monitor social media performance of a non profit business. It includes social media platforms such as Facebook, YouTube, LinkedIn, etc. Showcasing this set of slides titled Kpi Dashboard To Track Social Media Performance Of Non Profit Business Portrait PDF. The topics addressed in these templates are Channel Views, Instagram Overview, Favorites. All the content presented in this PPT design is completely editable. Download it and make adjustments in color, background, font etc. as per your unique business setting.
This slide provides information regarding product branding performance tracking dashboard in terms of revenues, new customers, customer satisfaction rate. Make sure to capture your audiences attention in your business displays with our gratis customizable Efficient Administration Of Product Business And Umbrella Branding Product Branding Performance Tracking Dashboard Background PDF. These are great for business strategies, office conferences, capital raising or task suggestions. If you desire to acquire more customers for your tech business and ensure they stay satisfied, create your own sales presentation with these plain slides.
This slide provides information regarding corporate branding performance tracking dashboard in terms of leads, conversion metrics, web traffic, etc. Crafting an eye catching presentation has never been more straightforward. Let your presentation shine with this tasteful yet straightforward Efficient Administration Of Product Business And Umbrella Branding Corporate Branding Performance Tracking Dashboard Elements PDF template. It offers a minimalistic and classy look that is great for making a statement. The colors have been employed intelligently to add a bit of playfulness while still remaining professional. Construct the ideal Efficient Administration Of Product Business And Umbrella Branding Corporate Branding Performance Tracking Dashboard Elements PDF that effortlessly grabs the attention of your audience Begin now and be certain to wow your customers.


Pitch your topic with ease and precision using this Kpi Dashboard To Track Business To Business E Commerce Performance Guidelines PDF. This layout presents information on Dashboard, Track Business, Performance. It is also available for immediate download and adjustment. So, changes can be made in the color, design, graphics or any other component to create a unique layout.
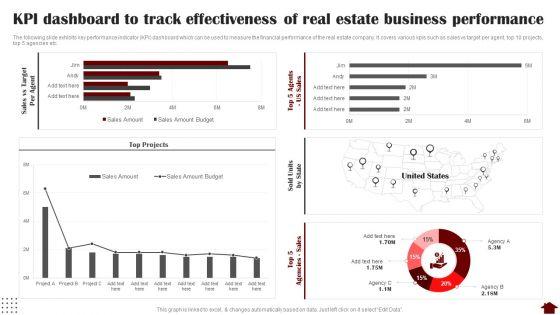

The following slide exhibits key performance indicator KPI dashboard which can be used to measure the financial performance of the real estate company. It covers various kpis such as sales vs target per agent, top 10 projects, top 5 agencies etc. Deliver an awe inspiring pitch with this creative KPI Dashboard To Track Effectiveness Of Real Estate Business Performance Slides PDF bundle. Topics like KPI Dashboard, Track Effectiveness, Real Estate Business Performance can be discussed with this completely editable template. It is available for immediate download depending on the needs and requirements of the user.
This slide provides information regarding dashboard utilized by firm to monitor performance of products offered and customer associated. The performance is tracked through revenues generated, new customer acquired, customer satisfaction, sales comparison, etc. Deliver and pitch your topic in the best possible manner with this Developing Significant Business Product And Customer Performance Tracking Clipart PDF. Use them to share invaluable insights on Revenue, New Customer, Revenue and impress your audience. This template can be altered and modified as per your expectations. So, grab it now.
Mentioned slide portrays KPI dashboard that can be used by organizations to measure their business performance post AI introduction. KPIS covered here are progress, before versus after AI implementation, risks and issues. Deliver and pitch your topic in the best possible manner with this AI Playbook For Business KPI Dashboard For Tracking Business Performance Demonstration PDF. Use them to share invaluable insights on Performance KPIs, Progress, Risk And Issues and impress your audience. This template can be altered and modified as per your expectations. So, grab it now.
This slide provides information regarding ecommerce website performance tracking dashboard addressing page views, website conversions, etc. Deliver and pitch your topic in the best possible manner with this Online Business Client Experience Improvement Strategy Playbook Ecommerce Website Performance Tracking Dashboard Slides PDF. Use them to share invaluable insights on Organic Search, Bounce Rate, Customer Conversions Rate and impress your audience. This template can be altered and modified as per your expectations. So, grab it now.
This slide provides information regarding ecommerce website performance tracking dashboard addressing page views, website conversions, etc. Deliver an awe inspiring pitch with this creative Strategy Playbook For Ecommerce Business Ecommerce Website Performance Tracking Dashboard Portrait PDF bundle. Topics like Website Conversions, Website Performance, Website Overview can be discussed with this completely editable template. It is available for immediate download depending on the needs and requirements of the user.
This slide provides information regarding essential KPIs for ecommerce performance dashboard tracking average bounce rate, new vs. old customers, channel revenue vs. channel acquisitions costs, channel revenue vs. sales, average conversion rate, etc. Deliver an awe inspiring pitch with this creative Strategy Playbook For Ecommerce Business Dashboard Tracking Essential Kpis For Ecommerce Performance Rules PDF bundle. Topics like Returning Customers, Acquisition Cost, Channel Revenue can be discussed with this completely editable template. It is available for immediate download depending on the needs and requirements of the user.
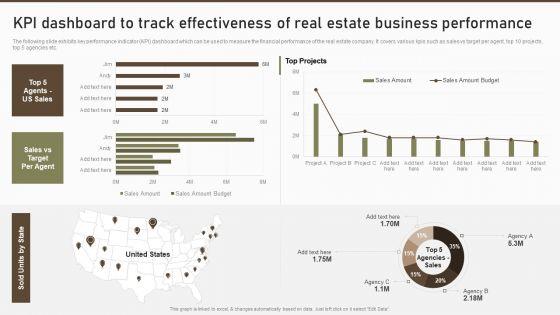

The following slide exhibits key performance indicator KPI dashboard which can be used to measure the financial performance of the real estate company. It covers various kpis such as sales vs target per agent, top 10 projects, top 5 agencies etc.Deliver an awe inspiring pitch with this creative KPI Dashboard To Track Effectiveness Of Real Estate Business Performance Guidelines PDF bundle. Topics like Top Projects, Sales Amount, Sales Amount can be discussed with this completely editable template. It is available for immediate download depending on the needs and requirements of the user.
Mentioned slide portrays KPI dashboard that can be used by organizations to measure their business performance post AI introduction. KPIS covered here are progress, Before versus After AI Implementation, risks issues.Deliver an awe inspiring pitch with this creative Artificial Intelligence For IT Operations Playbook KPI Dashboard For Tracking Business Performance Slides PDF bundle. Topics like Kpi Dashboard, Tracking Business, Performance can be discussed with this completely editable template. It is available for immediate download depending on the needs and requirements of the user.
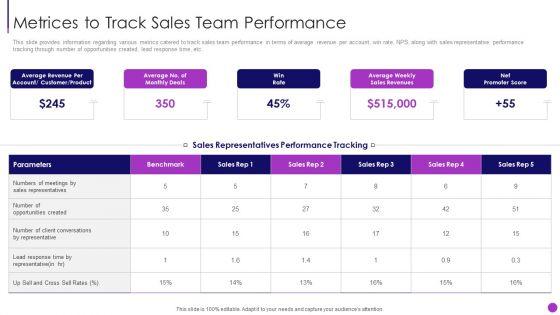
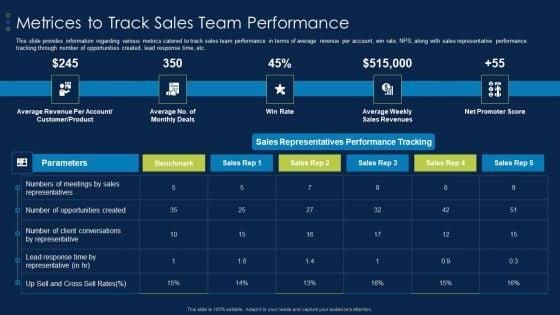
Business To Business Sales Management Playbook Metrices To Track Sales Team Performance Diagrams PDF
This slide provides information regarding various metrics catered to track sales team performance in terms of average revenue per account, win rate, NPS, along with sales representative performance tracking through number of opportunities created, lead response time, etc.Deliver an awe inspiring pitch with this creative Business To Business Sales Management Playbook Metrices To Track Sales Team Performance Diagrams PDF bundle. Topics like Sales Representatives, Client Conversations, Lead Response can be discussed with this completely editable template. It is available for immediate download depending on the needs and requirements of the user.
This slide provides information regarding various metrics catered to track sales team performance in terms of average revenue per account, win rate, NPS, along with sales representative performance tracking through number of opportunities created, lead response time, etc. Deliver an awe inspiring pitch with this creative Business To Business Account Metrices To Track Sales Team Performance Background PDF bundle. Topics like Average Revenue Per Account, Customer, Product, Sales Representatives Performance Tracking can be discussed with this completely editable template. It is available for immediate download depending on the needs and requirements of the user.
This slide provides information regarding B2B sales representatives performance tracking dashboard to measure leads by region, revenue breakdown, top performers by leads, revenues, etc. Deliver and pitch your topic in the best possible manner with this Business To Business Account B2B Sales Representatives Performance Tracking Dashboard Demonstration PDF. Use them to share invaluable insights on Top 5 Sales Reps By Revenue Pace, Top 5 Sales Reps By Revenue, Top 5 Sales Reps By Leads and impress your audience. This template can be altered and modified as per your expectations. So, grab it now.
Mentioned slide portrays KPI dashboard that can be used by organizations to measure their business performance post AI introduction. KPIS covered here are progress, Before versus After AI Implementation, risks and issues. Deliver an awe inspiring pitch with this creative artificial intelligence playbook kpi dashboard for tracking business performance formats pdf bundle. Topics like performance kpis, progress, risk and issues can be discussed with this completely editable template. It is available for immediate download depending on the needs and requirements of the user.
Mentioned slide portrays KPI dashboard that can be used by organizations to measure their business performance post AI introduction. KPIS covered here are progress, Before versus After AI Implementation, risks and issues. Deliver an awe inspiring pitch with this creative artificial intelligence transformation playbook kpi dashboard for tracking business performance designs pdf bundle. Topics like risk and issues, progress, performance kpis, before versus after all implementation can be discussed with this completely editable template. It is available for immediate download depending on the needs and requirements of the user.
This slide provides information regarding ecommerce website performance tracking dashboard addressing page views, website conversions, etc. Deliver and pitch your topic in the best possible manner with this online business strategy playbook ecommerce website performance tracking dashboard introduction pdf. Use them to share invaluable insights on Ecommerce Website Performance Tracking Dashboard and impress your audience. This template can be altered and modified as per your expectations. So, grab it now.
This slide provides information regarding essential KPIs for ecommerce performance dashboard tracking average bounce rate, new vs. old customers, channel revenue vs. channel acquisitions costs, channel revenue vs. sales, average conversion rate, etc. Deliver an awe inspiring pitch with this creative online business strategy playbook dashboard tracking essential kpis for ecommerce performance graphics pdf bundle. Topics like Dashboard Tracking Essential KPIs for Ecommerce Performance can be discussed with this completely editable template. It is available for immediate download depending on the needs and requirements of the user.

This slide provides information regarding various metrics catered to track sales team performance in terms of average revenue per account, win rate, NPS, along with sales representative performance tracking through number of opportunities created, lead response time, etc. Deliver an awe inspiring pitch with this creative business to business sales playbook metrices to track sales team performance elements pdf bundle. Topics like metrices to track sales team performance can be discussed with this completely editable template. It is available for immediate download depending on the needs and requirements of the user.
This slide provides information regarding B2B sales representatives performance tracking dashboard to measure leads by region, revenue breakdown, top performers by leads, revenues, etc. Deliver and pitch your topic in the best possible manner with this business to business sales playbook b2b sales representatives performance tracking dashboard introduction pdf. Use them to share invaluable insights on b2b sales representatives performance tracking dashboard and impress your audience. This template can be altered and modified as per your expectations. So, grab it now.
Pitch your topic with ease and precision using this dashboard for business performance tracking vector icon ppt model infographics pdf. This layout presents information on dashboard for business performance tracking vector icon. It is also available for immediate download and adjustment. So, changes can be made in the color, design, graphics or any other component to create a unique layout.
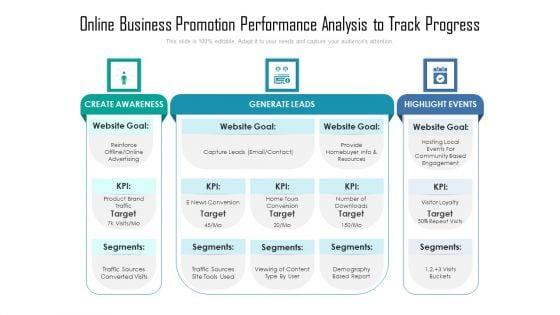
Showcasing this set of slides titled online business promotion performance analysis to track progress ppt powerpoint presentation infographic template microsoft pdf. The topics addressed in these templates are create awareness, generate leads, highlight events. All the content presented in this PPT design is completely editable. Download it and make adjustments in color, background, font etc. as per your unique business setting.
Persuade your audience using this four steps for tracking business performance with icons ppt powerpoint presentation file styles pdf. This PPT design covers four stages, thus making it a great tool to use. It also caters to a variety of topics including monitor, growth, finance. Download this PPT design now to present a convincing pitch that not only emphasizes the topic but also showcases your presentation skills.
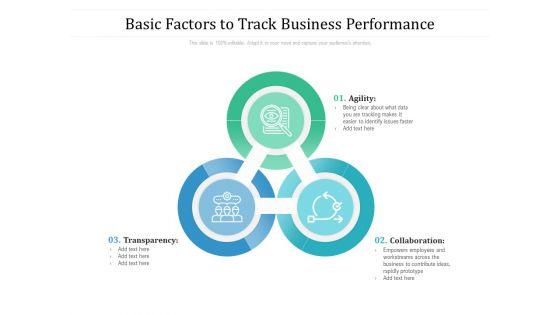
Presenting this set of slides with name basic factors to track business performance ppt powerpoint presentation file smartart pdf. This is a three stage process. The stages in this process are agility, collaboration, transparency. This is a completely editable PowerPoint presentation and is available for immediate download. Download now and impress your audience.


Persuade your audience using this Scorecard Icon To Track Monthly Business Sales Employee Representative Performance Elements PDF. This PPT design covers three stages, thus making it a great tool to use. It also caters to a variety of topics including Scorecard Icon To Track, Monthly Business Sales, Employee Representative Performance. Download this PPT design now to present a convincing pitch that not only emphasizes the topic but also showcases your presentation skills.
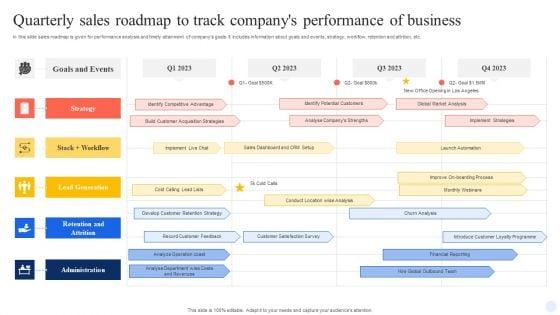
In this slide sales roadmap is given for performance analysis and timely attainment of companys goals. It includes information about goals and events, strategy, workflow, retention and attrition, etc. Showcasing this set of slides titled Quarterly Sales Roadmap To Track Companys Performance Of Business Elements PDF. The topics addressed in these templates are Strategy, Goals And Events, Administration, Retention And Attrition, Lead Generation. All the content presented in this PPT design is completely editable. Download it and make adjustments in color, background, font etc. as per your unique business setting.
Showcasing this set of slides titled Quarterly Business Performance Tracking Comparative Matrix Demonstration PDF. The topics addressed in these templates are Quarterly Business, Performance Tracking, Comparative Matrix. All the content presented in this PPT design is completely editable. Download it and make adjustments in color, background, font etc. as per your unique business setting.
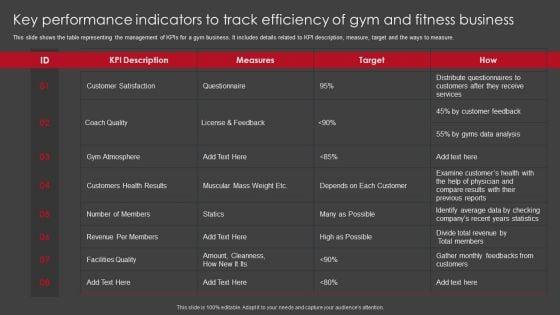
This slide shows the table representing the management of KPIs for a gym business. It includes details related to KPI description, measure, target and the ways to measure. Pitch your topic with ease and precision using this Key Performance Indicators To Track Efficiency Of Gym And Fitness Business Themes PDF. This layout presents information on Key Performance Indicators, Track Efficiency, Gym And Fitness Business. It is also available for immediate download and adjustment. So, changes can be made in the color, design, graphics or any other component to create a unique layout.
Pitch your topic with ease and precision using this Business To Business E Commerce Performance Tracking Matrix Mockup PDF. This layout presents information on Customer Acquisition Cost, Customer Retention Rate, Order Frequency . It is also available for immediate download and adjustment. So, changes can be made in the color, design, graphics or any other component to create a unique layout.
Mentioned slide provide insights into various key performance indicators to determine business performance. It includes KPIs such as business financials, website traffic, customer case, customer engagement, conversion rate, customer retention, customer bounce rate, employee turnover, etc. Make sure to capture your audiences attention in your business displays with our gratis customizable Comprehensive Guide For Website Various Kpis For Tracking Business Performance. These are great for business strategies, office conferences, capital raising or task suggestions. If you desire to acquire more customers for your tech business and ensure they stay satisfied, create your own sales presentation with these plain slides. Mentioned slide provide insights into various key performance indicators to determine business performance. It includes KPIs such as business financials, website traffic, customer case, customer engagement, conversion rate, customer retention, customer bounce rate, employee turnover, etc.
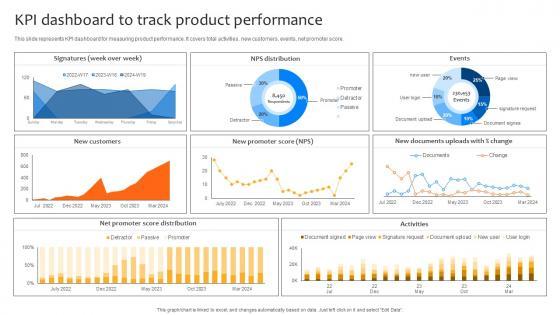

This slide represents KPI dashboard for measuring product performance. It covers total activities, new customers, events, net promoter score. Coming up with a presentation necessitates that the majority of the effort goes into the content and the message you intend to convey. The visuals of a PowerPoint presentation can only be effective if it supplements and supports the story that is being told. Keeping this in mind our experts created Deploying Strategies For Business KPI Dashboard To Track Product Performance Strategy SS V to reduce the time that goes into designing the presentation. This way, you can concentrate on the message while our designers take care of providing you with the right template for the situation. This slide represents KPI dashboard for measuring product performance. It covers total activities, new customers, events, net promoter score.
The slide showcases dashboard representing food and beverage business performance tracking tool , which assist to evaluate monthly performance of employees, customer retention etc. Slidegeeks has constructed Performance Tracking Dashboard For Food Product And Beverage Business after conducting extensive research and examination. These presentation templates are constantly being generated and modified based on user preferences and critiques from editors. Here, you will find the most attractive templates for a range of purposes while taking into account ratings and remarks from users regarding the content. This is an excellent jumping-off point to explore our content and will give new users an insight into our top-notch PowerPoint Templates. The slide showcases dashboard representing food and beverage business performance tracking tool , which assist to evaluate monthly performance of employees, customer retention etc.
Mentioned slide provide insights into various key performance indicators to determine business performance. It includes KPIs such as business financials, website traffic, customer case, customer engagement, conversion rate, customer retention, customer bounce rate, employee turnover, etc. Make sure to capture your audiences attention in your business displays with our gratis customizable Managing Technical And Non Various Kpis For Tracking Business Performance. These are great for business strategies, office conferences, capital raising or task suggestions. If you desire to acquire more customers for your tech business and ensure they stay satisfied, create your own sales presentation with these plain slides. Mentioned slide provide insights into various key performance indicators to determine business performance. It includes KPIs such as business financials, website traffic, customer case, customer engagement, conversion rate, customer retention, customer bounce rate, employee turnover, etc.
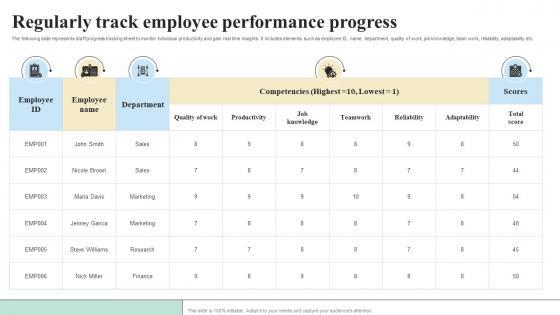
The following slide represents staff progress tracking sheet to monitor individual productivity and gain real time insights. It includes elements such as employee ID, name, department, quality of work, job knowledge, team work, reliability, adaptability etc. This Regularly Track Employee Performance Objectives And Key Result Methodology For Business from Slidegeeks makes it easy to present information on your topic with precision. It provides customization options, so you can make changes to the colors, design, graphics, or any other component to create a unique layout. It is also available for immediate download, so you can begin using it right away. Slidegeeks has done good research to ensure that you have everything you need to make your presentation stand out. Make a name out there for a brilliant performance. The following slide represents staff progress tracking sheet to monitor individual productivity and gain real time insights. It includes elements such as employee ID, name, department, quality of work, job knowledge, team work, reliability, adaptability etc.
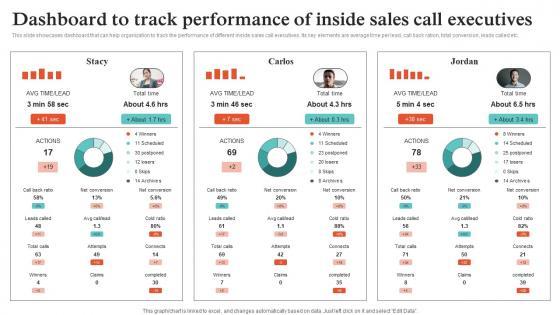
This slide showcases dashboard that can help organization to track the performance of different inside sales call executives. Its key elements are average time per lead, call back ration, total conversion, leads called etc. Make sure to capture your audiences attention in your business displays with our gratis customizable Virtual Sales Strategies For Business Dashboard To Track Performance Of Inside Strategy SS V. These are great for business strategies, office conferences, capital raising or task suggestions. If you desire to acquire more customers for your tech business and ensure they stay satisfied, create your own sales presentation with these plain slides. This slide showcases dashboard that can help organization to track the performance of different inside sales call executives. Its key elements are average time per lead, call back ration, total conversion, leads called etc.
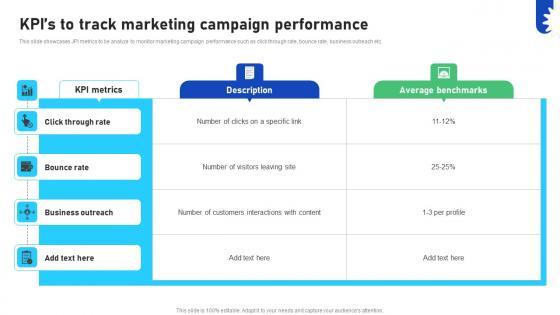
This slide showcases JPI metrics to be analyze to monitor marketing campaign performance such as click through rate, bounce rate, business outreach etc. Here you can discover an assortment of the finest PowerPoint and Google Slides templates. With these templates, you can create presentations for a variety of purposes while simultaneously providing your audience with an eye-catching visual experience. Download Improving Business Marketing Performance Kpis To Track Marketing Campaign CRP DK SS V to deliver an impeccable presentation. These templates will make your job of preparing presentations much quicker, yet still, maintain a high level of quality. Slidegeeks has experienced researchers who prepare these templates and write high-quality content for you. Later on, you can personalize the content by editing the Improving Business Marketing Performance Kpis To Track Marketing Campaign CRP DK SS V. This slide showcases JPI metrics to be analyze to monitor marketing campaign performance such as click through rate, bounce rate, business outreach etc.
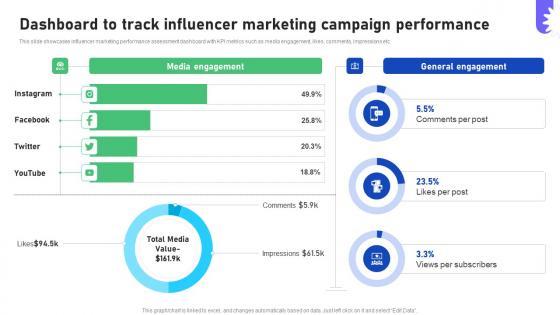

This slide showcases influencer marketing performance assessment dashboard with KPI metrics such as media engagement, likes, comments, impressions etc. Are you in need of a template that can accommodate all of your creative concepts This one is crafted professionally and can be altered to fit any style. Use it with Google Slides or PowerPoint. Include striking photographs, symbols, depictions, and other visuals. Fill, move around, or remove text boxes as desired. Test out color palettes and font mixtures. Edit and save your work, or work with colleagues. Download Improving Business Marketing Performance Dashboard To Track Influencer CRP DK SS V and observe how to make your presentation outstanding. Give an impeccable presentation to your group and make your presentation unforgettable. This slide showcases influencer marketing performance assessment dashboard with KPI metrics such as media engagement, likes, comments, impressions etc.
Mentioned slide provide insights into various key performance indicators to determine business performance. It includes KPIs such as business financials, website traffic, customer case, customer engagement, conversion rate, customer retention, customer bounce rate, employee turnover, etc. This modern and well-arranged Web Consulting Business Various Kpis For Tracking Business Performance provides lots of creative possibilities. It is very simple to customize and edit with the Powerpoint Software. Just drag and drop your pictures into the shapes. All facets of this template can be edited with Powerpoint, no extra software is necessary. Add your own material, put your images in the places assigned for them, adjust the colors, and then you can show your slides to the world, with an animated slide included. Mentioned slide provide insights into various key performance indicators to determine business performance. It includes KPIs such as business financials, website traffic, customer case, customer engagement, conversion rate, customer retention, customer bounce rate, employee turnover, etc.
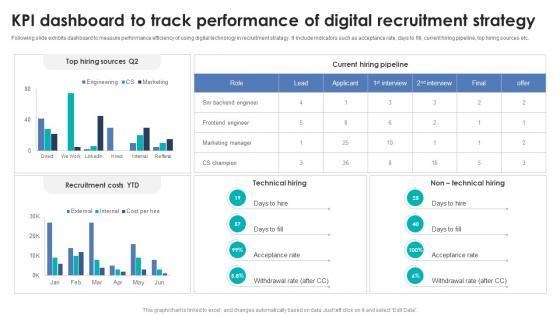

Following slide exhibits dashboard to measure performance efficiency of using digital technology in recruitment strategy. It include indicators such as acceptance rate, days to fill, current hiring pipeline, top hiring sources etc. Crafting an eye-catching presentation has never been more straightforward. Let your presentation shine with this tasteful yet straightforward Integrating Automation For Effective Business Kpi Dashboard To Track Performance Of Digital template. It offers a minimalistic and classy look that is great for making a statement. The colors have been employed intelligently to add a bit of playfulness while still remaining professional. Construct the ideal Integrating Automation For Effective Business Kpi Dashboard To Track Performance Of Digital that effortlessly grabs the attention of your audience Begin now and be certain to wow your customers Following slide exhibits dashboard to measure performance efficiency of using digital technology in recruitment strategy. It include indicators such as acceptance rate, days to fill, current hiring pipeline, top hiring sources etc.


Following slide demonstrates KPI dashboard for monitoring performance of BPO firm providing customer support services to determine growth rate. It includes elements such as total revenue, cost percentage by revenue, customer experience, etc. Showcasing this set of slides titled Customer Support KPI Dashboard To Track Business Process Outsourcing Company Performance Rules Pdf Wd. The topics addressed in these templates are Customer Experience, Total Revenue. All the content presented in this PPT design is completely editable. Download it and make adjustments in color, background, font etc. as per your unique business setting. Following slide demonstrates KPI dashboard for monitoring performance of BPO firm providing customer support services to determine growth rate. It includes elements such as total revenue, cost percentage by revenue, customer experience, etc.
Mentioned slide provides information about the key performance indicators that can be used by managers to measure the success of digital marketing strategy, KPIs covered are status, progress, priority and timeline. Formulating a presentation can take up a lot of effort and time, so the content and message should always be the primary focus. The visuals of the PowerPoint can enhance the presenters message, so our Performance Tracking KPI Dashboard Digital Approaches To Increase Business Growth Summary Pdf was created to help save time. Instead of worrying about the design, the presenter can concentrate on the message while our designers work on creating the ideal templates for whatever situation is needed. Slidegeeks has experts for everything from amazing designs to valuable content, we have put everything into Performance Tracking KPI Dashboard Digital Approaches To Increase Business Growth Summary Pdf Mentioned slide provides information about the key performance indicators that can be used by managers to measure the success of digital marketing strategy, KPIs covered are status, progress, priority and timeline.
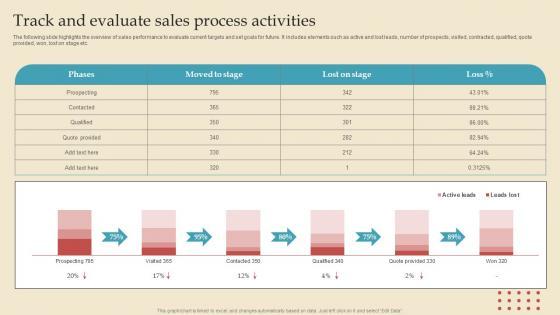

The following slide highlights the overview of sales performance to evaluate current targets and set goals for future. It includes elements such as active and lost leads, number of prospects, visited, contracted, qualified, quote provided, won, lost on stage etc. Coming up with a presentation necessitates that the majority of the effort goes into the content and the message you intend to convey. The visuals of a PowerPoint presentation can only be effective if it supplements and supports the story that is being told. Keeping this in mind our experts created Track And Evaluate Sales Describing Business Performance Administration Goals Information Pdf to reduce the time that goes into designing the presentation. This way, you can concentrate on the message while our designers take care of providing you with the right template for the situation. The following slide highlights the overview of sales performance to evaluate current targets and set goals for future. It includes elements such as active and lost leads, number of prospects, visited, contracted, qualified, quote provided, won, lost on stage etc.
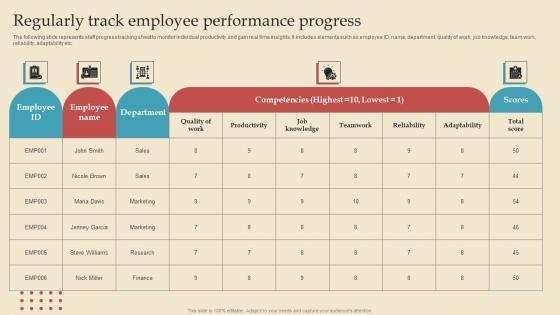
The following slide represents staff progress tracking sheet to monitor individual productivity and gain real time insights. It includes elements such as employee ID, name, department, quality of work, job knowledge, team work, reliability, adaptability etc. If you are looking for a format to display your unique thoughts, then the professionally designed Regularly Track Employee Describing Business Performance Administration Goals Clipart Pdf is the one for you. You can use it as a Google Slides template or a PowerPoint template. Incorporate impressive visuals, symbols, images, and other charts. Modify or reorganize the text boxes as you desire. Experiment with shade schemes and font pairings. Alter, share or cooperate with other people on your work. Download Regularly Track Employee Describing Business Performance Administration Goals Clipart Pdf and find out how to give a successful presentation. Present a perfect display to your team and make your presentation unforgettable. The following slide represents staff progress tracking sheet to monitor individual productivity and gain real time insights. It includes elements such as employee ID, name, department, quality of work, job knowledge, team work, reliability, adaptability etc.

The following slide represents accounting record tracker to review financial performance and assess financial position. It includes elements such as customer name, invoice number, date, amount, payment terms, amount received, outstanding etc. Want to ace your presentation in front of a live audience Our Maintain Track Accounting Describing Business Performance Administration Goals Sample Pdf can help you do that by engaging all the users towards you. Slidegeeks experts have put their efforts and expertise into creating these impeccable powerpoint presentations so that you can communicate your ideas clearly. Moreover, all the templates are customizable, and easy to edit and downloadable. Use these for both personal and commercial use. The following slide represents accounting record tracker to review financial performance and assess financial position. It includes elements such as customer name, invoice number, date, amount, payment terms, amount received, outstanding etc.


Following slide exhibits dashboard to determine impact of environmental assessment on business performance. It include indicators such as business health, tasks, progress, cost , time etc. The KPI Dashboard To Track Business Performance Business Environmental Analysis Formats Pdf is a compilation of the most recent design trends as a series of slides. It is suitable for any subject or industry presentation, containing attractive visuals and photo spots for businesses to clearly express their messages. This template contains a variety of slides for the user to input data, such as structures to contrast two elements, bullet points, and slides for written information. Slidegeeks is prepared to create an impression. Following slide exhibits dashboard to determine impact of environmental assessment on business performance. It include indicators such as business health, tasks, progress, cost , time etc.
Presenting 100 Days Business Plan Checklist Icon To Track Performance Download PDF to dispense important information. This template comprises three stages. It also presents valuable insights into the topics including 100 Days Business Plan, Checklist Icon, Track Performance. This is a completely customizable PowerPoint theme that can be put to use immediately. So, download it and address the topic impactfully.
This slide represents dashboard showcasing advertising campaign performance progress which helps to manage marketing activities effectively. It provides information regarding total marketing cost, website impressions, content clicks, customer acquisition, cost per campaign etc. Showcasing this set of slides titled Promotional Campaign Performance Tracking Dashboard For Business Growth Information PDF. The topics addressed in these templates are Website Impression, Content Clicks, Customer Acquisition . All the content presented in this PPT design is completely editable. Download it and make adjustments in color, background, font etc. as per your unique business setting.
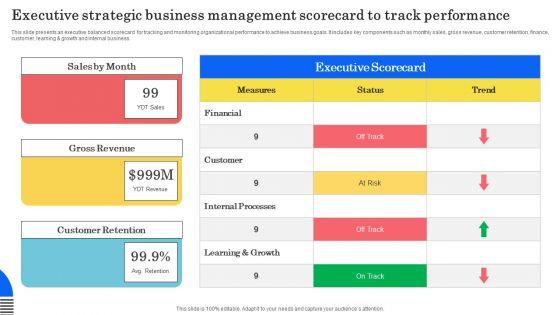
This slide presents an executive balanced scorecard for tracking and monitoring organizational performance to achieve business goals. It includes key components such as monthly sales, gross revenue, customer retention, finance, customer, learning and growth and internal business. Showcasing this set of slides titled Executive Strategic Business Management Scorecard To Track Performance Microsoft PDF. The topics addressed in these templates are Customer, Financial, Learning Growth. All the content presented in this PPT design is completely editable. Download it and make adjustments in color, background, font etc. as per your unique business setting.
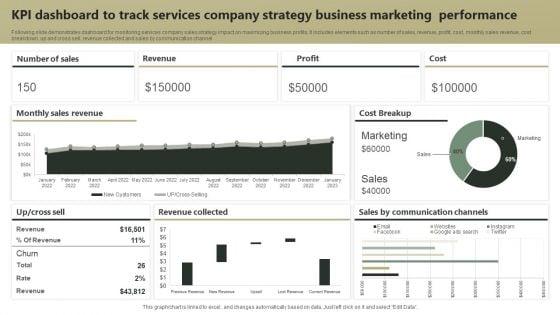
Following slide demonstrates dashboard for monitoring services company sales strategy impact on maximizing business profits. It includes elements such as number of sales, revenue, profit, cost, monthly sales revenue, cost breakdown, up and cross sell, revenue collected and sales by communication channel. Showcasing this set of slides titled KPI Dashboard To Track Services Company Strategy Business Marketing Performance Guidelines PDF. The topics addressed in these templates are Revenue, Profit, Cost. All the content presented in this PPT design is completely editable. Download it and make adjustments in color, background, font etc. as per your unique business setting.
DISPLAYING: 60 of 67 Item(s)
Page