- Sign up
- Sign In
 AI PPT Maker
 Templates
 PPT Bundles
 Design Services
 Business PPTs
 Business Plan
 Management
 Strategy
 Introduction PPT
 Roadmap
 Self Introduction
 Timelines
 Process
 Marketing
 Agenda
 Technology
 Medical
 Startup Business Plan
 Cyber Security
 Dashboards
 SWOT
SWOT Proposals
 Education
 Pitch Deck
 Digital Marketing
 KPIs
KPIs Project Management
 Product Management
 Artificial Intelligence
 Target Market
 Communication
 Supply Chain
 Google Slides
 Research Services
 One Pagers
 All Categories
Statistics outlining company PowerPoint Presentation Templates and Google Slides
16 Item(s)
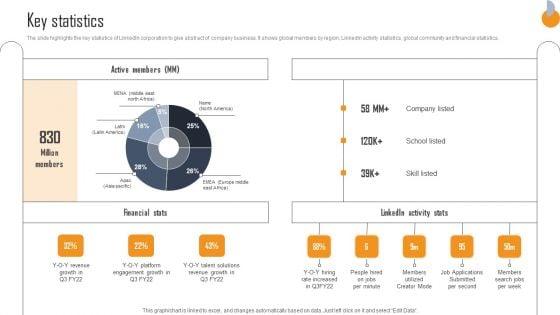
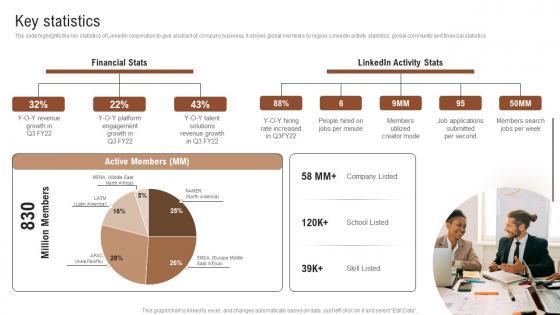
The slide highlights the key statistics of LinkedIn corporation to give abstract of company business. It shows global members by region, LinkedIn activity statistics, global community and financial statistics. Make sure to capture your audiences attention in your business displays with our gratis customizable Business Connection Network Company Outline Key Statistics Designs PDF. These are great for business strategies, office conferences, capital raising or task suggestions. If you desire to acquire more customers for your tech business and ensure they stay satisfied, create your own sales presentation with these plain slides.
The slide highlights the key statistics of LinkedIn corporation to give abstract of company business. It shows global members by region, LinkedIn activity statistics, global community and financial statistics.Deliver an awe inspiring pitch with this creative Linkedin Company Outline Key Statistics Summary PDF bundle. Topics like Revenue Growth, Platform Engagement Growth, Solutions Revenue can be discussed with this completely editable template. It is available for immediate download depending on the needs and requirements of the user.


This slide provides the glimpse about the current statistics of the company such as projects having no baseline, number of projects failing, projects meeting budget and quality goals, amount wasted by the company due to lack of project performance. This is a project management outline for schedule performance index current statistics of a software company diagrams pdf template with various stages. Focus and dispense information on five stages using this creative set, that comes with editable features. It contains large content boxes to add your information on topics like performance, management, budget, quality goals, lack of involvement. You can also showcase facts, figures, and other relevant content using this PPT layout. Grab it now.

Current User Statistics Of The Company Before Digital Marketing Implementation Ppt Outline Ideas PDF
Deliver an awe inspiring pitch with this creative current user statistics of the company before digital marketing implementation ppt outline ideas pdf bundle. Topics like rate, current user statistics of the company before digital marketing implementation can be discussed with this completely editable template. It is available for immediate download depending on the needs and requirements of the user.


The slide provides a key facts and figures related to companies financials and operations. Key facts include Revenue, Interest Income, Net Income, Total Deposits, Number of Branches etc. Deliver an awe-inspiring pitch with this creative key statistics related to companys financials and operations ppt outline example pdf. bundle. Topics like net income, revenue, interest income can be discussed with this completely editable template. It is available for immediate download depending on the needs and requirements of the user.
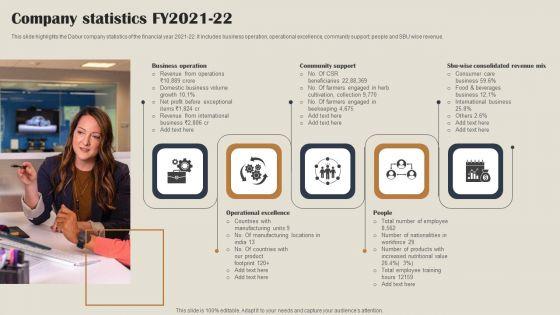


This slide highlights the Dabur company statistics of the financial year 2021-22. It includes business operation, operational excellence, community support, people and SBU wise revenue. Want to ace your presentation in front of a live audience Our Self Care Products Company Outline Company Statistics FY2021 22 Professional PDF can help you do that by engaging all the users towards you. Slidegeeks experts have put their efforts and expertise into creating these impeccable powerpoint presentations so that you can communicate your ideas clearly. Moreover, all the templates are customizable, and easy to edit and downloadable. Use these for both personal and commercial use.
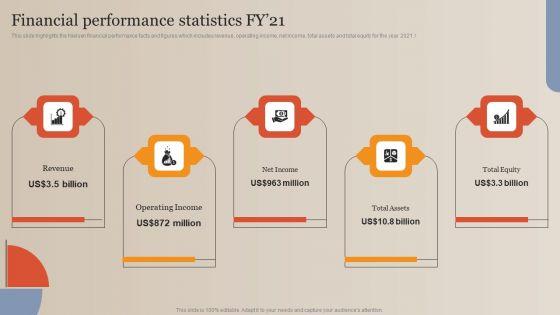
This slide highlights the Nielsen financial performance facts and figures which includes revenue, operating income, net income, total assets and total equity for the year 2021. Do you know about Slidesgeeks Market Study Company Outline Financial Performance Statistics FY 21 Summary PDF. These are perfect for delivering any kind od presentation. Using it, create PowerPoint presentations that communicate your ideas and engage audiences. Save time and effort by using our pre designed presentation templates that are perfect for a wide range of topic. Our vast selection of designs covers a range of styles, from creative to business, and are all highly customizable and easy to edit. Download as a PowerPoint template or use them as Google Slides themes.

This slide focuses on key statistics of interior design company which includes utilization rate, average revenue per employee, operating profit margin, working capital, customer retention rate, etc. Presenting Interior Design Company Outline Key Financial Statistics Ppt PowerPoint Presentation Gallery Information PDF to provide visual cues and insights. Share and navigate important information on one stages that need your due attention. This template can be used to pitch topics like Revenue Per Employee, Operating Profit Margin, Customer Retention Rate. In addtion, this PPT design contains high resolution images, graphics, etc, that are easily editable and available for immediate download.

The slide highlights the key statistical data of Unschool company illustrating count of internship partners, industry experts, and active learners. It also showcases revenue, placement rate, course prices, course completion rate and Q-O-Q growth rate. Do you have to make sure that everyone on your team knows about any specific topic I yes, then you should give Educational Technology Company Outline Key Statistics Professional PDF a try. Our experts have put a lot of knowledge and effort into creating this impeccable Educational Technology Company Outline Key Statistics Professional PDF. You can use this template for your upcoming presentations, as the slides are perfect to represent even the tiniest detail. You can download these templates from the Slidegeeks website and these are easy to edit. So grab these today.

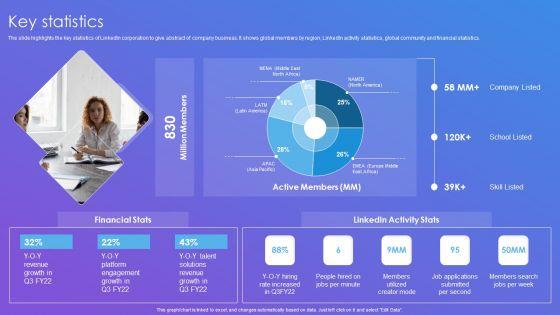
The slide highlights the key statistics of LinkedIn corporation to give abstract of company business. It shows global members by region, LinkedIn activity statistics, global community and financial statistics. Get a simple yet stunning designed Key Statistics Talent Recruitment Company Outline Ideas Pdf. It is the best one to establish the tone in your meetings. It is an excellent way to make your presentations highly effective. So, download this PPT today from Slidegeeks and see the positive impacts. Our easy to edit Key Statistics Talent Recruitment Company Outline Ideas Pdf can be your go to option for all upcoming conferences and meetings. So, what are you waiting for Grab this template today. The slide highlights the key statistics of LinkedIn corporation to give abstract of company business. It shows global members by region, LinkedIn activity statistics, global community and financial statistics.
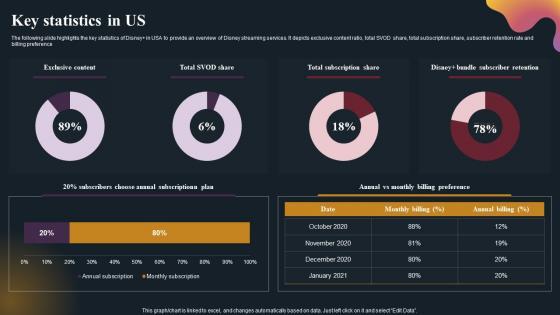

The following slide highlights the key statistics of DisneyPlus in USA to provide an overview of Disney streaming services. It depicts exclusive content ratio, total SVOD share, total subscription share, subscriber retention rate and billing preference. Crafting an eye-catching presentation has never been more straightforward. Let your presentation shine with this tasteful yet straightforward Key Statistics In Us OTT Platform Company Outline Brochure Pdf template. It offers a minimalistic and classy look that is great for making a statement. The colors have been employed intelligently to add a bit of playfulness while still remaining professional. Construct the ideal Key Statistics In Us OTT Platform Company Outline Brochure Pdf that effortlessly grabs the attention of your audience Begin now and be certain to wow your customers The following slide highlights the key statistics of DisneyPlus in USA to provide an overview of Disney streaming services. It depicts exclusive content ratio, total SVOD share, total subscription share, subscriber retention rate and billing preference

This slide highlights the Nielsen financial performance facts and figures which includes revenue, operating income, net income, total assets and total equity for the year 2021. Coming up with a presentation necessitates that the majority of the effort goes into the content and the message you intend to convey. The visuals of a PowerPoint presentation can only be effective if it supplements and supports the story that is being told. Keeping this in mind our experts created Data And Customer Analysis Company Outline Financial Performance Statistics FY21 Professional PDF to reduce the time that goes into designing the presentation. This way, you can concentrate on the message while our designers take care of providing you with the right template for the situation.
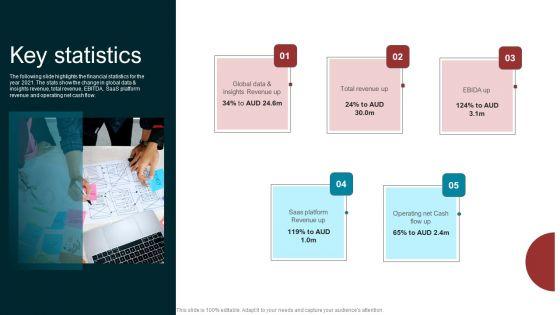
The following slide highlights the financial statistics for the year 2021. The stats show the change in global data and insights revenue, total revenue, EBITDA, SaaS platform revenue and operating net cash flow. The Marketing Agency Company Outline Key Statistics Structure PDF is a compilation of the most recent design trends as a series of slides. It is suitable for any subject or industry presentation, containing attractive visuals and photo spots for businesses to clearly express their messages. This template contains a variety of slides for the user to input data, such as structures to contrast two elements, bullet points, and slides for written information. Slidegeeks is prepared to create an impression.
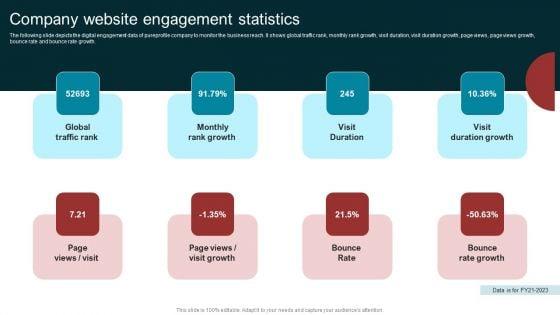
The following slide depicts the digital engagement data of pureprofile company to monitor the business reach. It shows global traffic rank, monthly rank growth, visit duration, visit duration growth, page views, page views growth, bounce rate and bounce rate growth. Find highly impressive Marketing Agency Company Outline Company Website Engagement Statistics Guidelines PDF on Slidegeeks to deliver a meaningful presentation. You can save an ample amount of time using these presentation templates. No need to worry to prepare everything from scratch because Slidegeeks experts have already done a huge research and work for you. You need to download Marketing Agency Company Outline Company Website Engagement Statistics Guidelines PDF for your upcoming presentation. All the presentation templates are 100 percent editable and you can change the color and personalize the content accordingly. Download now.

This slide highlights the Canva key facesand figures which includes monthly active users, total designs created, countries presence, employees, website languages support, and offices. Find highly impressive Picture Editing Company Outline Statistics User Count And Offices Topics PDF on Slidegeeks to deliver a meaningful presentation. You can save an ample amount of time using these presentation templates. No need to worry to prepare everything from scratch because Slidegeeks experts have already done a huge research and work for you. You need to download Picture Editing Company Outline Statistics User Count And Offices Topics PDF for your upcoming presentation. All the presentation templates are 100 percent editable and you can change the color and personalize the content accordingly. Download now.
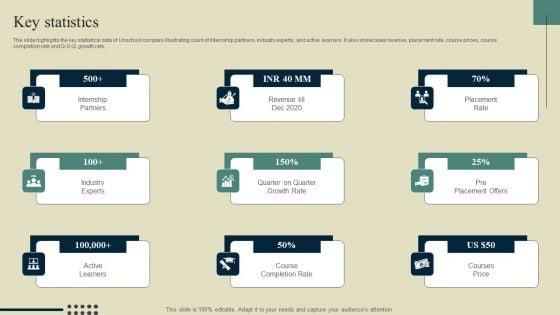
The slide highlights the key statistical data of Unschool company illustrating count of internship partners, industry experts, and active learners. It also showcases revenue, placement rate, course prices, course completion rate and Q-O-Q growth rate. Do you have to make sure that everyone on your team knows about any specific topic I yes, then you should give E Learning Platform Company Outline Key Statistics Brochure PDF a try. Our experts have put a lot of knowledge and effort into creating this impeccable E Learning Platform Company Outline Key Statistics Brochure PDF. You can use this template for your upcoming presentations, as the slides are perfect to represent even the tiniest detail. You can download these templates from the Slidegeeks website and these are easy to edit. So grab these today.
16 Item(s)