- Sign up
- Sign In
 AI PPT Maker
 Templates
 PPT Bundles
 Design Services
 Business PPTs
 Business Plan
 Management
 Strategy
 Introduction PPT
 Roadmap
 Self Introduction
 Timelines
 Process
 Marketing
 Agenda
 Technology
 Medical
 Startup Business Plan
 Cyber Security
 Dashboards
 SWOT
SWOT Proposals
 Education
 Pitch Deck
 Digital Marketing
 KPIs
KPIs Project Management
 Product Management
 Artificial Intelligence
 Target Market
 Communication
 Supply Chain
 Google Slides
 Research Services
 One Pagers
 All Categories
Statistical power PowerPoint Presentation Templates and Google Slides
DISPLAYING: 60 of 264 Item(s)
Page


Boost your confidence and team morale with this well-structured statistical tools cloud management ppt powerpoint presentation complete deck with slides. This prefabricated set gives a voice to your presentation because of its well-researched content and graphics. Our experts have added all the components very carefully, thus helping you deliver great presentations with a single click. Not only that, it contains a set of twenty nine slides that are designed using the right visuals, graphics, etc. Various topics can be discussed, and effective brainstorming sessions can be conducted using the wide variety of slides added in this complete deck. Apart from this, our PPT design contains clear instructions to help you restructure your presentations and create multiple variations. The color, format, design anything can be modified as deemed fit by the user. Not only this, it is available for immediate download. So, grab it now.

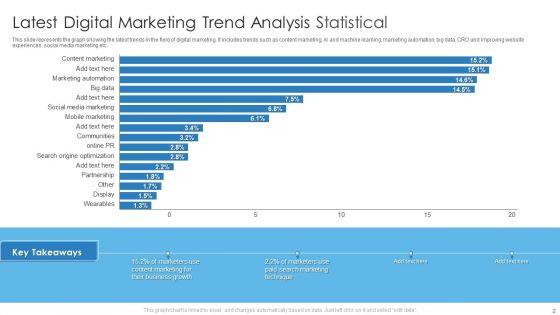


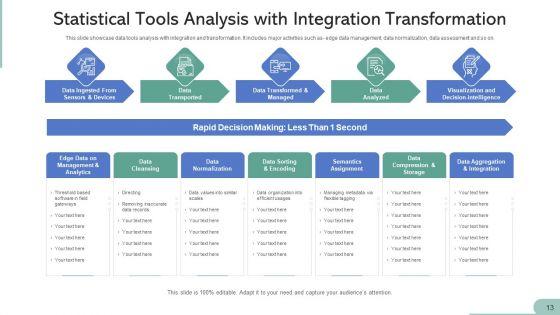
Improve your presentation delivery using this Statistical Trend Analysis Ppt PowerPoint Presentation Complete With Slides. Support your business vision and objectives using this well-structured PPT deck. This template offers a great starting point for delivering beautifully designed presentations on the topic of your choice. Comprising twenty four this professionally designed template is all you need to host discussion and meetings with collaborators. Each slide is self-explanatory and equipped with high-quality graphics that can be adjusted to your needs. Therefore, you will face no difficulty in portraying your desired content using this PPT slideshow. This PowerPoint slideshow contains every important element that you need for a great pitch. It is not only editable but also available for immediate download and utilization. The color, font size, background, shapes everything can be modified to create your unique presentation layout. Therefore, download it now.


Boost your confidence and team morale with this well-structured statistical data ppt powerpoint presentation complete deck with slides. This prefabricated set gives a voice to your presentation because of its well-researched content and graphics. Our experts have added all the components very carefully, thus helping you deliver great presentations with a single click. Not only that, it contains a set of twelve slides that are designed using the right visuals, graphics, etc. Various topics can be discussed, and effective brainstorming sessions can be conducted using the wide variety of slides added in this complete deck. Apart from this, our PPT design contains clear instructions to help you restructure your presentations and create multiple variations. The color, format, design anything can be modified as deemed fit by the user. Not only this, it is available for immediate download. So, grab it now.


Presenting this set of slides with name statistical distribution of energy comparison chart ppt powerpoint presentation icon summary. The topics discussed in these slides are energy efficiency, energy comparison, electricity. This is a completely editable PowerPoint presentation and is available for immediate download. Download now and impress your audience.
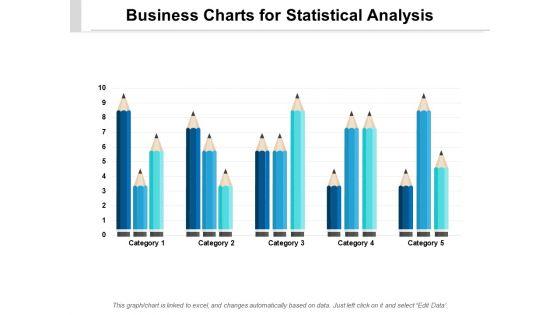


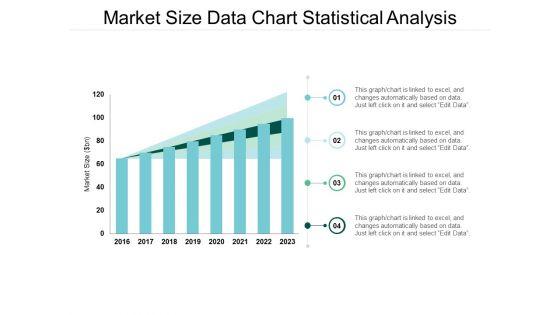
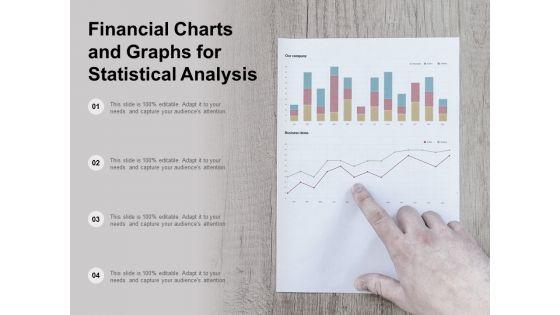
Presenting this set of slides with name business charts for statistical analysis ppt powerpoint presentation pictures gridlines. The topics discussed in these slides are education, growth, pencil bar graph. This is a completely editable PowerPoint presentation and is available for immediate download. Download now and impress your audience.


Presenting this set of slides with name statistical forecasting ppt powerpoint presentation infographic template deck cpb. This is an editable Powerpoint four stages graphic that deals with topics like statistical forecasting to help convey your message better graphically. This product is a premium product available for immediate download and is 100 percent editable in Powerpoint. Download this now and use it in your presentations to impress your audience.
Presenting this set of slides with name statistical analysis vector icon ppt powerpoint presentation layouts tips. This is a one stage process. The stages in this process are market entry analysis, market attractiveness, strategic analysis. This is a completely editable PowerPoint presentation and is available for immediate download. Download now and impress your audience.
Presenting this set of slides with name statistical statement vector icon ppt powerpoint presentation styles graphics pictures. This is a one stage process. The stages in this process are data report, infographics brochure, business statement. This is a completely editable PowerPoint presentation and is available for immediate download. Download now and impress your audience.


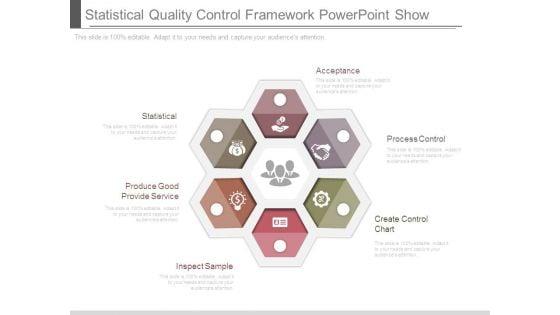
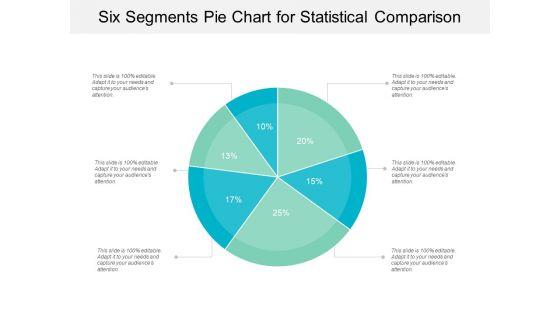
Statistical Tools For Data Analysis And Interpretation Ppt PowerPoint Presentation Portfolio Visuals
Presenting this set of slides with name Statistical Tools For Data Analysis And Interpretation Ppt PowerPoint Presentation Portfolio Visuals. This is a six process. The stages in this process are marketing, management, measuring results. This is a completely editable PowerPoint presentation and is available for immediate download. Download now and impress your audience.


Presenting this set of slides with name statistical data chart on screen monitor ppt powerpoint presentation outline summary. This is a one stage process. The stages in this process are data icon, status icon, status symbol icon. This is a completely editable PowerPoint presentation and is available for immediate download. Download now and impress your audience.
Presenting this set of slides with name magnifying glass with arrow statistical analysis vector icon ppt powerpoint presentation show icon. This is a three stage process. The stages in this process are data icon, status icon, status symbol icon. This is a completely editable PowerPoint presentation and is available for immediate download. Download now and impress your audience.
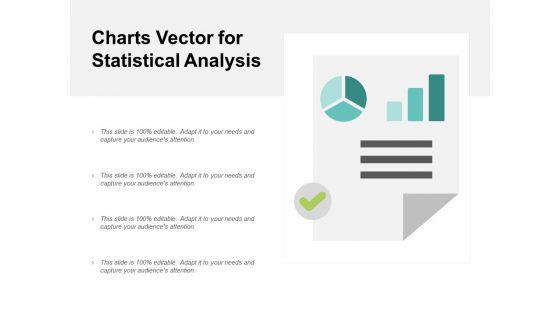


Presenting this set of slides with name charts vector for statistical analysis ppt powerpoint presentation layouts professional. The topics discussed in these slides are data icon, status icon, status symbol icon. This is a completely editable PowerPoint presentation and is available for immediate download. Download now and impress your audience.


Presenting this set of slides with name crm implementation statistical techniques ppt powerpoint presentation visual aids infographics cpb. This is an editable Powerpoint five stages graphic that deals with topics like crm implementation statistical techniques to help convey your message better graphically. This product is a premium product available for immediate download and is 100 percent editable in Powerpoint. Download this now and use it in your presentations to impress your audience.
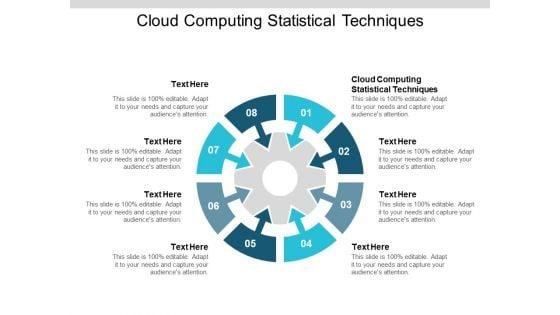


Presenting this set of slides with name cloud computing statistical techniques ppt powerpoint presentation information cpb. This is an editable Powerpoint eight stages graphic that deals with topics like cloud computing statistical techniques to help convey your message better graphically. This product is a premium product available for immediate download and is 100 percent editable in Powerpoint. Download this now and use it in your presentations to impress your audience.
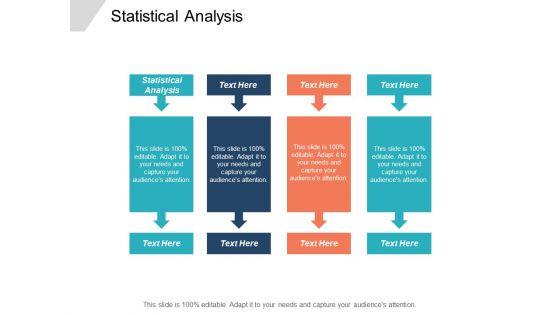


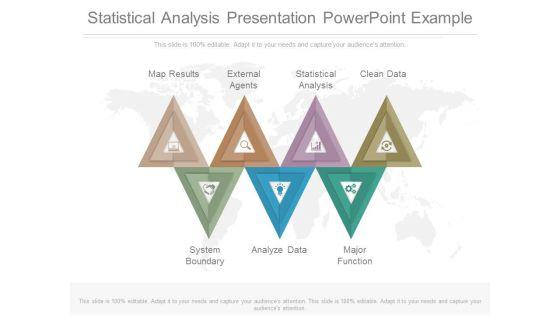
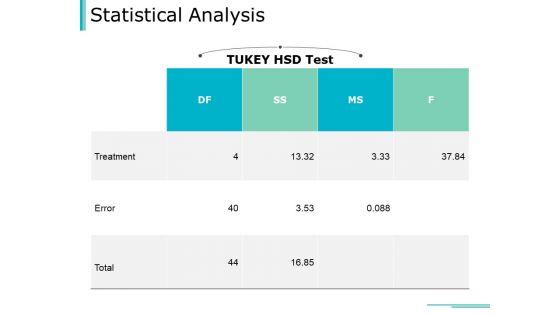
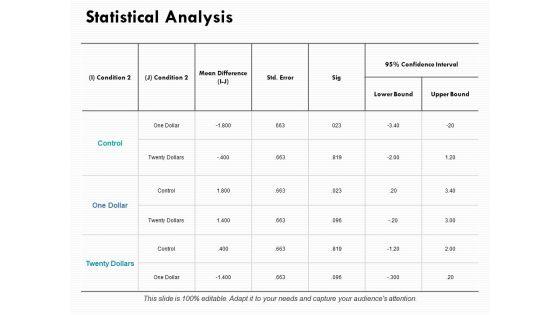
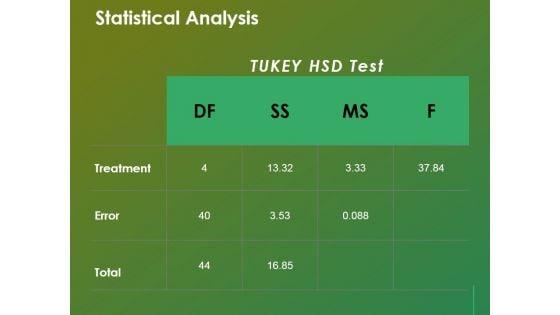
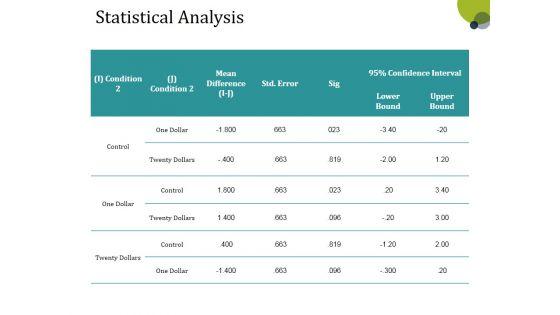
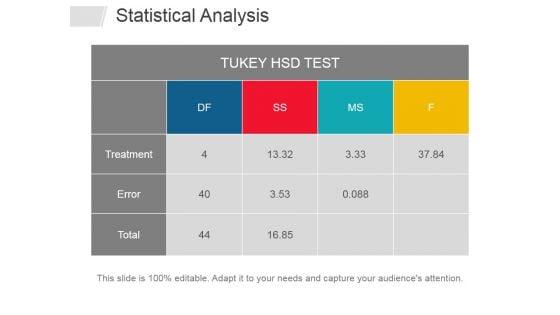
Presenting this set of slides with name statistical analysis ppt powerpoint presentation styles visual aids cpb. This is a four stage process. The stages in this process are statistical analysis. This is a completely editable PowerPoint presentation and is available for immediate download. Download now and impress your audience.


DISPLAYING: 60 of 264 Item(s)
Page