- Sign up
- Sign In
 AI PPT Maker
 Templates
 PPT Bundles
 Design Services
 Business PPTs
 Business Plan
 Management
 Strategy
 Introduction PPT
 Roadmap
 Self Introduction
 Timelines
 Process
 Marketing
 Agenda
 Technology
 Medical
 Startup Business Plan
 Cyber Security
 Dashboards
 SWOT
SWOT Proposals
 Education
 Pitch Deck
 Digital Marketing
 KPIs
KPIs Project Management
 Product Management
 Artificial Intelligence
 Target Market
 Communication
 Supply Chain
 Google Slides
 Research Services
 One Pagers
 All Categories
Statistical graphs PowerPoint Presentation Templates and Google Slides
56 Item(s)
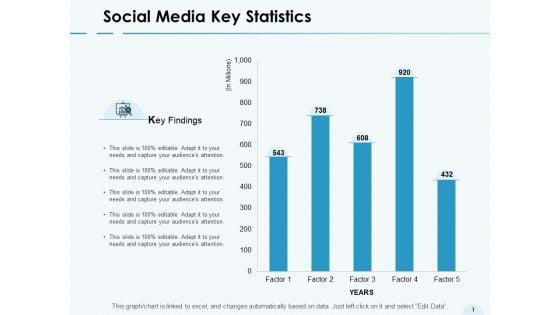


Presenting this set of slides with name social media key statistics bar graph ppt powerpoint presentation inspiration images. The topics discussed in these slides are marketing, business, management, planning, strategy. This is a completely editable PowerPoint presentation and is available for immediate download. Download now and impress your audience.


Presenting this set of slides with name presentation of workers statistics in graph ppt powerpoint presentation visual aids. This is a five stage process. The stages in this process are people graph, sales performance, population data demographics. This is a completely editable PowerPoint presentation and is available for immediate download. Download now and impress your audience.


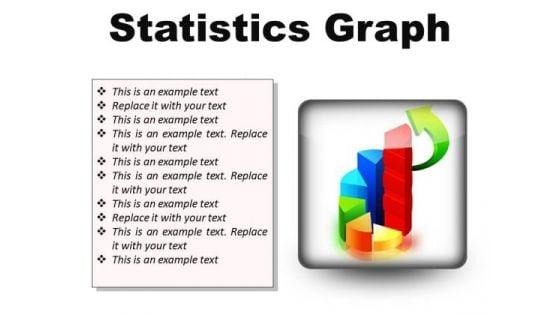
Draw away from doubts with our Statistical Graph Illustration PowerPoint Templates PPT Backgrounds For Slides 0713. Connect your thoughts to the positives. Attract a crowd with our Pie charts PowerPoint Templates. They will drop it all and come to hear you. They will come in droves to hear your views. Our Sales PowerPoint Templates will have them dripping excitement. Manage growth with our Statistical Graph Illustration PowerPoint Templates Ppt Backgrounds For Slides 0713. Download without worries with our money back guaranteee.


We present our Business Growth Graph Statistical Diagram PowerPoint Templates PPT Backgrounds For Slides 0413.Download and present our Globe PowerPoint Templates because It can Leverage your style with our PowerPoint Templates and Slides. Charm your audience with your ability. Download and present our Earth PowerPoint Templates because Our PowerPoint Templates and Slides will embellish your thoughts. See them provide the desired motivation to your team. Download and present our Arrows PowerPoint Templates because These PowerPoint Templates and Slides will give the updraft to your ideas. See them soar to great heights with ease. Present our Finance PowerPoint Templates because They will bring a lot to the table. Their alluring flavours will make your audience salivate. Download and present our Business PowerPoint Templates because Timeline crunches are a fact of life. Meet all deadlines using our PowerPoint Templates and Slides.Use these PowerPoint slides for presentations relating to Statistics graphs and charts, globe, earth, arrows, finance, business. The prominent colors used in the PowerPoint template are Green, Blue, White. Arrive at base camp with our Business Growth Graph Statistical Diagram PowerPoint Templates Ppt Backgrounds For Slides 0413. Your thoughts will then begin the ascent.


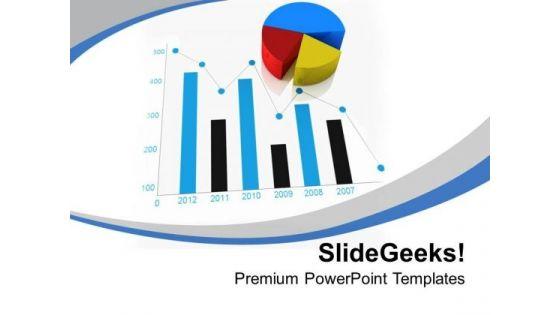
We present our Business Growth Graph And Statistical Chart PowerPoint Templates PPT Backgrounds For Slides 0413.Present our Arrows PowerPoint Templates because Your success is our commitment. Our PowerPoint Templates and Slides will ensure you reach your goal. Download our Pie Charts PowerPoint Templates because Our PowerPoint Templates and Slides will let Your superior ideas hit the target always and everytime. Download and present our Business PowerPoint Templates because These PowerPoint Templates and Slides will give the updraft to your ideas. See them soar to great heights with ease. Use our Success PowerPoint Templates because You are an avid believer in ethical practices. Highlight the benefits that accrue with our PowerPoint Templates and Slides. Download and present our Future PowerPoint Templates because You have a driving passion to excel in your field. Our PowerPoint Templates and Slides will prove ideal vehicles for your ideas.Use these PowerPoint slides for presentations relating to Statistics graphs and charts, arrows, pie charts, business, success, future. The prominent colors used in the PowerPoint template are Red, Gray, Green. Facilitate your entry into that exclusive group. Establish your claim with our Business Growth Graph And Statistical Chart PowerPoint Templates Ppt Backgrounds For Slides 0413.
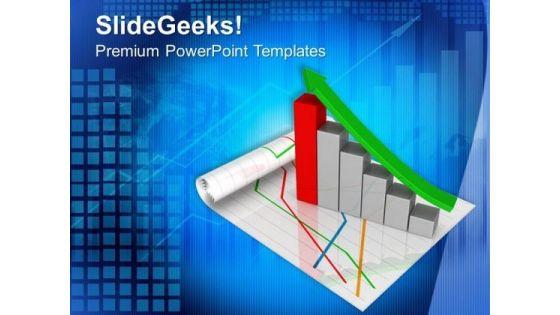
We present our Statistical Business Graph To Achieve Success PowerPoint Templates PPT Backgrounds For Slides 0413.Present our Business PowerPoint Templates because You can Bask in the warmth of our PowerPoint Templates and Slides. Enjoy the heartfelt glowing response of your listeners. Download and present our Process and Flows PowerPoint Templates because Our PowerPoint Templates and Slides will bullet point your ideas. See them fall into place one by one. Use our Marketing PowerPoint Templates because You can Bask in the warmth of our PowerPoint Templates and Slides. Enjoy the heartfelt glowing response of your listeners. Use our Success PowerPoint Templates because Our PowerPoint Templates and Slides has conjured up a web of all you need with the help of our great team. Use them to string together your glistening ideas. Download and present our Future PowerPoint Templates because Our PowerPoint Templates and Slides offer you the widest possible range of options.Use these PowerPoint slides for presentations relating to Statistical chart business graph, business, process and flows, marketing, success, future . The prominent colors used in the PowerPoint template are Red, Green, Blue. Make use of the facilities our Statistical Business Graph To Achieve Success PowerPoint Templates Ppt Backgrounds For Slides 0413 offer. You will be delighted with the choices available.


We present our Statistical Business Graph PowerPoint Templates PPT Backgrounds For Slides 0313.Download and present our Arrows PowerPoint Templates because you can Add colour to your speech with our PowerPoint Templates and Slides. Your presentation will leave your audience speechless. Present our Business PowerPoint Templates because You can Be the star of the show with our PowerPoint Templates and Slides. Rock the stage with your ideas. Download and present our Marketing PowerPoint Templates because Our PowerPoint Templates and Slides will let you meet your Deadlines. Use our Success PowerPoint Templates because You are working at that stage with an air of royalty. Let our PowerPoint Templates and Slides be the jewels in your crown. Download our Future PowerPoint Templates because It can Leverage your style with our PowerPoint Templates and Slides. Charm your audience with your ability.Use these PowerPoint slides for presentations relating to Business progress graph with arrow, arrows, business, marketing, success, future. The prominent colors used in the PowerPoint template are Red, Green, Yellow. Lock horns with our Statistical Business Graph PowerPoint Templates Ppt Backgrounds For Slides 0313. You will be at the top of your game.
We present our Analysis Of Statistical Business Graph PowerPoint Templates PPT Backgrounds For Slides 0313.Use our Success PowerPoint Templates because Our PowerPoint Templates and Slides offer you the widest possible range of options. Use our Marketing PowerPoint Templates because Our PowerPoint Templates and Slides will Embellish your thoughts. They will help you illustrate the brilliance of your ideas. Download our Shapes PowerPoint Templates because You are an avid believer in ethical practices. Highlight the benefits that accrue with our PowerPoint Templates and Slides. Download and present our Signs PowerPoint Templates because Our PowerPoint Templates and Slides has conjured up a web of all you need with the help of our great team. Use them to string together your glistening ideas. Present our Business PowerPoint Templates because Our PowerPoint Templates and Slides will generate and maintain the level of interest you desire. They will create the impression you want to imprint on your audience.Use these PowerPoint slides for presentations relating to Bar graph, success, marketing, shapes, signs, business. The prominent colors used in the PowerPoint template are Red, Blue, Yellow. Brilliant backdrops are the essence of our Analysis Of Statistical Business Graph PowerPoint Templates Ppt Backgrounds For Slides 0313. Guaranteed to impress your audience.

We present our Business Graph Statistical Diagram PowerPoint Templates PPT Backgrounds For Slides 0213.Use our Arrows PowerPoint Templates because You aspire to touch the sky with glory. Let our PowerPoint Templates and Slides provide the fuel for your ascent. Present our Business PowerPoint Templates because It will Give impetus to the hopes of your colleagues. Our PowerPoint Templates and Slides will aid you in winning their trust. Download and present our Finance PowerPoint Templates because You can Inspire your team with our PowerPoint Templates and Slides. Let the force of your ideas flow into their minds. Download our Success PowerPoint Templates because Our PowerPoint Templates and Slides will give good value for money. They also have respect for the value of your time. Use our Marketing PowerPoint Templates because You can Stir your ideas in the cauldron of our PowerPoint Templates and Slides. Cast a magic spell on your audience.Use these PowerPoint slides for presentations relating to Business arrow showing growth progress, arrows, success, business, finance, marketing. The prominent colors used in the PowerPoint template are Green, White, Black. Enforce visions with our Business Graph Statistical Diagram PowerPoint Templates Ppt Backgrounds For Slides 0213. Download without worries with our money back guaranteee.
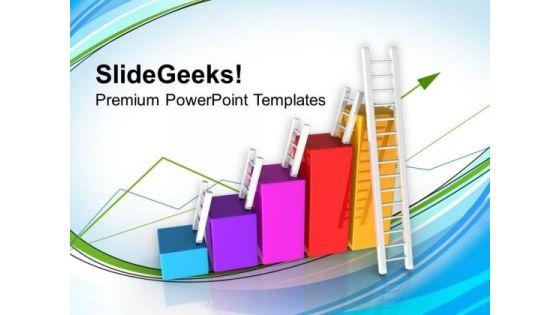
We present our Bar Graph With Ladder Statistical Business PowerPoint Templates PPT Backgrounds For Slides 0213.Present our Marketing PowerPoint Templates because You should Press the right buttons with our PowerPoint Templates and Slides. They will take your ideas down the perfect channel. Present our Business PowerPoint Templates because Our PowerPoint Templates and Slides will effectively help you save your valuable time. They are readymade to fit into any presentation structure. Download and present our Finance PowerPoint Templates because It can Bubble and burst with your ideas. Download our Success PowerPoint Templates because It will Strengthen your hand with your thoughts. They have all the aces you need to win the day. Use our Ladders PowerPoint Templates because Our PowerPoint Templates and Slides help you pinpoint your timelines. Highlight the reasons for your deadlines with their use.Use these PowerPoint slides for presentations relating to Simple graph with ladder , success, marketing, ladders, business, finance. The prominent colors used in the PowerPoint template are Red, Pink, Purple. With our Bar Graph With Ladder Statistical Business PowerPoint Templates Ppt Backgrounds For Slides 0213 duds are few and far between. But even they give you a bang for your buck.


Rescue Statistics Bar Business PowerPoint Templates And PowerPoint Themes Power Point-Microsoft Powerpoint Templates and Background with rescue statistics bar Become an expert presenter with our Rescue Statistics Bar Graph Business PowerPoint Templates And PowerPoint Themes 0712. Dont waste time struggling with PowerPoint. Let us do it for you.


This slide showcases the bar graph that depicts objectives of sales automation which includes improve campaign effectiveness, marketing alignment, data systems, etc. The Statistical Graph Showcasing Objectives Of Sales Automation Summary And Significance Of Sales Automation Inspiration PDF is a compilation of the most recent design trends as a series of slides. It is suitable for any subject or industry presentation, containing attractive visuals and photo spots for businesses to clearly express their messages. This template contains a variety of slides for the user to input data, such as structures to contrast two elements, bullet points, and slides for written information. Slidegeeks is prepared to create an impression.


This slide shows the graph representing the emerging trends in the banking industry. It includes trends such as use of APIs and open banking, investments in innovation initiatives, expansion of digital payments etc. Deliver and pitch your topic in the best possible manner with this Upcoming Trends Analysis In Banking Industry Statistical Graph Brochure PDF. Use them to share invaluable insights on Upcoming Trends Analysis, Banking Industry Statistical Graph and impress your audience. This template can be altered and modified as per your expectations. So, grab it now.
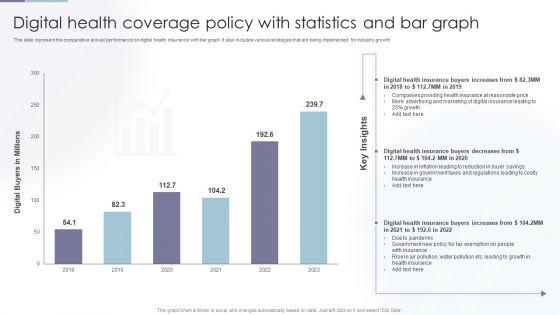

Showcasing this set of slides titled Digital Health Coverage Policy With Statistics And Bar Graph Clipart PDF. The topics addressed in these templates are Digital Health, Health Insurance, Insurance At Reasonable. All the content presented in this PPT design is completely editable. Download it and make adjustments in color, background, font etc. as per your unique business setting.
Presenting Icon Of Statistical Chart Presenting Growth Trend Graph Brochure PDF to dispense important information. This template comprises Four stages. It also presents valuable insights into the topics including Icon Of Statistical, Chart Presenting, Growth Trend This is a completely customizable PowerPoint theme that can be put to use immediately. So, download it and address the topic impactfully.
Persuade your audience using this statistical data icon of poll graph depicting elections result introduction pdf. This PPT design covers four stages, thus making it a great tool to use. It also caters to a variety of topics including statistical data icon of poll graph depicting elections result. Download this PPT design now to present a convincing pitch that not only emphasizes the topic but also showcases your presentation skills.
Presenting statistical data icon of data analytics using bar graph background pdf to dispense important information. This template comprises four stages. It also presents valuable insights into the topics including statistical data icon of data analytics using bar graph. This is a completely customizable PowerPoint theme that can be put to use immediately. So, download it and address the topic impactfully.
Presenting statistical data graph icon showing financial forecast rules pdf to dispense important information. This template comprises four stages. It also presents valuable insights into the topics including statistical data graph icon showing financial forecast. This is a completely customizable PowerPoint theme that can be put to use immediately. So, download it and address the topic impactfully.
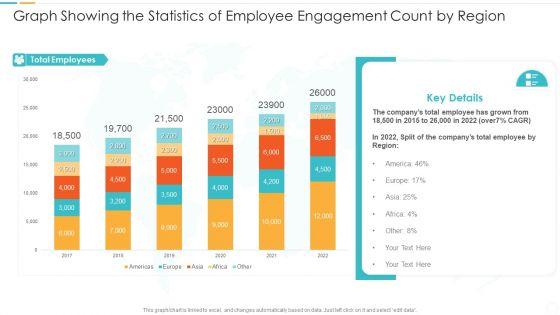
Pitch your topic with ease and precision using this graph showing the statistics of employee engagement count by region formats pdf. This layout presents information on graph showing the statistics of employee engagement count by region. It is also available for immediate download and adjustment. So, changes can be made in the color, design, graphics or any other component to create a unique layout.
Persuade your audience using this employee engagement statistics icon with a graph and upward arrow rules pdf. This PPT design covers four stages, thus making it a great tool to use. It also caters to a variety of topics including employee engagement statistics icon with a graph and upward arrow. Download this PPT design now to present a convincing pitch that not only emphasizes the topic but also showcases your presentation skills.
Showcasing this set of slides titled statistics analysis graph vector icon ppt powerpoint presentation professional show pdf. The topics addressed in these templates are statistics analysis graph vector icon. All the content presented in this PPT design is completely editable. Download it and make adjustments in color, background, font etc. as per your unique business setting.
Presenting business statistics assessment graph icon ppt powerpoint presentation slides background images pdf to dispense important information. This template comprises three stages. It also presents valuable insights into the topics including business statistics assessment graph icon. This is a completely customizable PowerPoint theme that can be put to use immediately. So, download it and address the topic impactfully.
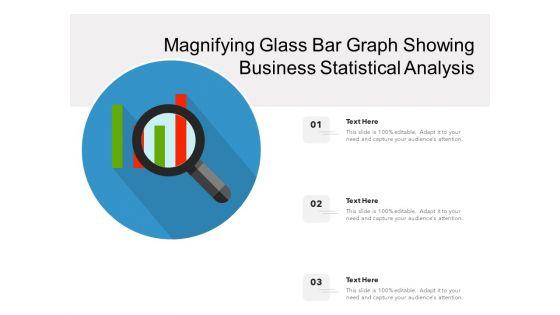
Presenting this set of slides with name magnifying glass bar graph showing business statistical analysis ppt powerpoint presentation file sample pdf. This is a three stage process. The stages in this process are magnifying glass bar graph showing business statistical analysis. This is a completely editable PowerPoint presentation and is available for immediate download. Download now and impress your audience.
Presenting this set of slides with name line graph icon for business statistical analysis ppt powerpoint presentation gallery clipart images pdf. The topics discussed in these slide is line graph icon for business statistical analysis. This is a completely editable PowerPoint presentation and is available for immediate download. Download now and impress your audience.
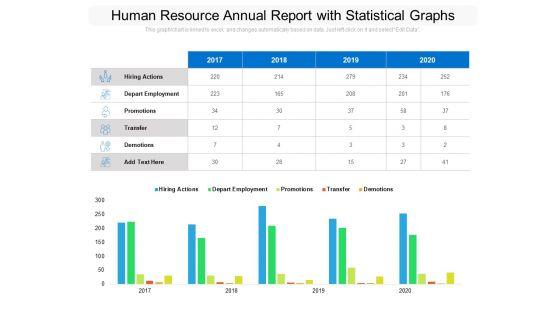
Presenting this set of slides with name human resource annual report with statistical graphs ppt powerpoint presentation infographics shapes pdf. The topics discussed in these slides are hiring actions, depart employment, promotions, transfer, demotions, 2017 to 2020. This is a completely editable PowerPoint presentation and is available for immediate download. Download now and impress your audience.
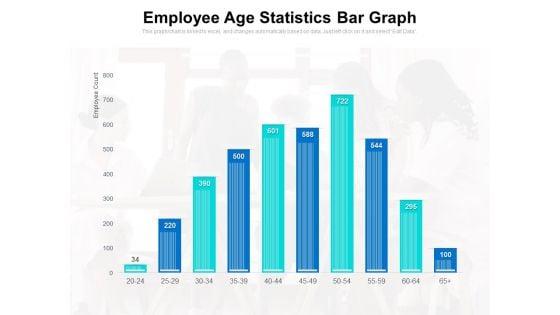
Presenting this set of slides with name employee age statistics bar graph ppt powerpoint presentation deck pdf. The topics discussed in these slide is employee age statistics bar graph. This is a completely editable PowerPoint presentation and is available for immediate download. Download now and impress your audience.


Presenting this set of slides with name business power consumption statistics bar graph ppt powerpoint presentation gallery slides pdf. The topics discussed in these slides are electricity, consumption, plant. This is a completely editable PowerPoint presentation and is available for immediate download. Download now and impress your audience.
Presenting this set of slides with name analyzing business risk with statistical graph icon ppt powerpoint presentation outline portfolio pdf. This is a one stage process. The stage in this process is analyzing business risk with statistical graph icon. This is a completely editable PowerPoint presentation and is available for immediate download. Download now and impress your audience.


Presenting Icon Depicting Energy Consumption Statistics Bar Graph Sample PDF to dispense important information. This template comprises three stages. It also presents valuable insights into the topics including Icon Depicting, Energy Consumption Statistics, Bar Graph. This is a completely customizable PowerPoint theme that can be put to use immediately. So, download it and address the topic impactfully.
Showcasing this set of slides titled Gap Assessment Icon With Statistics Graph Ppt PowerPoint Presentation Professional Information PDF. The topics addressed in these templates are Gap Assessment, Icon Statistics Graph. All the content presented in this PPT design is completely editable. Download it and make adjustments in color, background, font etc. as per your unique business setting.
Pitch your topic with ease and precision using this Gap Assessment Icon With Statistics Graph Slide Ppt PowerPoint Presentation Slides Layout PDF. This layout presents information on Gap Assessment, Icon Statistics Graph. It is also available for immediate download and adjustment. So, changes can be made in the color, design, graphics or any other component to create a unique layout.


The following slide provides a statistical graph showcasing the causes of pipeline damage incidents. It includes reasons such as excavation damage, incorrect operation, material failure of pipe, natural force damage, equipment failure, etc. Want to ace your presentation in front of a live audience Our IoT Solutions For Oil Statistical Graph Showcasing Reasons For Pipeline IoT SS V can help you do that by engaging all the users towards you. Slidegeeks experts have put their efforts and expertise into creating these impeccable powerpoint presentations so that you can communicate your ideas clearly. Moreover, all the templates are customizable, and easy-to-edit and downloadable. Use these for both personal and commercial use. The following slide provides a statistical graph showcasing the causes of pipeline damage incidents. It includes reasons such as excavation damage, incorrect operation, material failure of pipe, natural force damage, equipment failure, etc.
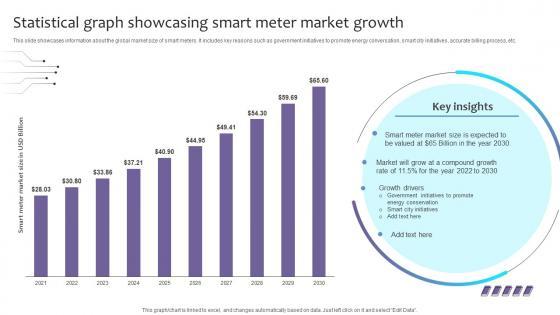

This slide showcases information about the global market size of smart meters. It includes key reasons such as government initiatives to promote energy conversation, smart city initiatives, accurate billing process, etc. The Empowering The Future Statistical Graph Showcasing Smart Meter Market Growth IoT SS V is a compilation of the most recent design trends as a series of slides. It is suitable for any subject or industry presentation, containing attractive visuals and photo spots for businesses to clearly express their messages. This template contains a variety of slides for the user to input data, such as structures to contrast two elements, bullet points, and slides for written information. Slidegeeks is prepared to create an impression. This slide showcases information about the global market size of smart meters. It includes key reasons such as government initiatives to promote energy conversation, smart city initiatives, accurate billing process, etc.
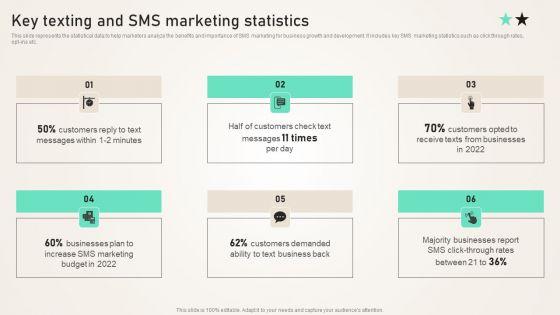
This slide represents the statistical data to help marketers analyze the benefits and importance of SMS marketing for business growth and development. It includes key SMS marketing statistics such as click through rates, opt-ins etc. Get a simple yet stunning designed Key Texting And SMS Marketing Statistics Ppt PowerPoint Presentation Diagram Graph Charts PDF. It is the best one to establish the tone in your meetings. It is an excellent way to make your presentations highly effective. So, download this PPT today from Slidegeeks and see the positive impacts. Our easy to edit Key Texting And SMS Marketing Statistics Ppt PowerPoint Presentation Diagram Graph Charts PDF can be your go to option for all upcoming conferences and meetings. So, what are you waiting for Grab this template today.
56 Item(s)