- Sign up
- Sign In
 AI PPT Maker
 Templates
 PPT Bundles
 Design Services
 Business PPTs
 Business Plan
 Management
 Strategy
 Introduction PPT
 Roadmap
 Self Introduction
 Timelines
 Process
 Marketing
 Agenda
 Technology
 Medical
 Startup Business Plan
 Cyber Security
 Dashboards
 SWOT
SWOT Proposals
 Education
 Pitch Deck
 Digital Marketing
 KPIs
KPIs Project Management
 Product Management
 Artificial Intelligence
 Target Market
 Communication
 Supply Chain
 Google Slides
 Research Services
 One Pagers
 All Categories
Statistical data analysis PowerPoint Presentation Templates and Google Slides
DISPLAYING: 60 of 80 Item(s)
Page


Statistical Tools For Data Analysis And Interpretation Ppt PowerPoint Presentation Portfolio Visuals
Presenting this set of slides with name Statistical Tools For Data Analysis And Interpretation Ppt PowerPoint Presentation Portfolio Visuals. This is a six process. The stages in this process are marketing, management, measuring results. This is a completely editable PowerPoint presentation and is available for immediate download. Download now and impress your audience.


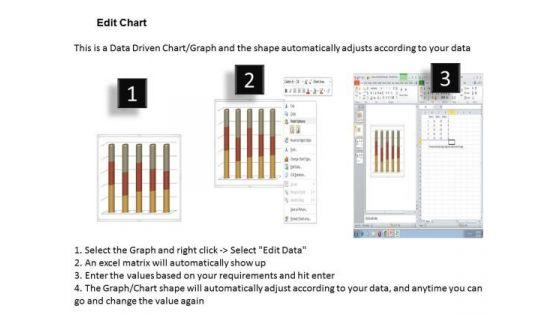
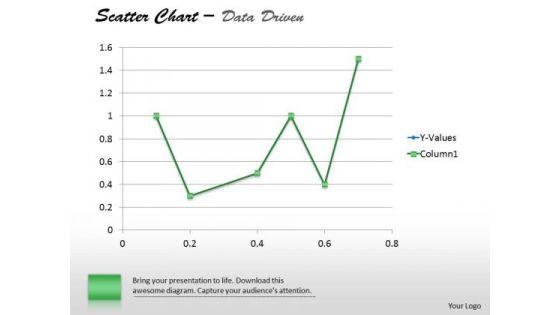
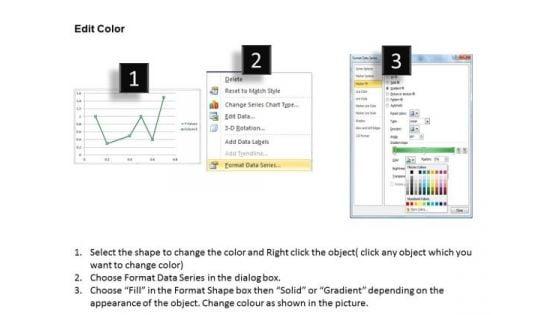
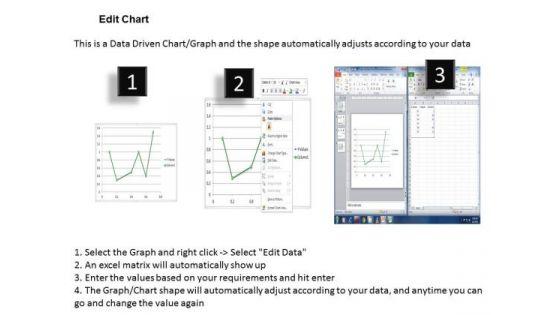
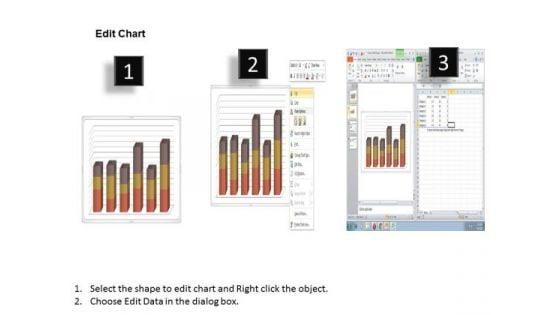
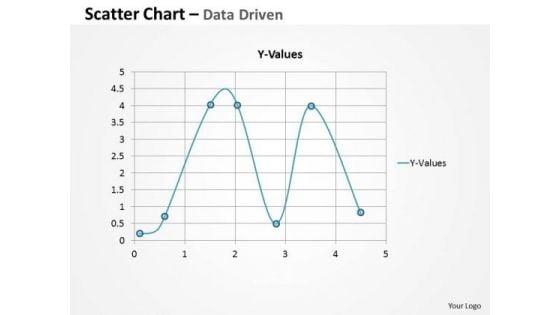
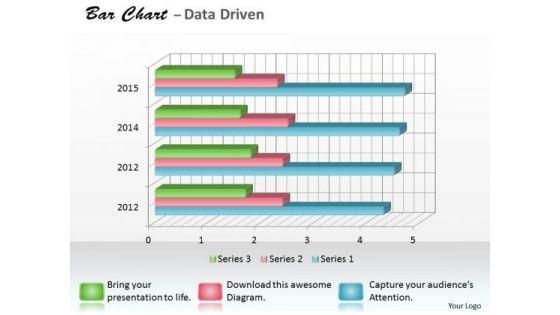
Financial Data Analysis Driven Demonstrate Statistics With Scatter Chart PowerPoint Slides Templates
Establish The Dominance Of Your Ideas. Our financial data analysis driven demonstrate statistics with scatter chart powerpoint slides Templates Will Put Them On Top.


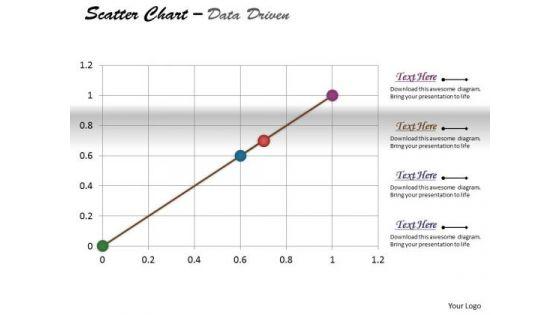


We present our Statistical Data Analysis In Marketing PowerPoint Templates PPT Backgrounds For Slides 0313.Download our Marketing PowerPoint Templates because Our PowerPoint Templates and Slides will let you Clearly mark the path for others to follow. Download our Success PowerPoint Templates because You have gained great respect for your brilliant ideas. Use our PowerPoint Templates and Slides to strengthen and enhance your reputation. Use our Finance PowerPoint Templates because Our PowerPoint Templates and Slides has conjured up a web of all you need with the help of our great team. Use them to string together your glistening ideas. Download our Business PowerPoint Templates because Our PowerPoint Templates and Slides help you pinpoint your timelines. Highlight the reasons for your deadlines with their use. Use our Shapes PowerPoint Templates because Our PowerPoint Templates and Slides ensures Effective communication. They help you put across your views with precision and clarity.Use these PowerPoint slides for presentations relating to The diagramme which shows the statistical data, marketing, success, business, shapes, finance. The prominent colors used in the PowerPoint template are Green, Red, Yellow. Your thoughts will come on fast and furious. Boost your speed of thought with our Statistical Data Analysis In Marketing PowerPoint Templates Ppt Backgrounds For Slides 0313.

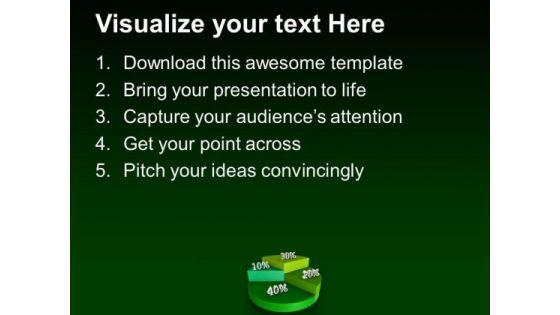
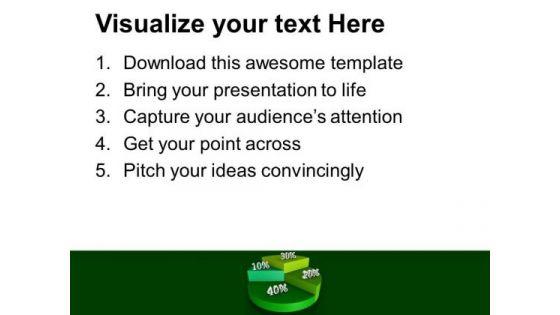
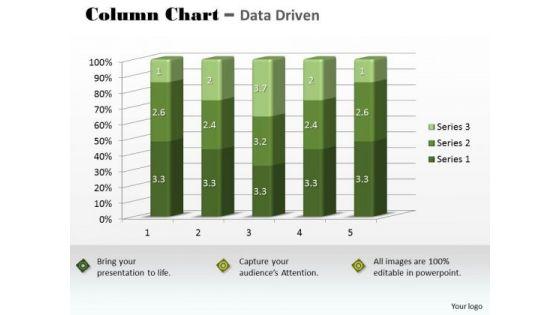
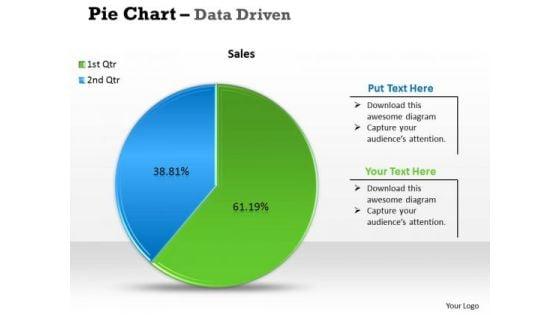
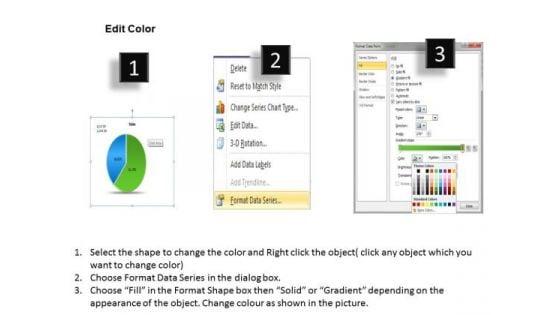
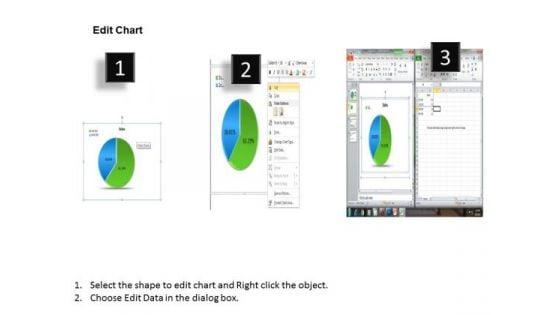
We present our Statistical Data Analysis Marketing PowerPoint Templates PPT Backgrounds For Slides 0313.Download and present our Pie charts PowerPoint Templates because It will Raise the bar of your Thoughts. They are programmed to take you to the next level. Download our Signs PowerPoint Templates because You canTake a leap off the starting blocks with our PowerPoint Templates and Slides. They will put you ahead of the competition in quick time. Use our Shapes PowerPoint Templates because Our PowerPoint Templates and Slides are effectively colour coded to prioritise your plans They automatically highlight the sequence of events you desire. Download and present our Business PowerPoint Templates because You can Be the star of the show with our PowerPoint Templates and Slides. Rock the stage with your ideas. Download our Marketing PowerPoint Templates because You canTake a leap off the starting blocks with our PowerPoint Templates and Slides. They will put you ahead of the competition in quick time.Use these PowerPoint slides for presentations relating to Pie chart, Signs, Shapes, pie charts, business, marketing. The prominent colors used in the PowerPoint template are Green, Green lime , White. Excite the senses with our Statistical Data Analysis Marketing PowerPoint Templates Ppt Backgrounds For Slides 0313. Tickle the minds with your views.
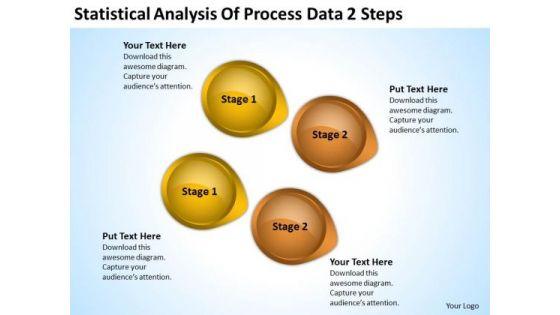
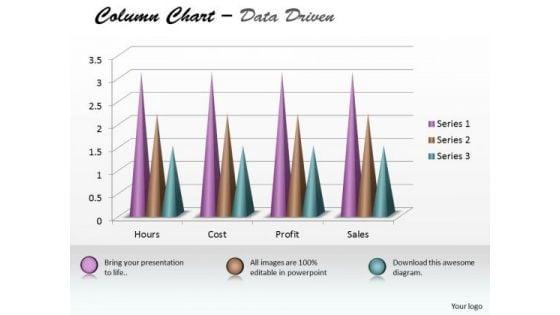
We present our power point arrows statistical analysis of process data 2 steps PowerPoint templates.Download and present our Business PowerPoint Templates because It is Aesthetically crafted by artistic young minds. Our PowerPoint Templates and Slides are designed to display your dexterity. Present our Arrows PowerPoint Templates because You can Rise to the occasion with our PowerPoint Templates and Slides. You will bring your audience on their feet in no time. Download and present our Circle Charts PowerPoint Templates because Our PowerPoint Templates and Slides help you pinpoint your timelines. Highlight the reasons for your deadlines with their use. Present our Shapes PowerPoint Templates because You aspire to touch the sky with glory. Let our PowerPoint Templates and Slides provide the fuel for your ascent. Present our Symbol PowerPoint Templates because You have gained great respect for your brilliant ideas. Use our PowerPoint Templates and Slides to strengthen and enhance your reputation.Use these PowerPoint slides for presentations relating to abstract, arrow, art, background, banner, blue, bright, business, circle, color, colorful, concept, conceptual, connection, creative, cycle, design, different, element, empty, flower, form, frame, graphic, green, group, idea, illustration, match, message, order, part, petal, piece, place, red, ring, shape, solution, special, speech, strategy, symbol, template, text, usable, vector, web, website. The prominent colors used in the PowerPoint template are Yellow, Brown, Black. People tell us our power point arrows statistical analysis of process data 2 steps PowerPoint templates will impress their bosses and teams. People tell us our circle PowerPoint templates and PPT Slides are designed by professionals Presenters tell us our power point arrows statistical analysis of process data 2 steps PowerPoint templates are second to none. We assure you our banner PowerPoint templates and PPT Slides will make the presenter successul in his career/life. Presenters tell us our power point arrows statistical analysis of process data 2 steps PowerPoint templates will help you be quick off the draw. Just enter your specific text and see your points hit home. Professionals tell us our background PowerPoint templates and PPT Slides will make the presenter look like a pro even if they are not computer savvy. File it down with our Power Point Arrows Statistical Analysis Of Process Data 2 Steps PowerPoint Templates. Get your thoughts into the shape you desire.
We present our arrow in powerpoint statistical analysis of process data 2 steps ppt Slide.Download our Business PowerPoint Templates because Our PowerPoint Templates and Slides will weave a web of your great ideas. They are gauranteed to attract even the most critical of your colleagues. Use our Circle Charts PowerPoint Templates because Our PowerPoint Templates and Slides will let your words and thoughts hit bullseye everytime. Download our Arrows PowerPoint Templates because Our PowerPoint Templates and Slides will let you Hit the right notes. Watch your audience start singing to your tune. Download and present our Shapes PowerPoint Templates because You have the co-ordinates for your destination of success. Let our PowerPoint Templates and Slides map out your journey. Download and present our Signs PowerPoint Templates because It will let you Set new benchmarks with our PowerPoint Templates and Slides. They will keep your prospects well above par.Use these PowerPoint slides for presentations relating to 3d, abstract, analysis, arrow, background, business, button, chart, circle, circular, color, concept, conservation, cycle, development, diagram, direction, eco, ecology, energy, environment, flow, flowchart, globe, graphic, growing, growth, icon, internet, isolated, object, power, process, protection, recyclable, recycle, recycling, render, resource, saving, sign, solution, sphere, statistic, sustainable, symbol, technology, white. The prominent colors used in the PowerPoint template are Brown, Gray, Black. You can be sure our arrow in powerpoint statistical analysis of process data 2 steps ppt Slide are designed by professionals People tell us our button PowerPoint templates and PPT Slides will make the presenter look like a pro even if they are not computer savvy. You can be sure our arrow in powerpoint statistical analysis of process data 2 steps ppt Slide are designed by professionals Use our arrow PowerPoint templates and PPT Slides have awesome images to get your point across. Presenters tell us our arrow in powerpoint statistical analysis of process data 2 steps ppt Slide will make the presenter successul in his career/life. We assure you our arrow PowerPoint templates and PPT Slides are visually appealing. Get noticed immediately with our Arrow In PowerPoint Statistical Analysis Of Process Data 2 Steps Ppt Slide. Dont waste time struggling with PowerPoint. Let us do it for you.


We present our statistical analysis of parallel data 7 stages ppt help with business plan PowerPoint Slides.Download and present our Communication PowerPoint Templates because You have gained great respect for your brilliant ideas. Use our PowerPoint Templates and Slides to strengthen and enhance your reputation. Present our Business PowerPoint Templates because you have developed a vision of where you want to be a few years from now. Use our Arrows PowerPoint Templates because this business powerpoint template helps expound on the logic of your detailed thought process to take your company forward. Download our Success PowerPoint Templates because iT outlines the entire thought process for the benefit of others. Tell it to the world with your characteristic aplomb. Use our Symbol PowerPoint Templates because this template helps you to bring your audiences to the table.Use these PowerPoint slides for presentations relating to 3d, Achievement, Action, Aim, Arrows, Black, Business, Color, Communication, Competition, Concept, Connection, Creative, Design, Different, Direction, Element, First, Forward, Graph, Graphic, Group, Growth, Higher, Icon, Illustration, Image, Isolated, Leader, Leadership, Line, Menu, Motion, Orange, Progress, Series, Seven, Sign, Slew, Solution, Success, Swerve, Symbol, Team, Teamwork, Turn, Up. The prominent colors used in the PowerPoint template are Purple, Gray, Black. Customers tell us our statistical analysis of parallel data 7 stages ppt help with business plan PowerPoint Slides will generate and maintain the level of interest you desire. They will create the impression you want to imprint on your audience. Use our Arrows PowerPoint templates and PPT Slides are Magnificent. PowerPoint presentation experts tell us our statistical analysis of parallel data 7 stages ppt help with business plan PowerPoint Slides will help them to explain complicated concepts. People tell us our Action PowerPoint templates and PPT Slides will make the presenter successul in his career/life. We assure you our statistical analysis of parallel data 7 stages ppt help with business plan PowerPoint Slides are Precious. People tell us our Aim PowerPoint templates and PPT Slides are Pleasant. Many a popular belief turn out fallacious. Establish the factual position with our Statistical Analysis Of Parallel Data 7 Stages Ppt Help With Business Plan PowerPoint Slides.


We present our statistical analysis of parallel data 7 stages fashion business plan PowerPoint Slides.Download our Communication PowerPoint Templates because there is a key aspect to be emphasised. Present our Business PowerPoint Templates because watch the excitement levels rise as they realise their worth. Download our Arrows PowerPoint Templates because our PowerPoint templates designed for your ideas to sell. Download our Success PowerPoint Templates because your quest has taken you well onto the path of success. Download our Symbol PowerPoint Templates because they will Amplify your basic corporate concept and forefront the benefits of overlapping processes to arrive at common goals.Use these PowerPoint slides for presentations relating to 3d, Achievement, Action, Aim, Arrows, Black, Business, Color, Communication, Competition, Concept, Connection, Creative, Design, Different, Direction, Element, First, Forward, Graph, Graphic, Group, Growth, Higher, Icon, Illustration, Image, Isolated, Leader, Leadership, Line, Menu, Motion, Orange, Progress, Series, Seven, Sign, Slew, Solution, Success, Swerve, Symbol, Team, Teamwork, Turn, Up. The prominent colors used in the PowerPoint template are Blue, Gray, Black. Customers tell us our statistical analysis of parallel data 7 stages fashion business plan PowerPoint Slides are Awesome. Use our Business PowerPoint templates and PPT Slides will get their audience's attention. PowerPoint presentation experts tell us our statistical analysis of parallel data 7 stages fashion business plan PowerPoint Slides are Awesome. People tell us our Aim PowerPoint templates and PPT Slides are Sparkling. We assure you our statistical analysis of parallel data 7 stages fashion business plan PowerPoint Slides are Royal. People tell us our Black PowerPoint templates and PPT Slides are Detailed. Make your mark with our Statistical Analysis Of Parallel Data 7 Stages Fashion Business Plan PowerPoint Slides. You will be at the top of your game.


We present our statistical analysis of parallel data 7 stages business planning guide PowerPoint Slides.Download our Communication PowerPoint Templates because the mind is always whirring with new ideas. Use our Business PowerPoint Templates because watch the excitement levels rise as they realise their worth. Download our Arrows PowerPoint Templates because you know Coincidentally it will always point to the top. Use our Success PowerPoint Templates because they represent the proress in our lives. Use our Symbol PowerPoint Templates because with the help of our Slides you can Illustrate how each element flows seamlessly onto the next stage.Use these PowerPoint slides for presentations relating to 3d, Achievement, Action, Aim, Arrows, Black, Business, Color, Communication, Competition, Concept, Connection, Creative, Design, Different, Direction, Element, First, Forward, Graph, Graphic, Group, Growth, Higher, Icon, Illustration, Image, Isolated, Leader, Leadership, Line, Menu, Motion, Orange, Progress, Series, Seven, Sign, Slew, Solution, Success, Swerve, Symbol, Team, Teamwork, Turn, Up. The prominent colors used in the PowerPoint template are Pink, Gray, Black. Customers tell us our statistical analysis of parallel data 7 stages business planning guide PowerPoint Slides are Graceful. Use our Black PowerPoint templates and PPT Slides are Attractive. PowerPoint presentation experts tell us our statistical analysis of parallel data 7 stages business planning guide PowerPoint Slides are Nice. People tell us our Business PowerPoint templates and PPT Slides are Glamorous. We assure you our statistical analysis of parallel data 7 stages business planning guide PowerPoint Slides are Flirty. People tell us our Color PowerPoint templates and PPT Slides are Great. Scale mountains with our Statistical Analysis Of Parallel Data 7 Stages Business Planning Guide PowerPoint Slides. You will come out on top.
This slide shows the statistics related to social media services provided by the marketing agencies to their clients. It includes various services such as content creation, social media monitoring, strategy building, campaign analysis etc. Pitch your topic with ease and precision using this Statistical Data On Social Platforms Data Analysis Services Offered By Marketing Agencies Icons PDF. This layout presents information on Statistical Data, Social Platforms Data, Analysis Services, Marketing Agencies. It is also available for immediate download and adjustment. So, changes can be made in the color, design, graphics or any other component to create a unique layout.


This slide represents the statistical data showing information related to different social media advertising strategies used by marketers for retargeting customers. It includes various advertising strategies such as facebook or Instagram, google, email, twitter and linked In advertising etc. Showcasing this set of slides titled Statistical Data For Social Platforms Data Analysis Retargeting Strategies Inspiration PDF. The topics addressed in these templates are Social Platforms Data, Statistical Data, Analysis Retargeting Strategies. All the content presented in this PPT design is completely editable. Download it and make adjustments in color, background, font etc. as per your unique business setting.


This slide represents the statistical data related to the trends in the social media marketing. It shows data related to most popular global social networks, most active social media users and exposure through social media marketing. Pitch your topic with ease and precision using this Social Platforms Data Analysis Marketing Global Trends Statistical Data Rules PDF. This layout presents information on Social Platforms Data Analysis, Marketing Global, Trends Statistical Data. It is also available for immediate download and adjustment. So, changes can be made in the color, design, graphics or any other component to create a unique layout.


This slide covers the statistical representation of warehouse cost and time distribution issues in an organization. It includes time spent on activities such as search, travel, order set up, pick and put, etc. it also includes operating cost distribution such as order picking, storage, shipping, receiving, etc. Showcasing this set of slides titled Social Platforms Data Analysis Content And Engagement Statistical Data Microsoft PDF. The topics addressed in these templates are Social Platforms Data, Analysis Content, Engagement Statistical Data. All the content presented in this PPT design is completely editable. Download it and make adjustments in color, background, font etc. as per your unique business setting.
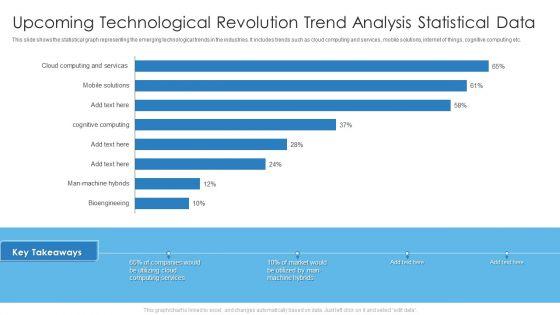

This slide shows the statistical graph representing the emerging technological trends in the industries. It includes trends such as cloud computing and services, mobile solutions, internet of things, cognitive computing etc. Deliver an awe inspiring pitch with this creative Upcoming Technological Revolution Trend Analysis Statistical Data Professional PDF bundle. Topics like Upcoming Technological Revolution, Trend Analysis Statistical Data can be discussed with this completely editable template. It is available for immediate download depending on the needs and requirements of the user.
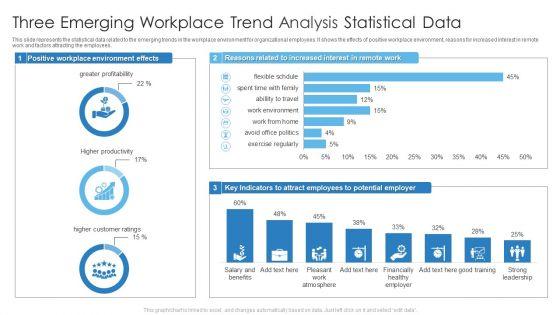
This slide represents the statistical data related to the emerging trends in the workplace environment for organizational employees. It shows the effects of positive workplace environment, reasons for increased interest in remote work and factors attracting the employees. Deliver an awe inspiring pitch with this creative Three Emerging Workplace Trend Analysis Statistical Data Guidelines PDF bundle. Topics like Three Emerging Workplace, Trend Analysis Statistical Data can be discussed with this completely editable template. It is available for immediate download depending on the needs and requirements of the user.


Presenting statistical data analysis chart of collected data formats pdf to dispense important information. This template comprises four stages. It also presents valuable insights into the topics including statistical data analysis chart of collected data. This is a completely customizable PowerPoint theme that can be put to use immediately. So, download it and address the topic impactfully.
Persuade your audience using this data driven organizational culture icon depicting statistical analysis sample pdf. This PPT design covers three stages, thus making it a great tool to use. It also caters to a variety of topics including data driven organizational culture icon depicting statistical analysis. Download this PPT design now to present a convincing pitch that not only emphasizes the topic but also showcases your presentation skills.
Presenting statistical analysis of meta data dashboard vector icon ppt powerpoint presentation shapes pdf to dispense important information. This template comprises three stages. It also presents valuable insights into the topics including statistical analysis of meta data dashboard vector icon. This is a completely customizable PowerPoint theme that can be put to use immediately. So, download it and address the topic impactfully.
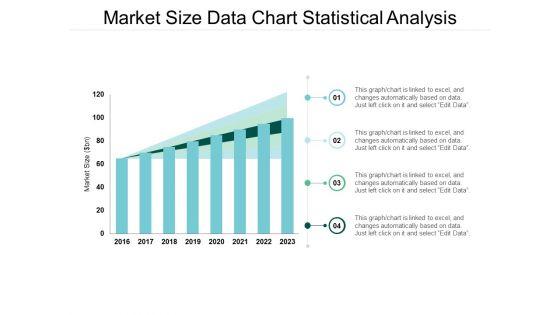
Showcasing this set of slides titled statistical data analysis chart vector icon ppt powerpoint presentation styles guide pdf. The topics addressed in these templates are statistical data analysis chart vector icon. All the content presented in this PPT design is completely editable. Download it and make adjustments in color, background, font etc. as per your unique business setting.
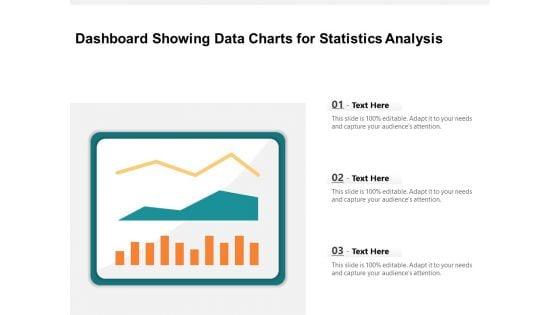

Pitch your topic with ease and precision using this dashboard showing data charts for statistics analysis ppt powerpoint presentation infographic template grid pdf. This layout presents information on dashboard showing data charts for statistics analysis. It is also available for immediate download and adjustment. So, changes can be made in the color, design, graphics or any other component to create a unique layout.
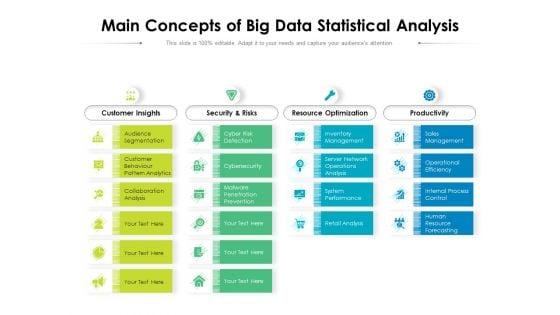
Main Concepts Of Big Data Statistical Analysis Ppt PowerPoint Presentation Pictures Introduction PDF
Presenting this set of slides with name main concepts of big data statistical analysis ppt powerpoint presentation pictures introduction pdf. This is a four stage process. The stages in this process are customer insights, security and risks, resource optimization, productivity. This is a completely editable PowerPoint presentation and is available for immediate download. Download now and impress your audience.
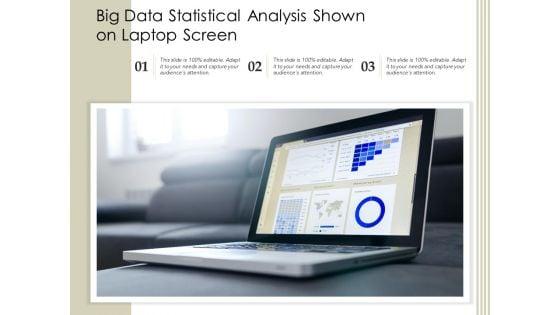
Presenting this set of slides with name big data statistical analysis shown on laptop screen ppt powerpoint presentation inspiration topics pdf. This is a three stage process. The stages in this process are big data statistical analysis shown on laptop screen. This is a completely editable PowerPoint presentation and is available for immediate download. Download now and impress your audience.
Presenting this set of slides with name manager doing customer data statistical analysis icon ppt powerpoint presentation gallery format ideas pdf. This is a three stage process. The stages in this process are manager doing customer data statistical analysis icon. This is a completely editable PowerPoint presentation and is available for immediate download. Download now and impress your audience.
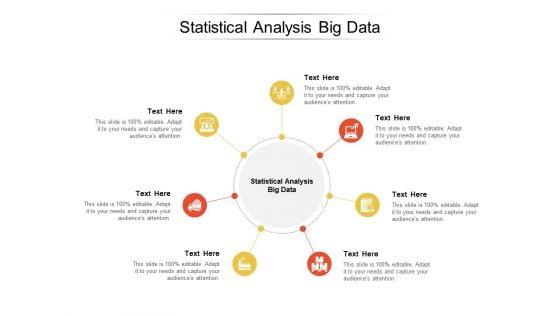
Presenting this set of slides with name statistical analysis big data ppt powerpoint presentation summary master slide cpb. This is an editable Powerpoint seven stages graphic that deals with topics like statistical analysis big data to help convey your message better graphically. This product is a premium product available for immediate download and is 100 percent editable in Powerpoint. Download this now and use it in your presentations to impress your audience.
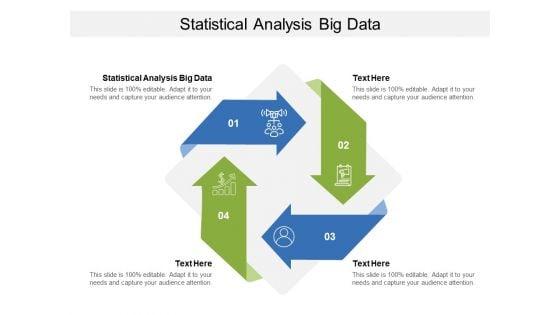
Presenting this set of slides with name statistical analysis big data ppt powerpoint presentation ideas diagrams cpb. This is an editable Powerpoint four stages graphic that deals with topics like statistical analysis big data to help convey your message better graphically. This product is a premium product available for immediate download and is 100 percent editable in Powerpoint. Download this now and use it in your presentations to impress your audience.


Presenting this set of slides with name statistical analysis data mining skills ppt powerpoint presentation slides grid cpb. This is an editable Powerpoint four stages graphic that deals with topics like statistical analysis data mining skills to help convey your message better graphically. This product is a premium product available for immediate download and is 100 percent editable in Powerpoint. Download this now and use it in your presentations to impress your audience.


Persuade your audience using this Demographic Statistics Icon Depicting Data Analysis And User Profile Brochure PDF. This PPT design covers three stages, thus making it a great tool to use. It also caters to a variety of topics including Demographic Statistics, Icon Depicting, Data Analysis. Download this PPT design now to present a convincing pitch that not only emphasizes the topic but also showcases your presentation skills.
Presenting Social Platforms Data Analysis Marketing Statistical Data Icon Ideas PDF to dispense important information. This template comprises three stages. It also presents valuable insights into the topics including Social Platforms Data Analysis, Marketing Statistical Data Icon. This is a completely customizable PowerPoint theme that can be put to use immediately. So, download it and address the topic impactfully.


This slide covers the key insights related to statistical analysis of business intelligence market. It includes details related to best BI vendors in the worlds, top IAAS platforms preferred by BI vendors etc. There are so many reasons you need a Overview Of BI For Enhanced Decision Making Business Intelligence Statistical Data Analysis Guidelines PDF. The first reason is you cannot spend time making everything from scratch, Thus, Slidegeeks has made presentation templates for you too. You can easily download these templates from our website easily.

This slide discusses the study designing phase of statistical data analysis. The purpose of this slide is to outline the statistical tests used in different research designs, such as descriptive design, correlational design, and experimental design. Do you have to make sure that everyone on your team knows about any specific topic I yes, then you should give Statistical Data Analysis Process Study Designing Ppt Presentation a try. Our experts have put a lot of knowledge and effort into creating this impeccable Statistical Data Analysis Process Study Designing Ppt Presentation. You can use this template for your upcoming presentations, as the slides are perfect to represent even the tiniest detail. You can download these templates from the Slidegeeks website and these are easy to edit. So grab these today This slide discusses the study designing phase of statistical data analysis. The purpose of this slide is to outline the statistical tests used in different research designs, such as descriptive design, correlational design, and experimental design.

The purpose of this slide is to demonstrate the hypothesis testing phase of statistical data analysis. The different steps involved in this phase are hypothesis formulation, analysis plan, collect and analyse sample data and result evaluation. There are so many reasons you need a Statistical Data Analysis Process Hypotheses Testing Ppt Slide. The first reason is you can not spend time making everything from scratch, Thus, Slidegeeks has made presentation templates for you too. You can easily download these templates from our website easily. The purpose of this slide is to demonstrate the hypothesis testing phase of statistical data analysis. The different steps involved in this phase are hypothesis formulation, analysis plan, collect and analyse sample data and result evaluation.

This slide represents the data interpretation phase of statistical analysis. The steps involved are compare P-value to significance level, assess probability, answer original questions, defend against objections, acknowledge limitations, iterate, etc. Want to ace your presentation in front of a live audience Our Statistical Data Analysis Process Data Interpretation Ppt Slide can help you do that by engaging all the users towards you. Slidegeeks experts have put their efforts and expertise into creating these impeccable powerpoint presentations so that you can communicate your ideas clearly. Moreover, all the templates are customizable, and easy-to-edit and downloadable. Use these for both personal and commercial use. This slide represents the data interpretation phase of statistical analysis. The steps involved are compare P-value to significance level, assess probability, answer original questions, defend against objections, acknowledge limitations, iterate, etc.
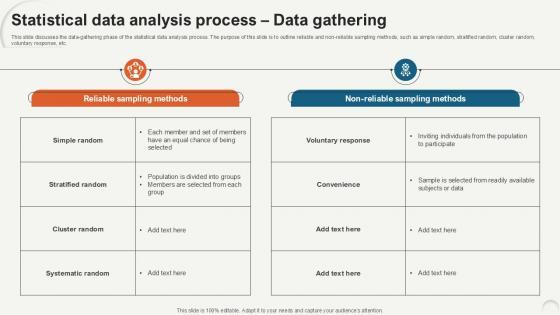
This slide discusses the data-gathering phase of the statistical data analysis process. The purpose of this slide is to outline reliable and non-reliable sampling methods, such as simple random, stratified random, cluster random, voluntary response, etc. Slidegeeks is one of the best resources for PowerPoint templates. You can download easily and regulate Statistical Data Analysis Process Data Gathering Ppt Example for your personal presentations from our wonderful collection. A few clicks is all it takes to discover and get the most relevant and appropriate templates. Use our Templates to add a unique zing and appeal to your presentation and meetings. All the slides are easy to edit and you can use them even for advertisement purposes. This slide discusses the data-gathering phase of the statistical data analysis process. The purpose of this slide is to outline reliable and non-reliable sampling methods, such as simple random, stratified random, cluster random, voluntary response, etc.
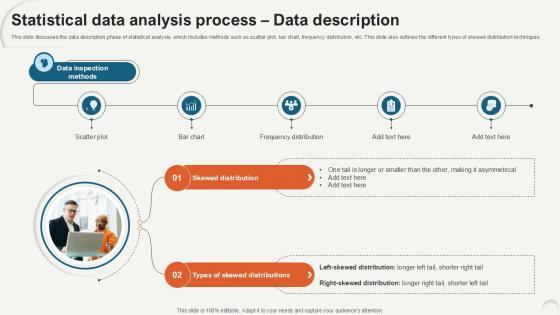
This slide discusses the data description phase of statistical analysis, which includes methods such as scatter plot, bar chart, frequency distribution, etc. This slide also outlines the different types of skewed distribution techniques. Create an editable Statistical Data Analysis Process Data Description Ppt Example that communicates your idea and engages your audience. Whether you are presenting a business or an educational presentation, pre-designed presentation templates help save time. Statistical Data Analysis Process Data Description Ppt Example is highly customizable and very easy to edit, covering many different styles from creative to business presentations. Slidegeeks has creative team members who have crafted amazing templates. So, go and get them without any delay. This slide discusses the data description phase of statistical analysis, which includes methods such as scatter plot, bar chart, frequency distribution, etc. This slide also outlines the different types of skewed distribution techniques.

This slide outlines the statistical and data analysis methods applied in different fields. These domains are spatial models, time series, survival analysis, market segmentation, recommendation systems, attribution modeling, clustering, etc. Boost your pitch with our creative Statistical And Data Analysis Techniques Data Analytics For Informed Decision Ppt Sample. Deliver an awe-inspiring pitch that will mesmerize everyone. Using these presentation templates you will surely catch everyones attention. You can browse the ppts collection on our website. We have researchers who are experts at creating the right content for the templates. So you do not have to invest time in any additional work. Just grab the template now and use them. This slide outlines the statistical and data analysis methods applied in different fields. These domains are spatial models, time series, survival analysis, market segmentation, recommendation systems, attribution modeling, clustering, etc.
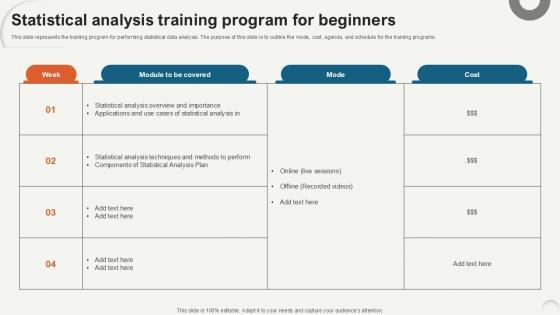
This slide represents the training program for performing statistical data analysis. The purpose of this slide is to outline the mode, cost, agenda, and schedule for the training programs. Take your projects to the next level with our ultimate collection of Statistical Analysis Training Program Data Analytics For Informed Decision Ppt Template. Slidegeeks has designed a range of layouts that are perfect for representing task or activity duration, keeping track of all your deadlines at a glance. Tailor these designs to your exact needs and give them a truly corporate look with your own brand colors they will make your projects stand out from the rest This slide represents the training program for performing statistical data analysis. The purpose of this slide is to outline the mode, cost, agenda, and schedule for the training programs.

The purpose of this slide is to outline the different software used to perform statistical analysis. This slide represents the primary features and benefits of various statistical software available in the market. This Statistical Analysis Software Features Data Analytics For Informed Decision Ppt Presentation from Slidegeeks makes it easy to present information on your topic with precision. It provides customization options, so you can make changes to the colors, design, graphics, or any other component to create a unique layout. It is also available for immediate download, so you can begin using it right away. Slidegeeks has done good research to ensure that you have everything you need to make your presentation stand out. Make a name out there for a brilliant performance. The purpose of this slide is to outline the different software used to perform statistical analysis. This slide represents the primary features and benefits of various statistical software available in the market.
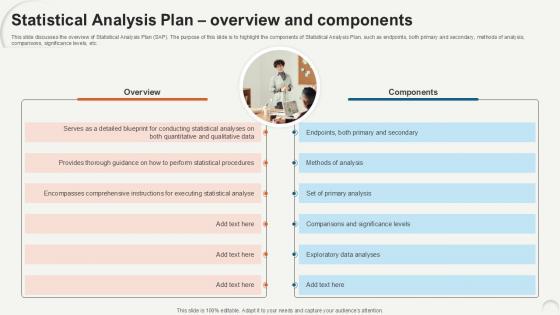
This slide discusses the overview of Statistical Analysis Plan SAP. The purpose of this slide is to highlight the components of Statistical Analysis Plan, such as endpoints, both primary and secondary, methods of analysis, comparisons, significance levels, etc. Here you can discover an assortment of the finest PowerPoint and Google Slides templates. With these templates, you can create presentations for a variety of purposes while simultaneously providing your audience with an eye-catching visual experience. Download Statistical Analysis Plan Overview Data Analytics For Informed Decision Ppt Template to deliver an impeccable presentation. These templates will make your job of preparing presentations much quicker, yet still, maintain a high level of quality. Slidegeeks has experienced researchers who prepare these templates and write high-quality content for you. Later on, you can personalize the content by editing the Statistical Analysis Plan Overview Data Analytics For Informed Decision Ppt Template. This slide discusses the overview of Statistical Analysis Plan SAP. The purpose of this slide is to highlight the components of Statistical Analysis Plan, such as endpoints, both primary and secondary, methods of analysis, comparisons, significance levels, etc.
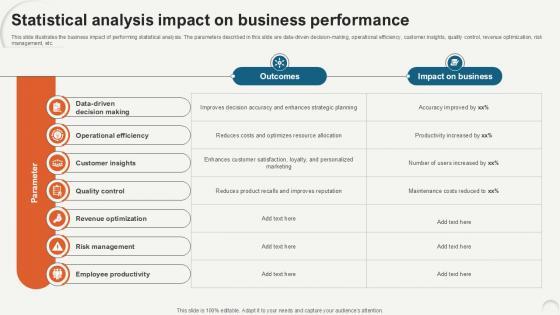
This slide illustrates the business impact of performing statistical analysis. The parameters described in this slide are data-driven decision-making, operational efficiency, customer insights, quality control, revenue optimization, risk management, etc. Presenting this PowerPoint presentation, titled Statistical Analysis Impact On Data Analytics For Informed Decision Ppt PowerPoint, with topics curated by our researchers after extensive research. This editable presentation is available for immediate download and provides attractive features when used. Download now and captivate your audience. Presenting this Statistical Analysis Impact On Data Analytics For Informed Decision Ppt PowerPoint. Our researchers have carefully researched and created these slides with all aspects taken into consideration. This is a completely customizable Statistical Analysis Impact On Data Analytics For Informed Decision Ppt PowerPoint that is available for immediate downloading. Download now and make an impact on your audience. Highlight the attractive features available with our PPTs. This slide illustrates the business impact of performing statistical analysis. The parameters described in this slide are data-driven decision-making, operational efficiency, customer insights, quality control, revenue optimization, risk management, etc.
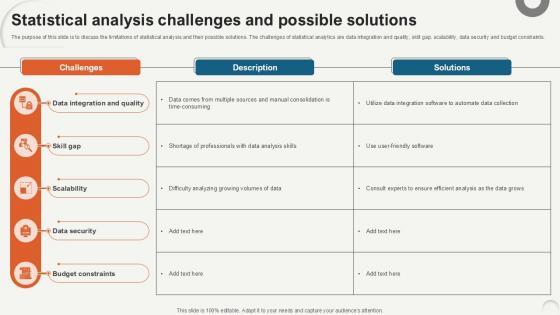
The purpose of this slide is to discuss the limitations of statistical analysis and their possible solutions. The challenges of statistical analytics are data integration and quality, skill gap, scalability, data security and budget constraints. Slidegeeks has constructed Statistical Analysis Challenges Data Analytics For Informed Decision Ppt Example after conducting extensive research and examination. These presentation templates are constantly being generated and modified based on user preferences and critiques from editors. Here, you will find the most attractive templates for a range of purposes while taking into account ratings and remarks from users regarding the content. This is an excellent jumping-off point to explore our content and will give new users an insight into our top-notch PowerPoint Templates. The purpose of this slide is to discuss the limitations of statistical analysis and their possible solutions. The challenges of statistical analytics are data integration and quality, skill gap, scalability, data security and budget constraints.
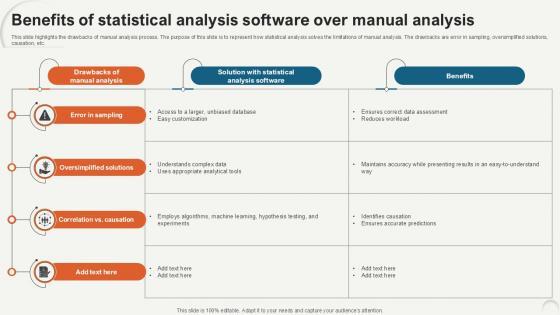
This slide highlights the drawbacks of manual analysis process. The purpose of this slide is to represent how statistical analysis solves the limitations of manual analysis. The drawbacks are error in sampling, oversimplified solutions, causation, etc. Slidegeeks is one of the best resources for PowerPoint templates. You can download easily and regulate Benefits Of Statistical Analysis Data Analytics For Informed Decision Ppt Slide for your personal presentations from our wonderful collection. A few clicks is all it takes to discover and get the most relevant and appropriate templates. Use our Templates to add a unique zing and appeal to your presentation and meetings. All the slides are easy to edit and you can use them even for advertisement purposes. This slide highlights the drawbacks of manual analysis process. The purpose of this slide is to represent how statistical analysis solves the limitations of manual analysis. The drawbacks are error in sampling, oversimplified solutions, causation, etc.
DISPLAYING: 60 of 80 Item(s)
Page