- Sign up
- Sign In
 AI PPT Maker
 Templates
 PPT Bundles
 Design Services
 Business PPTs
 Business Plan
 Management
 Strategy
 Introduction PPT
 Roadmap
 Self Introduction
 Timelines
 Process
 Marketing
 Agenda
 Technology
 Medical
 Startup Business Plan
 Cyber Security
 Dashboards
 SWOT
SWOT Proposals
 Education
 Pitch Deck
 Digital Marketing
 KPIs
KPIs Project Management
 Product Management
 Artificial Intelligence
 Target Market
 Communication
 Supply Chain
 Google Slides
 Research Services
 One Pagers
 All Categories
Sales data PowerPoint Presentation Templates and Google Slides
DISPLAYING: 60 of 176 Item(s)
Page


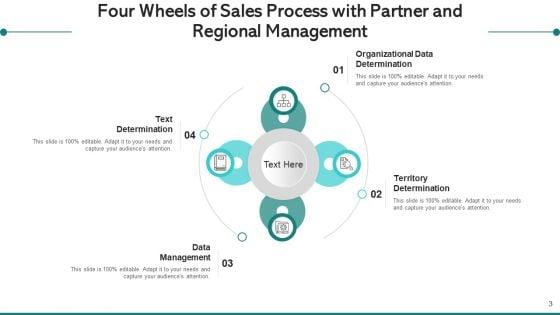

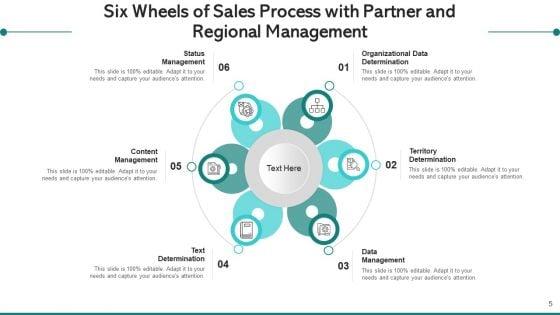


Share a great deal of information on the topic by deploying this wheels of sales process with partner and regional management data ppt powerpoint presentation complete deck with slides. Support your ideas and thought process with this prefabricated set. It includes a set of nine slides, all fully modifiable and editable. Each slide can be restructured and induced with the information and content of your choice. You can add or remove large content boxes as well, to make this PPT slideshow more personalized. Its high-quality graphics and visuals help in presenting a well-coordinated pitch. This PPT template is also a resourceful tool to take visual cues from and implement the best ideas to help your business grow and expand. The main attraction of this well-formulated deck is that everything is editable, giving you the freedom to adjust it to your liking and choice. Changes can be made in the background and theme as well to deliver an outstanding pitch. Therefore, click on the download button now to gain full access to this multifunctional set.


Presenting this set of slides with name sales database management ppt powerpoint presentation outline templates cpb. This is an editable Powerpoint three stages graphic that deals with topics like sales database management to help convey your message better graphically. This product is a premium product available for immediate download and is 100 percent editable in Powerpoint. Download this now and use it in your presentations to impress your audience.


Presenting this set of slides with name data management sales strategy ppt powerpoint presentation summary show cpb. This is a four stage process. The stages in this process are data management sales strategy. This is a completely editable PowerPoint presentation and is available for immediate download. Download now and impress your audience.


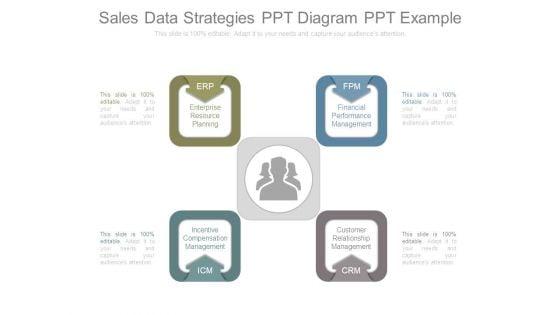
We present our 9 correlated blocks of structured data ppt sales business plan outline PowerPoint templates.Download our Marketing PowerPoint Templates because Our PowerPoint Templates and Slides will let you meet your Deadlines. Download and present our Business PowerPoint Templates because You can Hit the nail on the head with our PowerPoint Templates and Slides. Embed your ideas in the minds of your audience. Download and present our Finance PowerPoint Templates because Our PowerPoint Templates and Slides are a sure bet. Gauranteed to win against all odds. Download and present our Process and Flows PowerPoint Templates because Our PowerPoint Templates and Slides will bullet point your ideas. See them fall into place one by one. Use our Arrows PowerPoint Templates because Our PowerPoint Templates and Slides will let your ideas bloom. Create a bed of roses for your audience.Use these PowerPoint slides for presentations relating to Diagram, Chart, Business, Background, Vector, Pie, Brown, Abstract, Wheel, Options, Board, Website, Cross, Statistics, Model, Item, Document, Media, Beehives, Red, Hive, Concept, Presentation, Template, Matt, Brochure, Orange, Guide, Description, Multicolor, Marketing, Gray, Development, Title, Management, Honeycomb, Illustration, Six, Catalog, Direction, Plans, Blue, Text, Reports, Financial, Workplace, Navigation, Parts. The prominent colors used in the PowerPoint template are Yellow, Gray, Black. Color your presentation with success with our 9 Correlated Blocks Of Structured Data Ppt Sales Business Plan Outline PowerPoint Templates. You will come out on top.
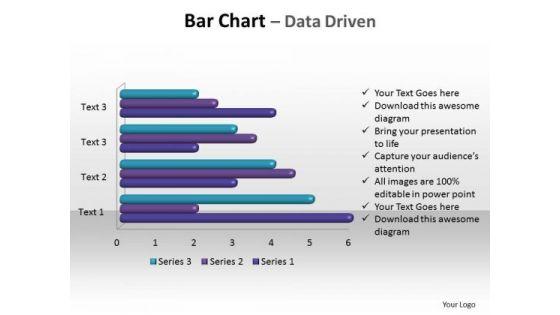


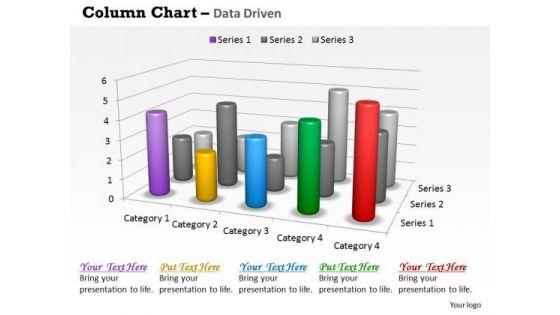
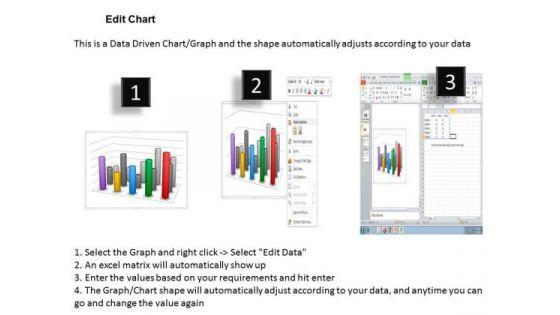
Business Sales PowerPoint Templates Business bar chart data driven PPT Slides-This PowerPoint d Editable Data-Driven Chart is for visualizing your figures and data. Business Sales PowerPoint Templates Business bar chart data driven PPT Slides-This ppt can be used for concepts relating to-Chat, Illustration, data driven, figures, charts and Graphs. Set the audience alight with our Business Sales PowerPoint Templates Business Bar Chart Data Driven Ppt Slides. You will come up with a cracker of an idea.


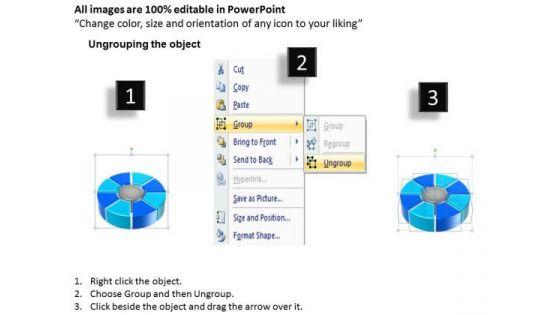
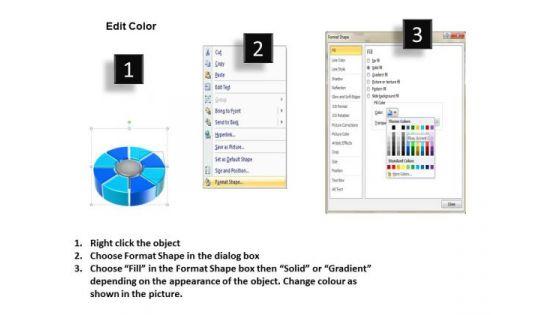
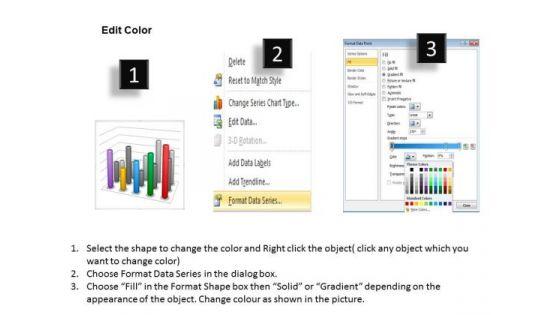
PowerPoint Presentation Designs Sales Data Mining Process PPT Slides backgrounds-These high quality powerpoint pre-designed slides and powerpoint templates have been carefully created by our professional team to help you impress your audience. All slides have been created and are 100% editable in powerpoint. Each and every property of any graphic - color, size, orientation, shading, outline etc. can be modified to help you build an effective powerpoint presentation. Any text can be entered at any point in the powerpoint template or slide. Simply DOWNLOAD, TYPE and PRESENT! Secure your promotion with our PowerPoint Presentation Designs Sales Data Mining Process Ppt Slides. Download without worries with our money back guaranteee.
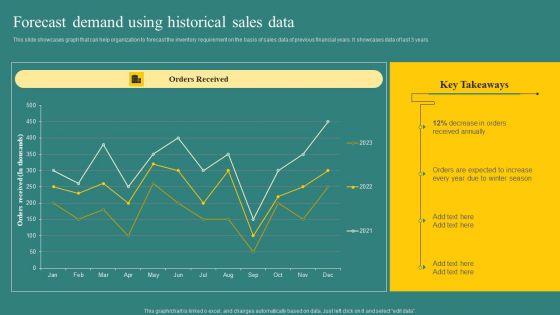

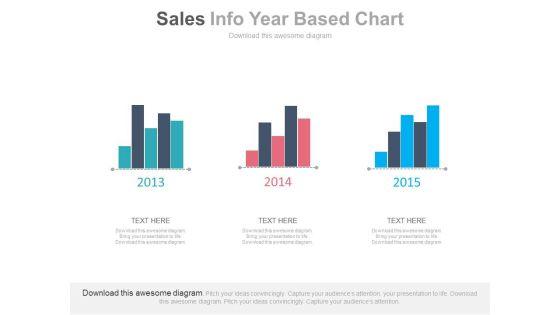
This slide showcases graph that can help organization to forecast the inventory requirement on the basis of sales data of previous financial years. It showcases data of last 3 years. Take your projects to the next level with our ultimate collection of Forecast Demand Using Historical Sales Data Background PDF. Slidegeeks has designed a range of layouts that are perfect for representing task or activity duration, keeping track of all your deadlines at a glance. Tailor these designs to your exact needs and give them a truly corporate look with your own brand colors they will make your projects stand out from the rest.
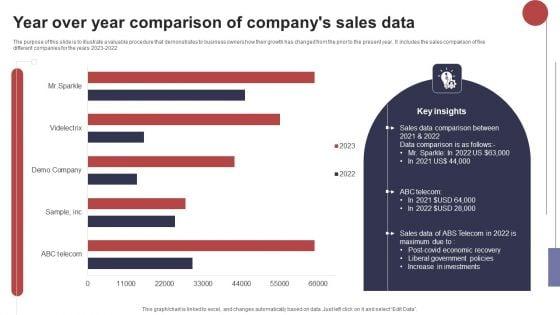
The purpose of this slide is to illustrate a valuable procedure that demonstrates to business owners how their growth has changed from the prior to the present year. It includes the sales comparison of five different companies for the years 2023 2022. Pitch your topic with ease and precision using this Year Over Year Comparison Of Companys Sales Data Microsoft PDF. This layout presents information on Sales Data Comparison, Liberal Government, Increase Investments. It is also available for immediate download and adjustment. So, changes can be made in the color, design, graphics or any other component to create a unique layout.

Presenting you a fantastic One Page Vehicle Sales Data Document PDF Document PPT Template. This one-pager document is crafted on hours of research and professional design efforts to ensure you have the best resource. It is completely editable and its design allow you to rehash its elements to suit your needs. Get this One Page Vehicle Sales Data Document PDF Document PPT Template Download now.
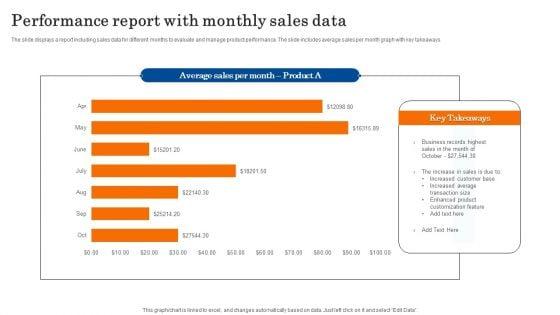

The slide displays a report including sales data for different months to evaluate and manage product performance. The slide includes average sales per month graph with key takeaways. Showcasing this set of slides titled Performance Report With Monthly Sales Data Diagrams PDF. The topics addressed in these templates are Business, Sales, Customization. All the content presented in this PPT design is completely editable. Download it and make adjustments in color, background, font etc. as per your unique business setting.
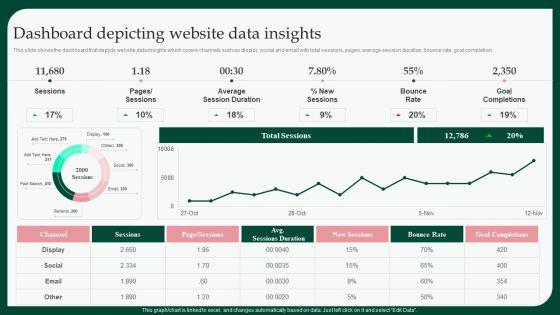

This slide shows the dashboard that depicts website data insights which covers channels such as display, social and email with total sessions, pages, average session duration, bounce rate, goal completion. Coming up with a presentation necessitates that the majority of the effort goes into the content and the message you intend to convey. The visuals of a PowerPoint presentation can only be effective if it supplements and supports the story that is being told. Keeping this in mind our experts created Boosting Product Sales Through Branding Dashboard Depicting Website Data Brochure PDF to reduce the time that goes into designing the presentation. This way, you can concentrate on the message while our designers take care of providing you with the right template for the situation.
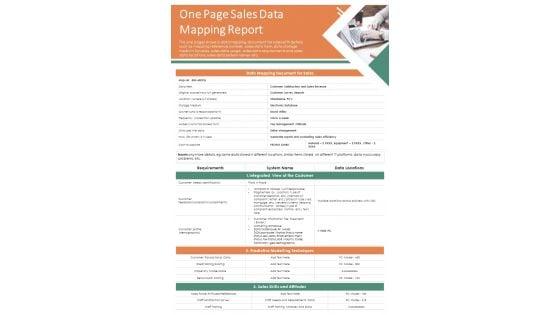

Here an illustrative One Page Sales Data Mapping Report PDF Document PPT Template. This one-pager template is designed to match your needs. It is 100 percent editable, which allows you to make changes as you seem fit to suit your purpose. Grab this One Page Sales Data Mapping Report PDF Document PPT Template Download now.


This slide showcases graph that can help organization to forecast the inventory requirement on the basis of sales data of previous financial years. It showcases data of last 3 years. This Stock Inventory Acquisition Forecast Demand Using Historical Sales Data Themes PDF from Slidegeeks makes it easy to present information on your topic with precision. It provides customization options, so you can make changes to the colors, design, graphics, or any other component to create a unique layout. It is also available for immediate download, so you can begin using it right away. Slidegeeks has done good research to ensure that you have everything you need to make your presentation stand out. Make a name out there for a brilliant performance.
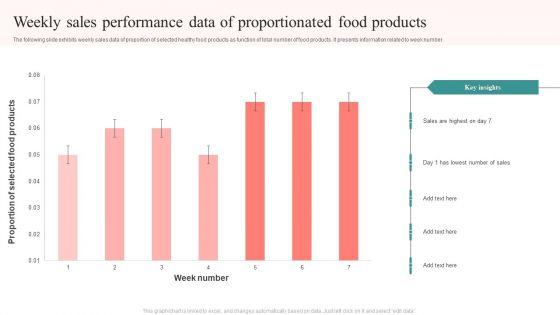
The following slide exhibits weekly sales data of proportion of selected healthy food products as function of total number of food products. It presents information related to week number. Showcasing this set of slides titled Weekly Sales Performance Data Of Proportionated Food Products Structure PDF. The topics addressed in these templates are Proportion Selected, Food Products, Week Number, Sales Highest. All the content presented in this PPT design is completely editable. Download it and make adjustments in color, background, font etc. as per your unique business setting.

This slide illustrates survey trends of new sales reps observed during the sales employee onboarding process. It includes survey trends on onsite trainings, company policies, having a mentor etc. Showcasing this set of slides titled New Sales Representatives Survey Data During Orientation Training Themes PDF. The topics addressed in these templates are New Sales Representatives Survey, Data During Orientation Training. All the content presented in this PPT design is completely editable. Download it and make adjustments in color, background, font etc. as per your unique business setting.


This slide illustrates graphical representation and tabular data of forecasted and cumulative sales to evaluate companys future targets and achievements. It includes month wise revenue generation. Pitch your topic with ease and precision using this Monthly Sales Capability Statistical Data Background PDF. This layout presents information on Monthly Sales, Capability Statistical Data. It is also available for immediate download and adjustment. So, changes can be made in the color, design, graphics or any other component to create a unique layout.
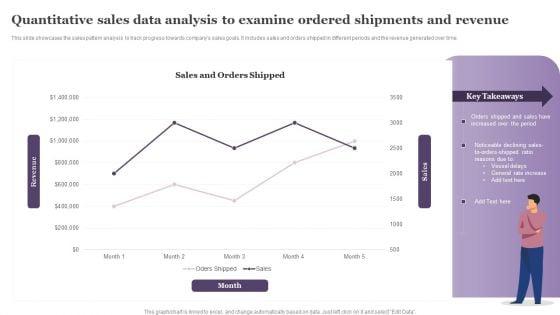
This slide showcases the sales pattern analysis to track progress towards companys sales goals. It includes sales and orders shipped in different periods and the revenue generated over time. Showcasing this set of slides titled Quantitative Sales Data Analysis To Examine Ordered Shipments And Revenue Information PDF. The topics addressed in these templates are Sales And Orders, Month, Vessel Delays. All the content presented in this PPT design is completely editable. Download it and make adjustments in color, background, font etc. as per your unique business setting.


This slide illustrates the SAP Analytics Cloud dashboard to monitor product sales performance. It provides information regarding the gross margin and net revenue earned, product performance state wise and year wise. Welcome to our selection of the Budget Plan For BI Technique For Data Informed Decisions Clipart PDF. These are designed to help you showcase your creativity and bring your sphere to life. Planning and Innovation are essential for any business that is just starting out. This collection contains the designs that you need for your everyday presentations. All of our PowerPoints are 100 percent editable, so you can customize them to suit your needs. This multi purpose template can be used in various situations. Grab these presentation templates today.
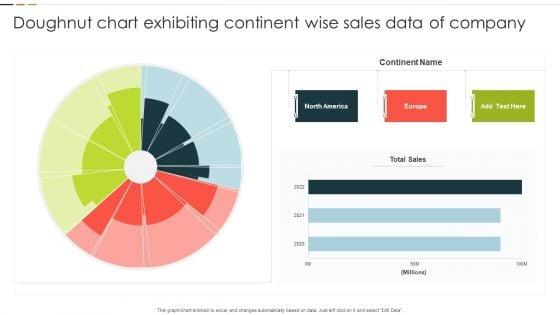
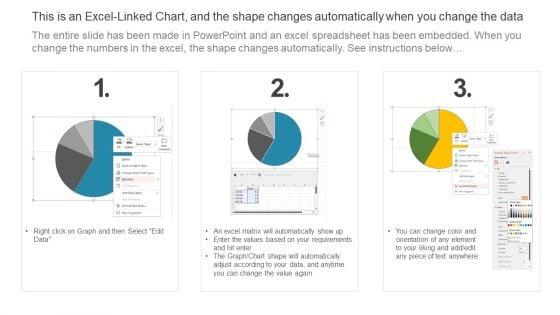
This graph or chart is linked to excel, and changes automatically based on data. Just left click on it and select Edit Data. Showcasing this set of slides titled Doughnut Chart Exhibiting Continent Wise Sales Data Of Company Background PDF. The topics addressed in these templates are Continent Name, Total Sales, 2020 To 2022. All the content presented in this PPT design is completely editable. Download it and make adjustments in color, background, font etc. as per your unique business setting.
This slide depicts top investment challenges in B2B sales and marketing data quality. It includes barriers such as cost, better ROI with others, inadequate understanding of data quality, lack of results evidenced and absence of decision makers.Pitch your topic with ease and precision using this Promotional Investments Barriers For B2B Sales And Marketing Data Quality Icons PDF. This layout presents information on Loyalty Increases, Products Instagram, Business Presence. It is also available for immediate download and adjustment. So, changes can be made in the color, design, graphics or any other component to create a unique layout.
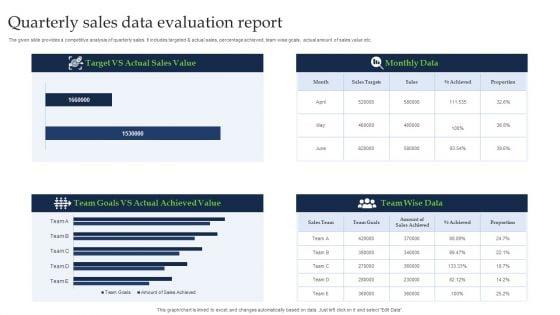

The given slide provides a competitive analysis of quarterly sales. It includes targeted and actual sales, percentage achieved, team wise goals, actual amount of sales value etc. Showcasing this set of slides titled Quarterly Sales Data Evaluation Report Ideas PDF. The topics addressed in these templates are Actual Sales Value, Target, Actual Achieved Value. All the content presented in this PPT design is completely editable. Download it and make adjustments in color, background, font etc. as per your unique business setting.
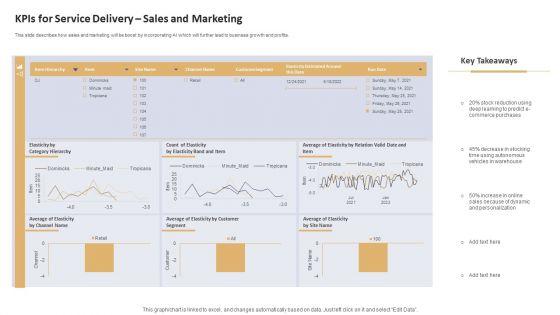

This slide describes how sales and marketing will be boost by incorporating AI which will further lead to business growth and profits. Deliver an awe inspiring pitch with this creative Data Processing Services Delivery Kpis For Service Delivery Sales And Marketing Summary PDF bundle. Topics like Count Elasticity, Elasticity, Band and Item, Average Elasticity, Customer Segment can be discussed with this completely editable template. It is available for immediate download depending on the needs and requirements of the user.
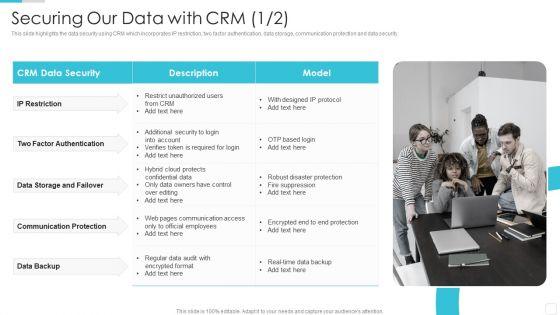

This slide highlights the data security using CRM which incorporates IP restriction, two factor authentication, data storage, communication protection and data security.This is a Sales CRM Cloud Solutions Deployment Securing Our Data With CRM Infographics PDF template with various stages. Focus and dispense information on one stage using this creative set, that comes with editable features. It contains large content boxes to add your information on topics like Factor Authentication, Storage And Failover, Communication Protection. You can also showcase facts, figures, and other relevant content using this PPT layout. Grab it now.
Persuade your audience using this Statistical Data Showing Sales Strategy Framework Icon Clipart PDF. This PPT design covers three stages, thus making it a great tool to use. It also caters to a variety of topics including Statistical Data, Showing Sales Strategy, Framework Icon. Download this PPT design now to present a convincing pitch that not only emphasizes the topic but also showcases your presentation skills.


This slide provides information about sales data requirement analysis for business growth which contains different KPIs such as total revenue, revenue by product, percentage of revenue from existing customers and new business. Pitch your topic with ease and precision using this sales data requirements for analytics for business growth information pdf. This layout presents information on customers, revenue, business. It is also available for immediate download and adjustment. So, changes can be made in the color, design, graphics or any other component to create a unique layout.
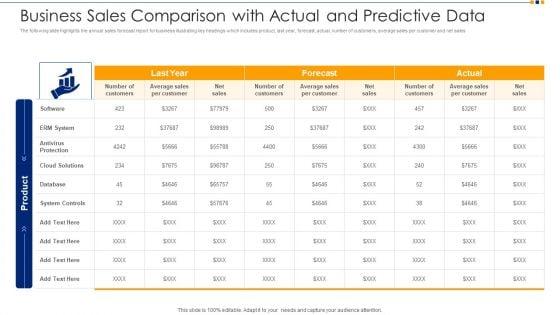

The following slide highlights the annual sales forecast report for business illustrating key headings which includes product, last year, forecast, actual, number of customers, average sales per customer and net sales. Showcasing this set of slides titled business sales comparison with actual and predictive data ppt model slide pdf. The topics addressed in these templates are antivirus protection, cloud solutions, system controls. All the content presented in this PPT design is completely editable. Download it and make adjustments in color, background, font etc. as per your unique business setting.
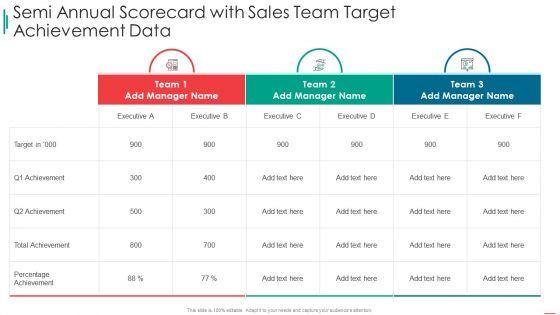

Deliver an awe inspiring pitch with this creative sales rep scorecard semi annual scorecard with sales team target achievement data topics pdf bundle. Topics like semi annual scorecard with sales team target achievement data can be discussed with this completely editable template. It is available for immediate download depending on the needs and requirements of the user.
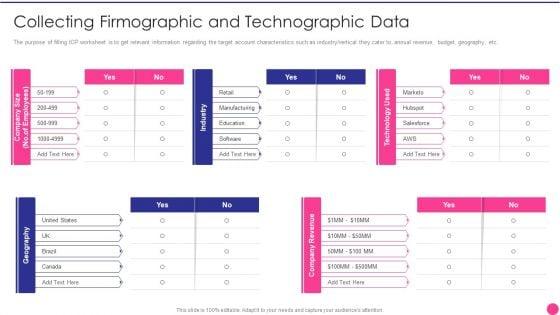

The purpose of filling ICP worksheet is to get relevant information regarding the target account characteristics such as industry or vertical they cater to, annual revenue, budget, geography, etc. Deliver an awe inspiring pitch with this creative operating b2b sales collecting firmographic and technographic data microsoft pdf bundle. Topics like retail, manufacturing, education, software can be discussed with this completely editable template. It is available for immediate download depending on the needs and requirements of the user.
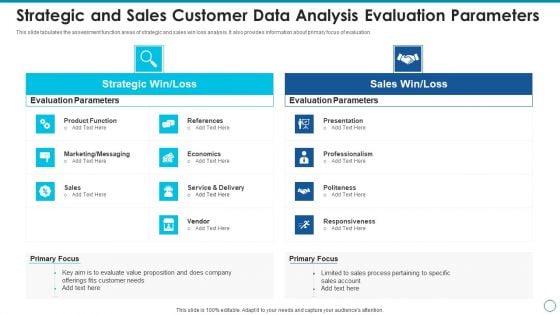

This slide tabulates the assessment function areas of strategic and sales win loss analysis. It also provides information about primary focus of evaluation. Persuade your audience using this strategic and sales customer data analysis evaluation parameters inspiration pdf. This PPT design covers two stages, thus making it a great tool to use. It also caters to a variety of topics including evaluation parameters, strategic win loss, sales win loss. Download this PPT design now to present a convincing pitch that not only emphasizes the topic but also showcases your presentation skills.
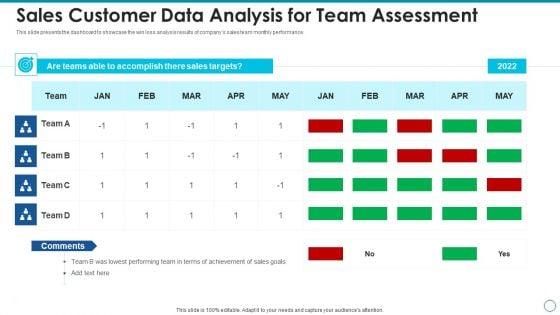
This slide presents the dashboard to showcase the win loss analysis results of companys sales team monthly performance. Showcasing this set of slides titled sales customer data analysis for team assessment information pdf. The topics addressed in these templates are sales customer data analysis for team assessment. All the content presented in this PPT design is completely editable. Download it and make adjustments in color, background, font etc. as per your unique business setting.


This slide shows the win loss analysis matrix for the assessment of best sales channel in terms of development resources and costs and revenue potential. Presenting customer data analysis matrix for assessment of sales channel template pdf to dispense important information. This template comprises four stages. It also presents valuable insights into the topics including customer data analysis matrix for assessment of sales channel. This is a completely customizable PowerPoint theme that can be put to use immediately. So, download it and address the topic impactfully.


Showcasing this set of slides titled customer data analysis chart for product sales inspiration pdf. The topics addressed in these templates are customer data analysis chart for product sales. All the content presented in this PPT design is completely editable. Download it and make adjustments in color, background, font etc. as per your unique business setting.
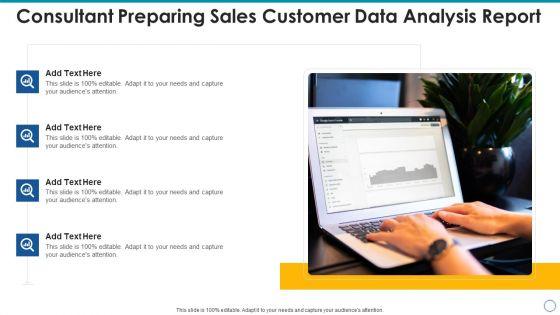

Persuade your audience using this consultant preparing sales customer data analysis report designs pdf. This PPT design covers four stages, thus making it a great tool to use. It also caters to a variety of topics including consultant preparing sales customer data analysis report. Download this PPT design now to present a convincing pitch that not only emphasizes the topic but also showcases your presentation skills.
DISPLAYING: 60 of 176 Item(s)
Page