- Sign up
- Sign In
 AI PPT Maker
 Templates
 PPT Bundles
 Design Services
 Business PPTs
 Business Plan
 Management
 Strategy
 Introduction PPT
 Roadmap
 Self Introduction
 Timelines
 Process
 Marketing
 Agenda
 Technology
 Medical
 Startup Business Plan
 Cyber Security
 Dashboards
 SWOT
SWOT Proposals
 Education
 Pitch Deck
 Digital Marketing
 KPIs
KPIs Project Management
 Product Management
 Artificial Intelligence
 Target Market
 Communication
 Supply Chain
 Google Slides
 Research Services
 One Pagers
 All Categories
Sales and performance PowerPoint Presentation Templates and Google Slides
DISPLAYING: 60 of 182 Item(s)
Page

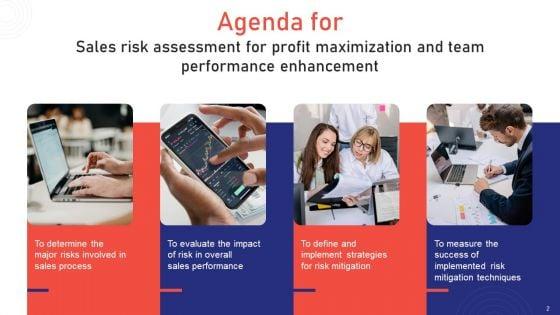

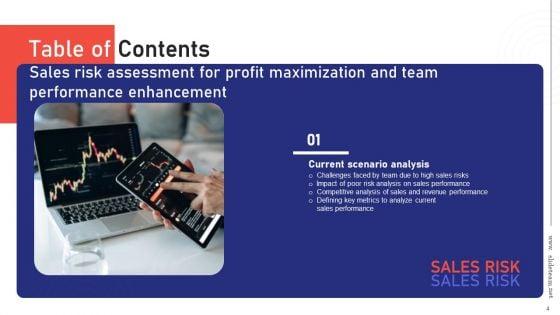

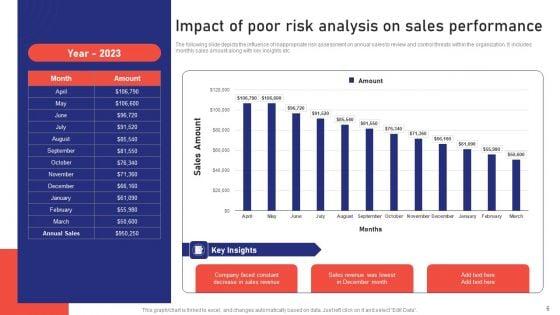
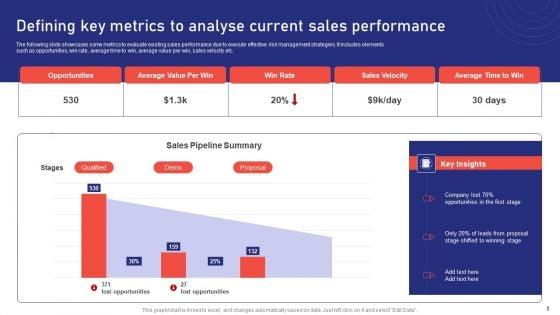


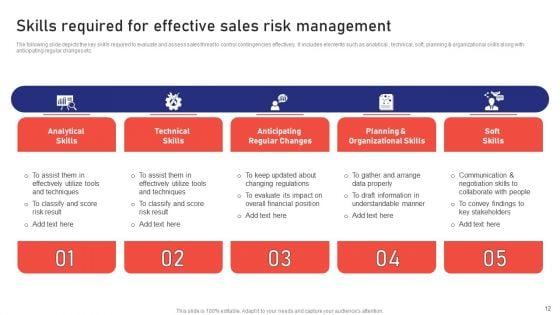
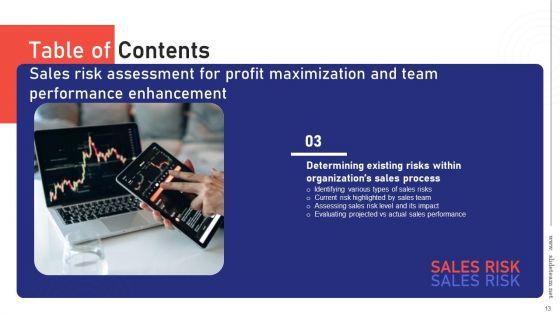
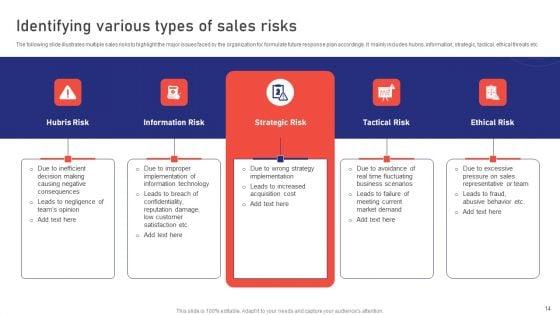
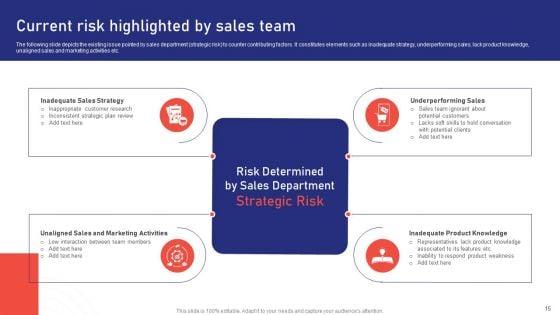
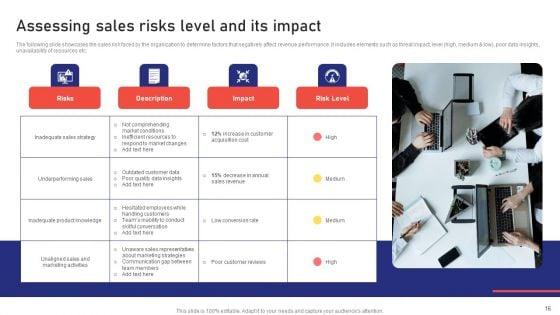
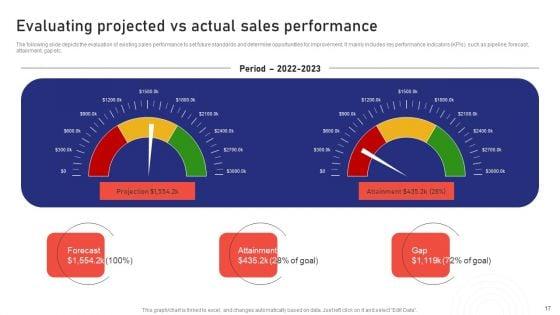

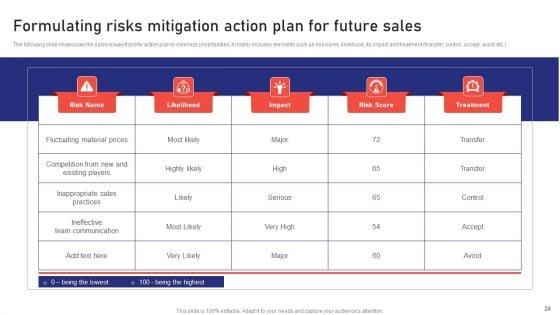
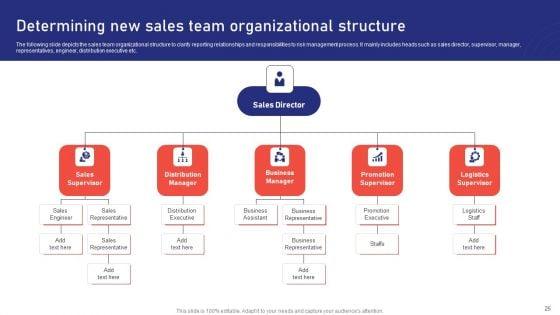


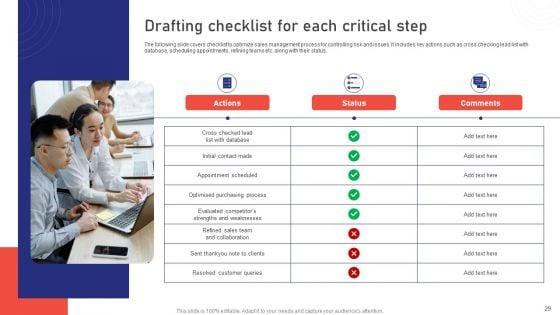

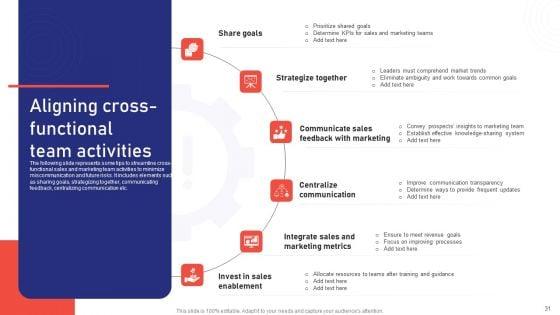

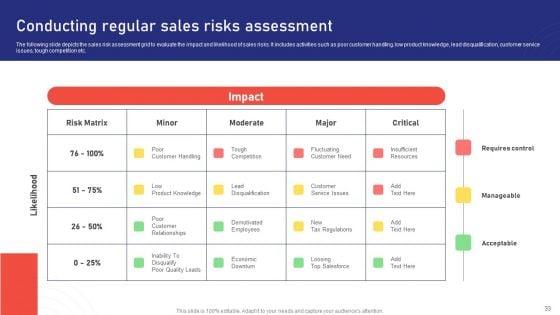

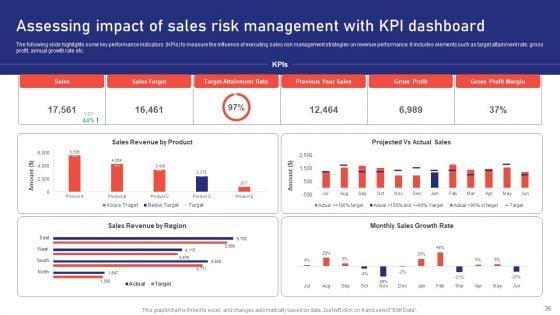
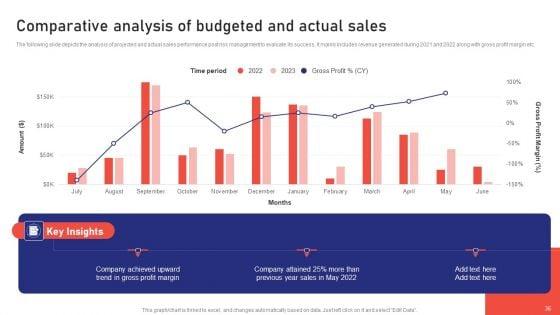


Our Sales Risk Assessment For Profit Maximization And Team Performance Enhancement Ppt PowerPoint Presentation Complete Deck With Slides replete with visuals, whether of date or creative business images, will help you visualize important performance metrics. It contains business information around all the hot-button topics of today that an engaged audience will like to listen to, This PPT template is easy to edit and fully customizable. So download this stunning design right away and reap the harvests of well-presented business knowledge to an appreciative business. Over time, an increase is your proportion of wins per sales effort is the only result that will make you get amazing brand recall for business and your own self on a personal level.
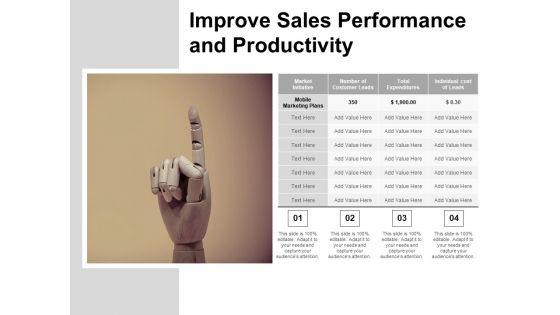


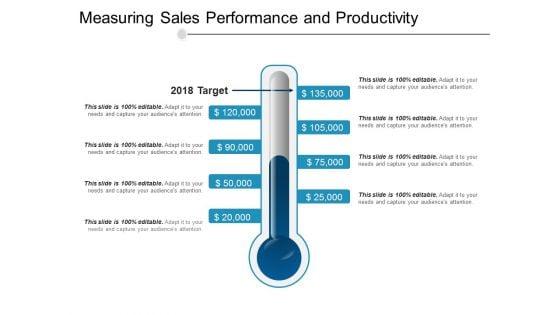


Measuring Sales Performance And Productivity Ppt PowerPoint Presentation Infographic Template Sample
This is a measuring sales performance and productivity ppt powerpoint presentation infographic template sample. This is a eight stage process. The stages in this process are sales objectives, sales goal, achieving sales target.


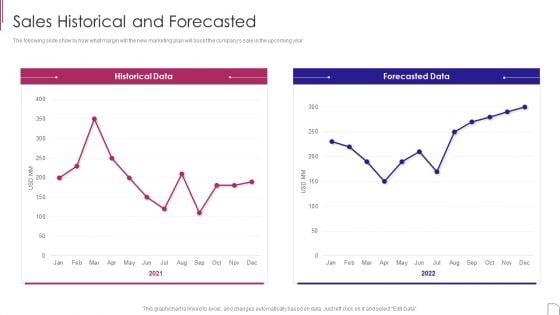
The following slide show by how what margin will the new marketing plan will boost the companys sale in the upcoming year.Deliver an awe inspiring pitch with this creative Yearly Product Performance Assessment Repor Sales Historical And Forecasted Contd Information PDF bundle. Topics like Historical Data, Forecasted Data, Tons Produced can be discussed with this completely editable template. It is available for immediate download depending on the needs and requirements of the user.
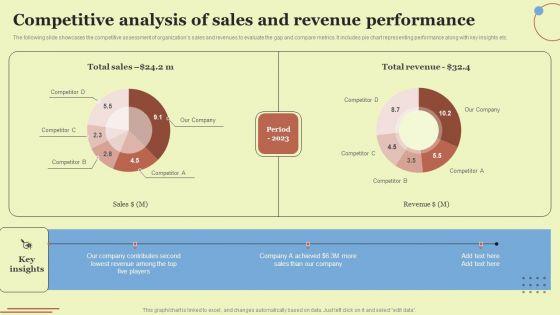

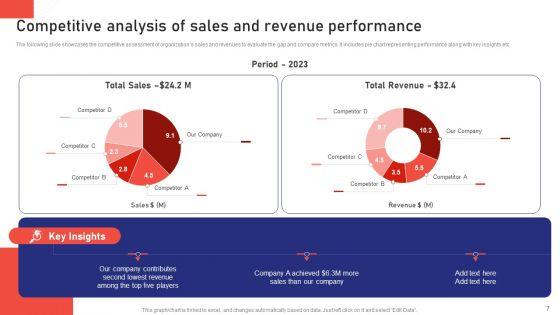
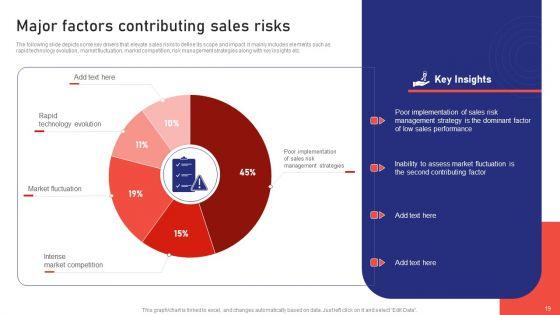
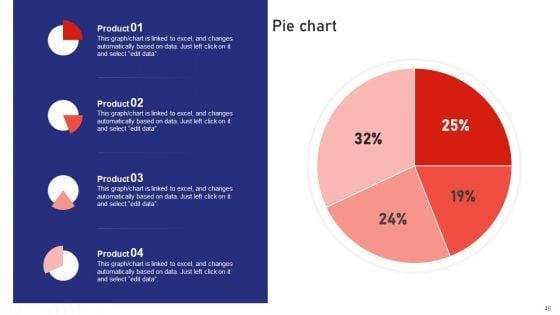
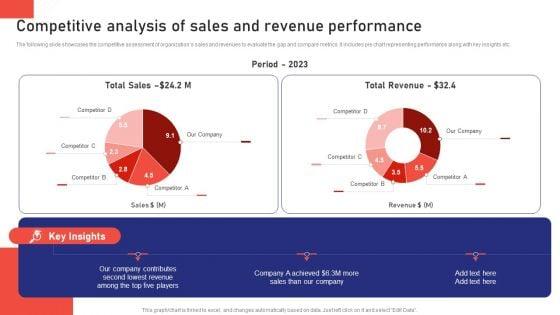
The following slide showcases the competitive assessment of organizations sales and revenues to evaluate the gap and compare metrics. It includes pie chart representing performance along with key insights etc. Take your projects to the next level with our ultimate collection of Competitive Analysis Of Sales And Revenue Performance Elements PDF. Slidegeeks has designed a range of layouts that are perfect for representing task or activity duration, keeping track of all your deadlines at a glance. Tailor these designs to your exact needs and give them a truly corporate look with your own brand colors they will make your projects stand out from the rest.
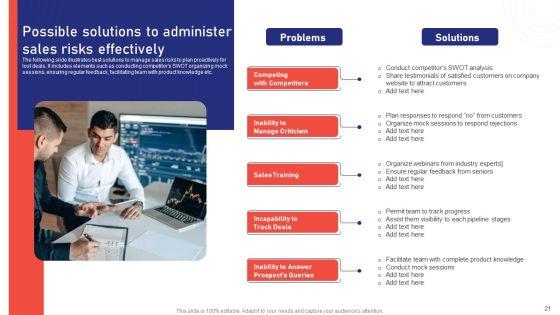
The following slide showcases the competitive assessment of organizations sales and revenues to evaluate the gap and compare metrics. It includes pie chart representing performance along with key insights etc. Find a pre designed and impeccable Mitigating Sales Risks With Strategic Action Planning Competitive Analysis Of Sales And Revenue Performance Slides PDF. The templates can ace your presentation without additional effort. You can download these easy to edit presentation templates to make your presentation stand out from others. So, what are you waiting for Download the template from Slidegeeks today and give a unique touch to your presentation.
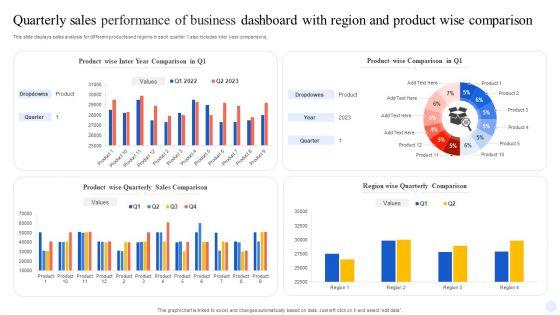

This slide displays sales analysis for different products and regions in each quarter. t also includes inter year comparisons. Pitch your topic with ease and precision using this Quarterly Sales Performance Of Business Dashboard With Region And Product Wise Comparison Guidelines PDF. This layout presents information on Product Wise Quarterly Sales, Comparison. It is also available for immediate download and adjustment. So, changes can be made in the color, design, graphics or any other component to create a unique layout.
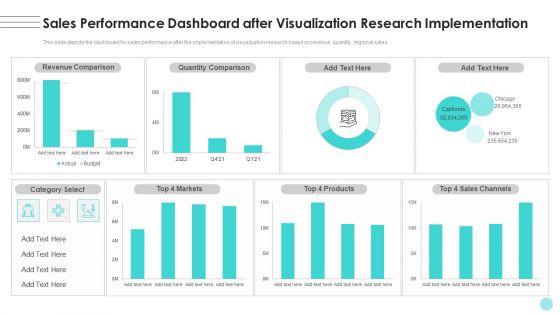

This slide depicts the dashboard for sales performance after the implementation of visualization research based on revenue, quantity, regional sales. Crafting an eye-catching presentation has never been more straightforward. Let your presentation shine with this tasteful yet straightforward Branches For Visualization Research And Development Sales Performance Dashboard After Infographics PDF template. It offers a minimalistic and classy look that is great for making a statement. The colors have been employed intelligently to add a bit of playfulness while still remaining professional. Construct the ideal Branches For Visualization Research And Development Sales Performance Dashboard After Infographics PDF that effortlessly grabs the attention of your audience Begin now and be certain to wow your customers.

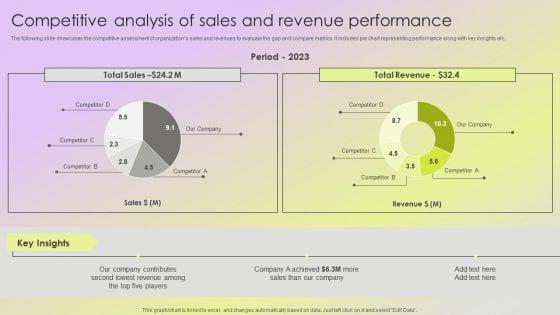
The following slide showcases the competitive assessment of organizations sales and revenues to evaluate the gap and compare metrics. It includes pie chart representing performance along with key insights etc. Slidegeeks is one of the best resources for PowerPoint templates. You can download easily and regulate Sales Risk Assessment For Profit Maximization Competitive Analysis Of Sales And Revenue Performance Introduction PDF for your personal presentations from our wonderful collection. A few clicks is all it takes to discover and get the most relevant and appropriate templates. Use our Templates to add a unique zing and appeal to your presentation and meetings. All the slides are easy to edit and you can use them even for advertisement purposes.
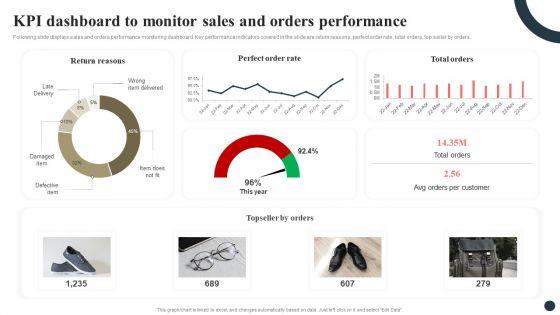
Following slide displays sales and orders performance monitoring dashboard. Key performance indicators covered in the slide are return reasons, perfect order rate, total orders, top seller by orders. Crafting an eye-catching presentation has never been more straightforward. Let your presentation shine with this tasteful yet straightforward Strategic Guide For Positioning Expanded Brand KPI Dashboard To Monitor Sales And Orders Performance Diagrams PDF template. It offers a minimalistic and classy look that is great for making a statement. The colors have been employed intelligently to add a bit of playfulness while still remaining professional. Construct the ideal Strategic Guide For Positioning Expanded Brand KPI Dashboard To Monitor Sales And Orders Performance Diagrams PDF that effortlessly grabs the attention of your audience Begin now and be certain to wow your customers.

Here an illustrative One Pager Sales Agent Performance And Presence Status Summary PDF Document PPT Template. This one-pager template is designed to match your needs. It is 100 percent editable, which allows you to make changes as you seem fit to suit your purpose. Grab this One Pager Sales Agent Performance And Presence Status Summary PDF Document PPT Template Download now.


The mentioned slide presents the performance report of number of watches sold and revenue generated quarterly over the course of past 2 years. It showcases the sales and the profit earned quarterly. Showcasing this set of slides titled Product Periodic Sale And Profit Performance Report Topics PDF. The topics addressed in these templates are Product Category, Sub Category, Product . All the content presented in this PPT design is completely editable. Download it and make adjustments in color, background, font etc. as per your unique business setting.
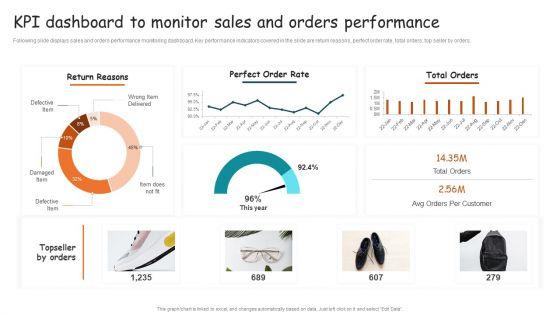

Following slide displays sales and orders performance monitoring dashboard. Key performance indicators covered in the slide are return reasons, perfect order rate, total orders, top seller by orders. Do you have an important presentation coming up Are you looking for something that will make your presentation stand out from the rest Look no further than Guide For Brand Kpi Dashboard To Monitor Sales And Orders Performance Brochure PDF. With our professional designs, you can trust that your presentation will pop and make delivering it a smooth process. And with Slidegeeks, you can trust that your presentation will be unique and memorable. So why wait Grab Guide For Brand Kpi Dashboard To Monitor Sales And Orders Performance Brochure PDF today and make your presentation stand out from the rest.
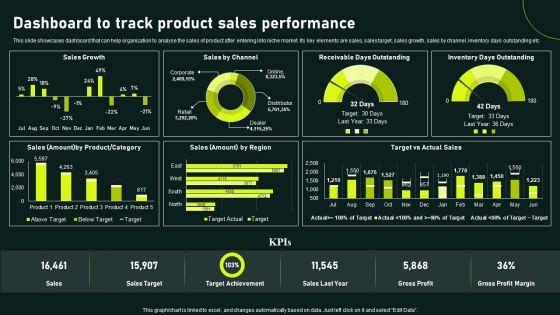

This slide showcases dashboard that can help organization to analyse the sales of product after entering into niche market. Its key elements are sales, sales target, sales growth, sales by channel, inventory days outstanding etc. Crafting an eye-catching presentation has never been more straightforward. Let your presentation shine with this tasteful yet straightforward Dashboard To Track Product Sales Performance Gaining Competitive Advantage And Capturing Sample PDF template. It offers a minimalistic and classy look that is great for making a statement. The colors have been employed intelligently to add a bit of playfulness while still remaining professional. Construct the ideal Dashboard To Track Product Sales Performance Gaining Competitive Advantage And Capturing Sample PDF that effortlessly grabs the attention of your audience Begin now and be certain to wow your customers.
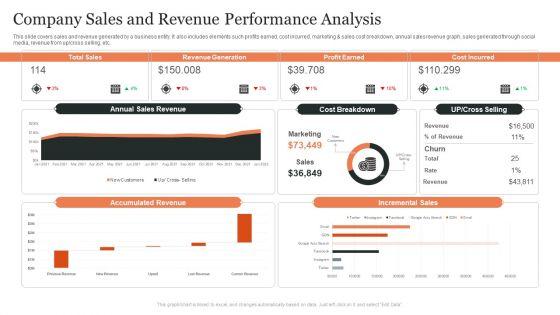

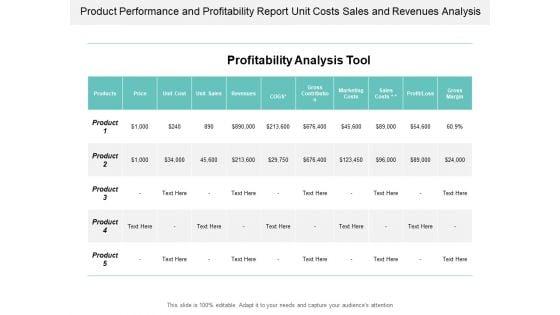
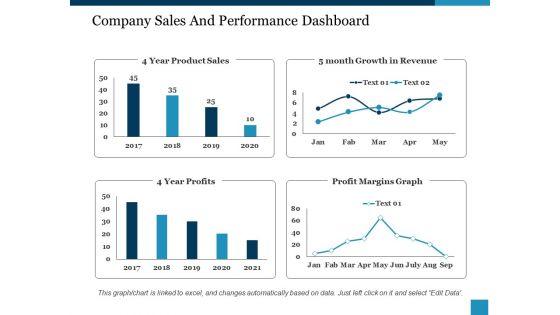
This slide covers sales and revenue generated by a business entity. It also includes elements such profits earned, cost incurred, marketing and sales cost breakdown, annual sales revenue graph, sales generated through social media, revenue from up OR cross selling, etc. Pitch your topic with ease and precision using this Company Sales And Revenue Performance Analysis Ppt Ideas Format PDF. This layout presents information on Total Sales, Revenue Generation, Profit Earned, Cost Incurred. It is also available for immediate download and adjustment. So, changes can be made in the color, design, graphics or any other component to create a unique layout.
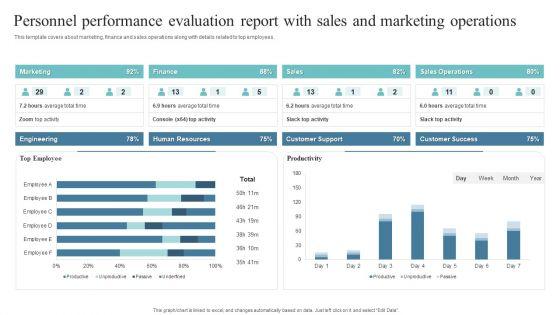

This template covers about marketing, finance and sales operations along with details related to top employees.Showcasing this set of slides titled Personnel Performance Evaluation Report With Sales And Marketing Operations Infographics PDF. The topics addressed in these templates are Human Resources, Customer Support, Sales Operations. All the content presented in this PPT design is completely editable. Download it and make adjustments in color, background, font etc. as per your unique business setting.
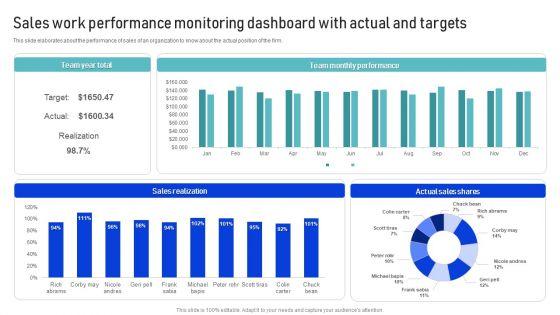

This slide elaborates about the performance of sales of an organization to know about the actual position of the firm. Showcasing this set of slides titled Sales Work Performance Monitoring Dashboard With Actual And Targets Introduction PDF. The topics addressed in these templates are Sales Realization, Team Monthly, Performance. All the content presented in this PPT design is completely editable. Download it and make adjustments in color, background, font etc. as per your unique business setting.
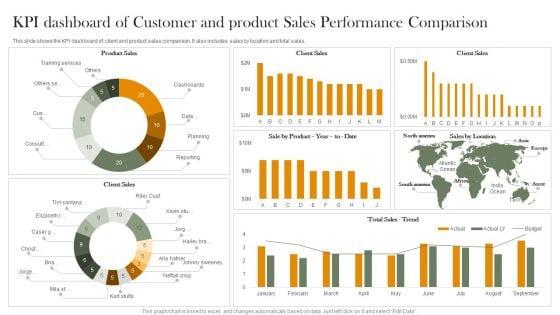
This slide shows the KPI dashboard of client and product sales comparison. It also includes sales by location and total sales. Pitch your topic with ease and precision using this KPI Dashboard Of Customer And Product Sales Performance Comparison Information PDF. This layout presents information on Product Sales, Client Sales, Tim Santana. It is also available for immediate download and adjustment. So, changes can be made in the color, design, graphics or any other component to create a unique layout.
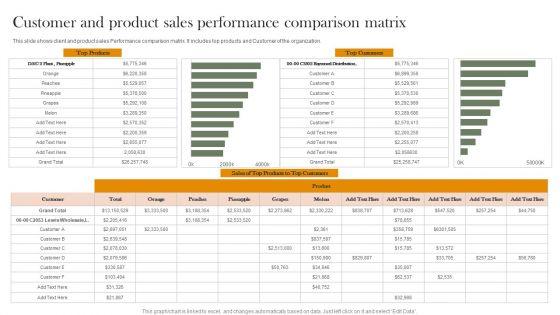

This slide shows client and product sales Performance comparison matrix. It includes top products and Customer of the organization. Showcasing this set of slides titled Customer And Product Sales Performance Comparison Matrix Introduction PDF. The topics addressed in these templates are Top Products, Top Customers, Sales. All the content presented in this PPT design is completely editable. Download it and make adjustments in color, background, font etc. as per your unique business setting.
The following slide showcases a dashboard to track and measure website performance. It includes key elements such as visits, average session duration, bounce rate, page views, goal conversion, visits by week, traffic sources, top channels by conversions, etc. From laying roadmaps to briefing everything in detail, our templates are perfect for you. You can set the stage with your presentation slides. All you have to do is download these easy to edit and customizable templates. Process Enhancement Plan To Boost Sales Performance Website Performance Tracking And Monitoring Dashboard Diagrams PDF will help you deliver an outstanding performance that everyone would remember and praise you for. Do download this presentation today.
The following slide showcases a dashboard to track and measure social media platforms performance. It includes key elements such as website traffic, social media referral rate, site revenue, social media site revenue, etc. Get a simple yet stunning designed Process Enhancement Plan To Boost Sales Performance Social Media Performance Tracking And Monitoring Dashboard Elements PDF. It is the best one to establish the tone in your meetings. It is an excellent way to make your presentations highly effective. So, download this PPT today from Slidegeeks and see the positive impacts. Our easy to edit Process Enhancement Plan To Boost Sales Performance Social Media Performance Tracking And Monitoring Dashboard Elements PDF can be your go-to option for all upcoming conferences and meetings. So, what are you waiting for Grab this template today.


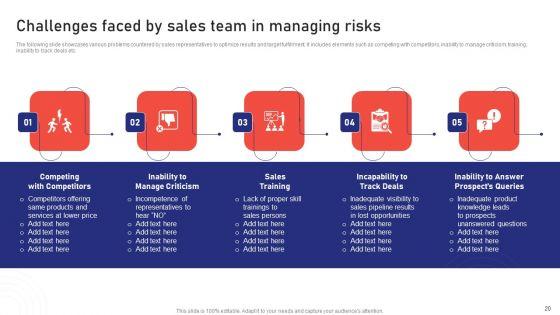
This slide showcases various issues faced by business in customer issue managing and resolving. It includes problems such as high objection handling and resolution time and lack of trained sales representatives. Find a pre designed and impeccable Process Enhancement Plan To Boost Sales Performance Challenges In Managing And Resolving Client Objections Themes PDF. The templates can ace your presentation without additional effort. You can download these easy to edit presentation templates to make your presentation stand out from others. So, what are you waiting for Download the template from Slidegeeks today and give a unique touch to your presentation.
This slide showcases a dashboard presenting various metrics to measure and analyze sales performance for revenue growth. It includes key components such as number of sales, revenue, profit, cost, sales revenue, sales increment, cost analysis and cross sell. Create an editable Process Enhancement Plan To Boost Sales Performance Monthly Sales Performance Tracking And Monitoring Dashboard Professional PDF that communicates your idea and engages your audience. Whether youre presenting a business or an educational presentation, pre designed presentation templates help save time. Process Enhancement Plan To Boost Sales Performance Monthly Sales Performance Tracking And Monitoring Dashboard Professional PDF is highly customizable and very easy to edit, covering many different styles from creative to business presentations. Slidegeeks has creative team members who have crafted amazing templates. So, go and get them without any delay.


This slide illustrates sales revenue and costs tracking dashboard. It provides information about sales count, profit, expenses, sales revenue, expenses breakdown, up or cross selling, etc. Showcasing this set of slides titled Sales Performance Monitoring Dashboard With Revenue And Cost Metric Ppt Portfolio Good PDF. The topics addressed in these templates are Sales Count, Revenue, Profit, Expenses. All the content presented in this PPT design is completely editable. Download it and make adjustments in color, background, font etc. as per your unique business setting.


This slide illustrates leads tracking and sales funnel sheet. It provides details such as company, name, status, next action, price, taxes, discounts, total, etc. Showcasing this set of slides titled Sales Funnel And Leads Performance Monitoring Sheet Ppt Professional Tips PDF. The topics addressed in these templates are Sales Funnel Chart, Salesperson, Next Action. All the content presented in this PPT design is completely editable. Download it and make adjustments in color, background, font etc. as per your unique business setting.

This slide illustrates sales dashboard for tracking conversion and leads. It provides information about sales trends, expected sales, leads information, etc. Showcasing this set of slides titled Sales Dashboard For Performance Monitoring Conversion And Leads Ppt Infographics Smartart PDF. The topics addressed in these templates are Deal Conversion Overall, Expected Sales, Leads Generated. All the content presented in this PPT design is completely editable. Download it and make adjustments in color, background, font etc. as per your unique business setting.

This slide shows quarterly business review dashboard highlighting total sales and revenue. It provides information about new customer, gross profit, customer satisfaction, profitability, etc. Pitch your topic with ease and precision using this Sales Quarterly Performance Review System Dashboard Indicating Total Sales And Revenue Download PDF. This layout presents information on Revenue, New Customer, Gross Profit. It is also available for immediate download and adjustment. So, changes can be made in the color, design, graphics or any other component to create a unique layout.
This slide showcases evaluating teams through 360 degree feedback method. It provides information about reliability, loyalty, initiatives, participitative, communication skills, writing skills, feedback, decision making, quick grasping, etc.Crafting an eye-catching presentation has never been more straightforward. Let your presentation shine with this tasteful yet straightforward Sales Team Performance Management And Tracking Dashboard Building Efficient Workplace Performance Summary PDF template. It offers a minimalistic and classy look that is great for making a statement. The colors have been employed intelligently to add a bit of playfulness while still remaining professional. Construct the ideal Sales Team Performance Management And Tracking Dashboard Building Efficient Workplace Performance Summary PDF that effortlessly grabs the attention of your audience Begin now and be certain to wow your customers.
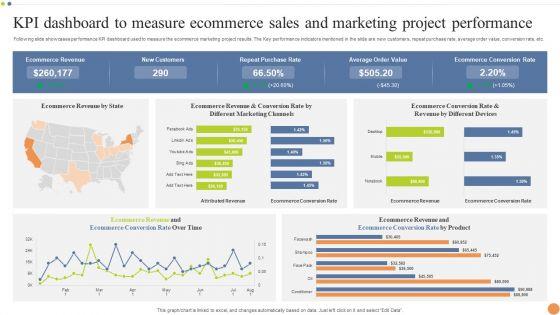

Following slide showcases performance KPI dashboard used to measure the ecommerce marketing project results. The Key performance indicators mentioned in the slide are new customers, repeat purchase rate, average order value, conversion rate, etc. Pitch your topic with ease and precision using this KPI Dashboard To Measure Ecommerce Sales And Marketing Project Performance Portrait PDF. This layout presents information on Purchase Rate, Average Order Value, Ecommerce Conversion Rate. It is also available for immediate download and adjustment. So, changes can be made in the color, design, graphics or any other component to create a unique layout.


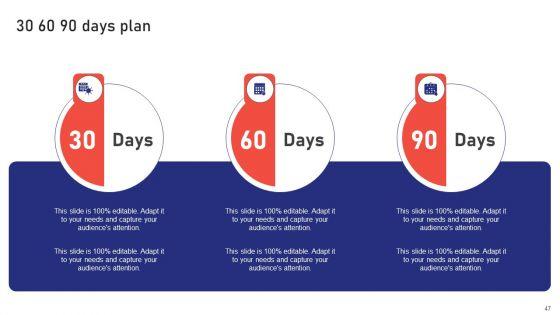
The following slide illustrates the step by step sales and marketing plan to attain the business objectives. It also includes the sales performance evaluation by target achieved in the past 30 60 90 days. Showcasing this set of slides titled 30 60 90 Days Sales And Promotion Planning With Performance Analysis Guidelines PDF. The topics addressed in these templates are 30 60 90 Days, Sales Promotion Planning, Performance Analysis. All the content presented in this PPT design is completely editable. Download it and make adjustments in color, background, font etc. as per your unique business setting.
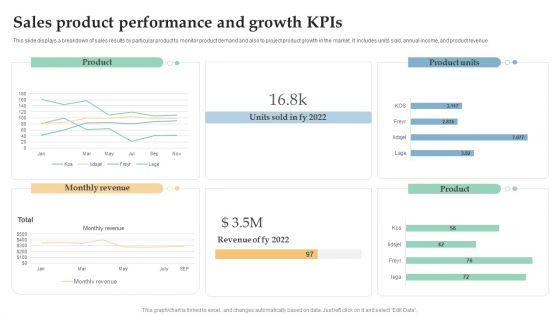
This slide displays a breakdown of sales results by particular product to monitor product demand and also to project product growth in the market. It includes units sold, annual income, and product revenue. Pitch your topic with ease and precision using this Sales Product Performance And Growth Kpis Ppt Layouts Mockup PDF. This layout presents information on Monthly Revenue, Product, Product Units. It is also available for immediate download and adjustment. So, changes can be made in the color, design, graphics or any other component to create a unique layout.
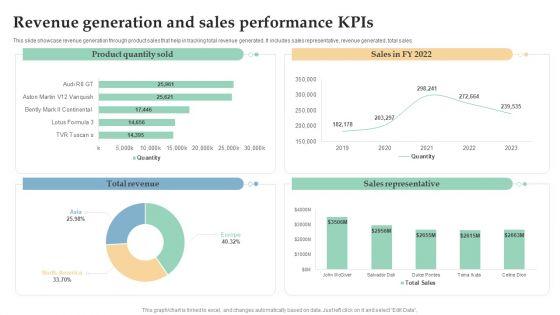

This slide showcase revenue generation through product sales that help in tracking total revenue generated. It includes sales representative, revenue generated, total sales. Pitch your topic with ease and precision using this Revenue Generation And Sales Performance Kpis Ppt Inspiration Background Image PDF. This layout presents information on Total Revenue, Sales Representative, Product Quantity Sold. It is also available for immediate download and adjustment. So, changes can be made in the color, design, graphics or any other component to create a unique layout.
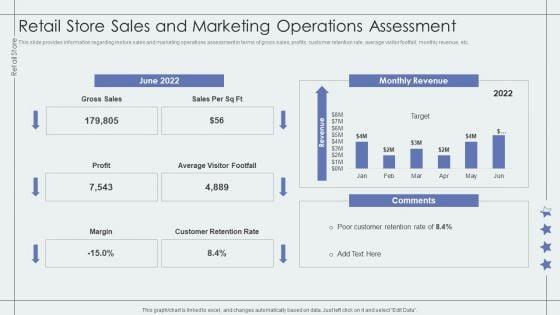

This slide provides information regarding instore sales and marketing operations assessment in terms of gross sales, profits, customer retention rate, average visitor footfall, monthly revenue, etc.Deliver and pitch your topic in the best possible manner with this Retail Store Sales And Marketing Operations Assessment Retail Outlet Performance Assessment Professional PDF. Use them to share invaluable insights on Gross Sales, Visitor Footfall, Customer Retention and impress your audience. This template can be altered and modified as per your expectations. So, grab it now.
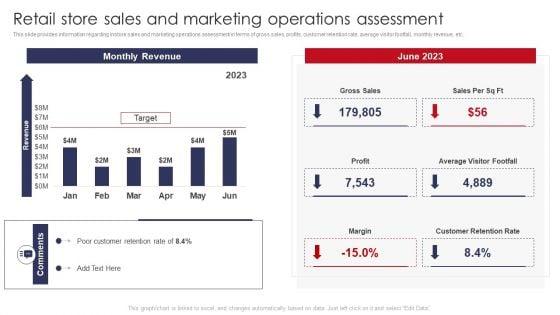

This slide provides information regarding instore sales and marketing operations assessment in terms of gross sales, profits, customer retention rate, average visitor footfall, monthly revenue, etc.Deliver an awe inspiring pitch with this creative Retail Store Sales And Marketing Operations Assessment Retail Outlet Operations Performance Evaluation Formats PDF bundle. Topics like Target, Gross Sales, Average Visitor can be discussed with this completely editable template. It is available for immediate download depending on the needs and requirements of the user.
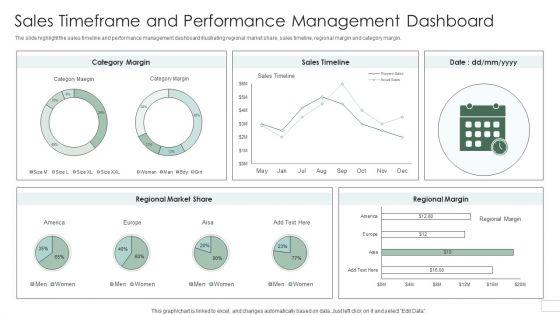
The slide highlight the sales timeline and performance management dashboard illustrating regional market share, sales timeline, regional margin and category margin. Pitch your topic with ease and precision using this Sales Timeframe And Performance Management Dashboard Introduction PDF. This layout presents information on Regional Market Share, Category Margin, Sales Timeline. It is also available for immediate download and adjustment. So, changes can be made in the color, design, graphics or any other component to create a unique layout.
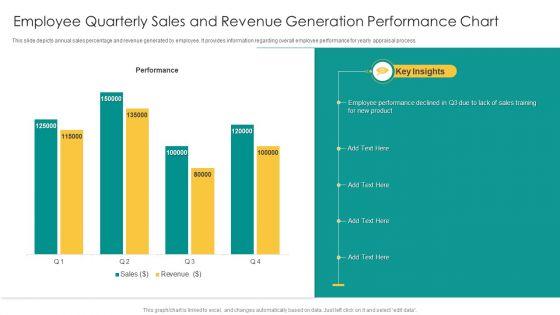
This slide depicts annual sales percentage and revenue generated by employee. It provides information regarding overall employee performance for yearly appraisal process. Pitch your topic with ease and precision using this Employee Quarterly Sales And Revenue Generation Performance Chart Mockup PDF. This layout presents information on Performance, Sales, Revenue. It is also available for immediate download and adjustment. So, changes can be made in the color, design, graphics or any other component to create a unique layout.
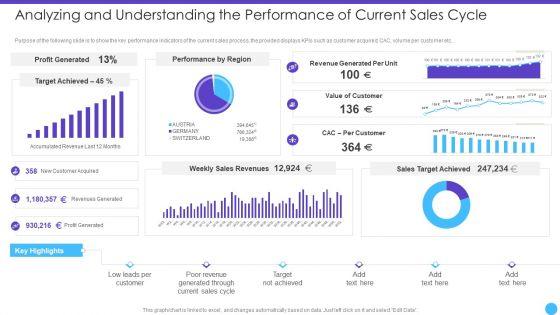
Purpose of the following slide is to show the key performance indicators of the current sales process, the provided displays KPIs such as customer acquired, CAC, volume per customer etc.Deliver an awe inspiring pitch with this creative Analyzing And Understanding The Performance Of Current Sales Cycle Download PDF bundle. Topics like Profit Generated, Target Achieved, Performance By Region can be discussed with this completely editable template. It is available for immediate download depending on the needs and requirements of the user.
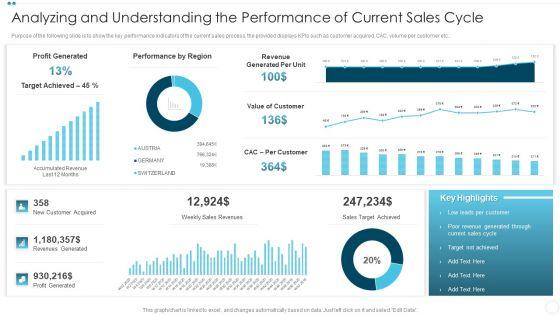

Purpose of the following slide is to show the key performance indicators of the current sales process, the provided displays KPIs such as customer acquired, CAC, volume per customer etc.Deliver and pitch your topic in the best possible manner with this Analyzing And Understanding The Performance Of Current Sales Cycle Background PDF Use them to share invaluable insights on Profit Generated, Performance By Region, Customer Acquired and impress your audience. This template can be altered and modified as per your expectations. So, grab it now.

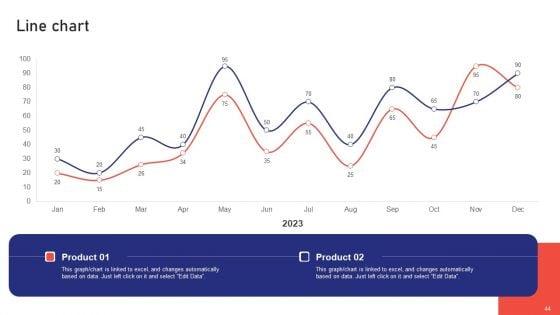
This graph or chart is linked to excel, and changes automatically based on data. Just left click on it and select Edit Data. Deliver an awe inspiring pitch with this creative State And Product Wise Sales Performance Scorecard Summary PDF bundle. Topics like State Wise Sales, Products Sale, Region Wise Sales can be discussed with this completely editable template. It is available for immediate download depending on the needs and requirements of the user.
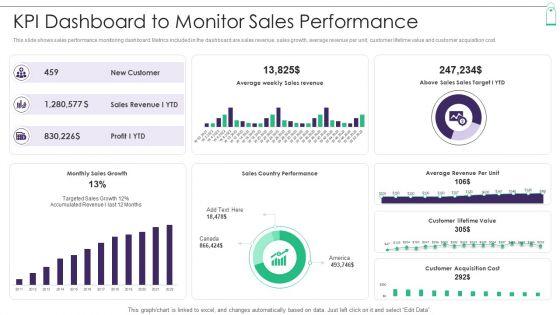

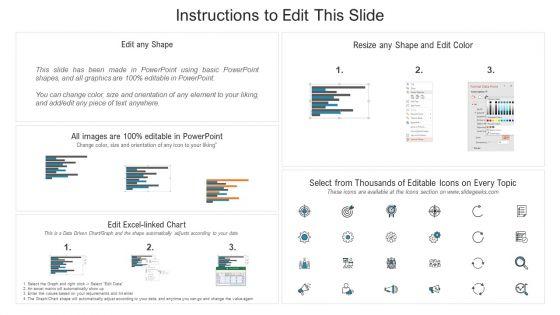
This slide shows sales performance monitoring dashboard. Metrics included in the dashboard are sales revenue, sales growth, average revenue per unit, customer lifetime value and customer acquisition cost. Deliver an awe inspiring pitch with this creative New Product Sales Strategy And Marketing KPI Dashboard To Monitor Sales Performance Information PDF bundle. Topics like Sales Revenue, Monthly Sales Growth, Sales Country Performance can be discussed with this completely editable template. It is available for immediate download depending on the needs and requirements of the user.


This slide illustrates sales representative performance measurement dashboard with key metrics such as average first contact resolution rate, occupancy rate, NPS and top agents by solved tickets. Deliver an awe inspiring pitch with this creative New Product Sales Strategy And Marketing Dashboard To Measure Sales Rep Performance Guidelines PDF bundle. Topics like Contact Resolution Rate, Contact Resolution Rate, Net Promoter Score can be discussed with this completely editable template. It is available for immediate download depending on the needs and requirements of the user.
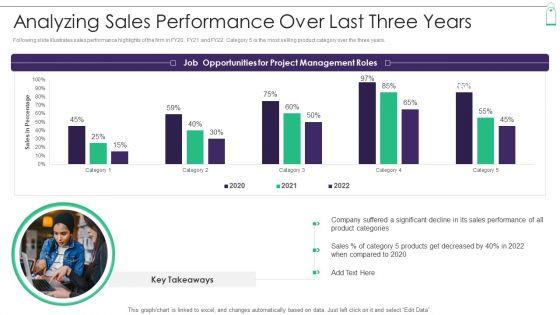

Following slide illustrates sales performance highlights of the firm in FY20, FY21 and FY22. Category 5 is the most selling product category over the three years. Deliver an awe inspiring pitch with this creative New Product Sales Strategy And Marketing Analyzing Sales Performance Over Last Three Years Introduction PDF bundle. Topics like Project Management Roles, Job Opportunities, Product Categories can be discussed with this completely editable template. It is available for immediate download depending on the needs and requirements of the user.
Purpose of the following slide is to show the key performance indicators of the current sales process, the provided displays KPIs such as customer acquired, CAC, volume per customer etc. Deliver and pitch your topic in the best possible manner with this BANT Sales Lead Qualification Model Analyzing And Understanding The Performance Icons PDF. Use them to share invaluable insights on New Customer, Weekly Sales, Revenues Sales and impress your audience. This template can be altered and modified as per your expectations. So, grab it now.
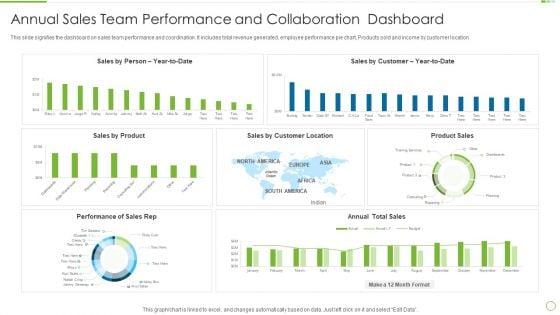

This slide signifies the dashboard on sales team performance and coordination. It includes total revenue generated, employee performance pie chart, Products sold and income by customer location Showcasing this set of slides titled Annual Sales Team Performance And Collaboration Dashboard Themes PDF The topics addressed in these templates are Annual Sales, Team Performance, Collaboration Dashboard All the content presented in this PPT design is completely editable. Download it and make adjustments in color, background, font etc. as per your unique business setting.
Persuade your audience using this Manager Icon Measuring Inbound And Outbound Sales Strategy Performance Diagrams PDF. This PPT design covers three stages, thus making it a great tool to use. It also caters to a variety of topics including Manager Icon Measuring, Inbound And Outbound, Sales Strategy. Download this PPT design now to present a convincing pitch that not only emphasizes the topic but also showcases your presentation skills.
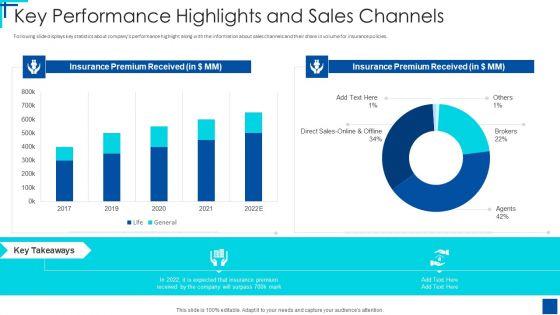

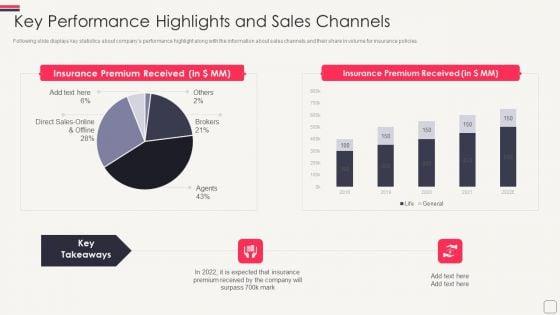
Following slide displays key statistics about companys performance highlight along with the information about sales channels and their share in volume for insurance policies. Deliver an awe inspiring pitch with this creative series c round fundraising pitch deck key performance highlights and sales channels ppt infographic template portrait pdf bundle. Topics like key performance highlights and sales channels can be discussed with this completely editable template. It is available for immediate download depending on the needs and requirements of the user.


Deliver an awe inspiring pitch with this creative sales rep scorecard sales rep scorecard for fmcg products and brands performance summary pdf bundle. Topics like sales rep scorecard for fmcg products and brands performance can be discussed with this completely editable template. It is available for immediate download depending on the needs and requirements of the user.
Fundraising Pitch Deck For Series C Round Key Performance Highlights And Sales Channels Pictures PDF
Following slide displays key statistics about companys performance highlight along with the information about sales channels and their share in volume for insurance policies. Deliver an awe inspiring pitch with this creative fundraising pitch deck for series c round key performance highlights and sales channels pictures pdf bundle. Topics like key performance highlights and sales channels can be discussed with this completely editable template. It is available for immediate download depending on the needs and requirements of the user.
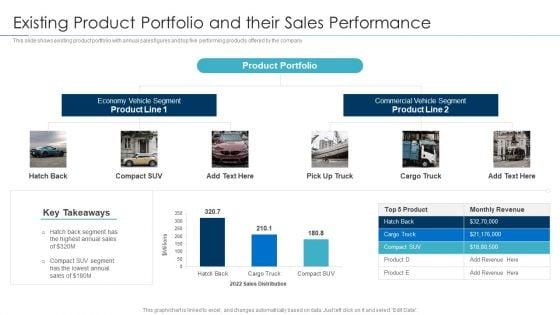
This slide shows existing product portfolio with annual sales figures and top five performing products offered by the company Deliver an awe inspiring pitch with this creative approaches for new product release existing product portfolio and their sales performance pictures pdf bundle. Topics like existing product portfolio and their sales performance can be discussed with this completely editable template. It is available for immediate download depending on the needs and requirements of the user.


Following slide displays key statistics about companys performance highlight along with the information about sales channels and their share in volume for insurance policies. Deliver and pitch your topic in the best possible manner with this series b capital investment key performance highlights and sales channels ppt model graphics download pdf. Use them to share invaluable insights on insurance premium, sales and impress your audience. This template can be altered and modified as per your expectations. So, grab it now.

Deliver and pitch your topic in the best possible manner with this sales and promotion playbook competitive analysis overall performance comparison infographics pdf. Use them to share invaluable insights on product offering, business model, services and impress your audience. This template can be altered and modified as per your expectations. So, grab it now.
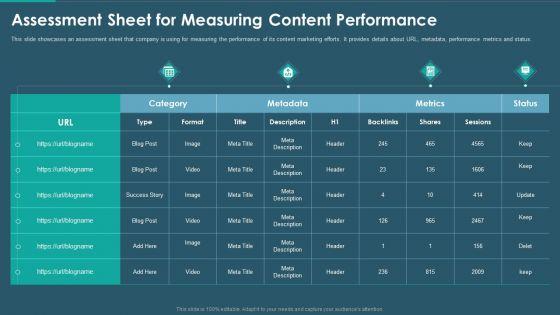

This slide showcases an assessment sheet that company is using for measuring the performance of its content marketing efforts. It provides details about URL, metadata, performance metrics and status. Deliver an awe inspiring pitch with this creative sales and promotion playbook assessment sheet for measuring content performance download pdf bundle. Topics like assessment sheet for measuring content performance can be discussed with this completely editable template. It is available for immediate download depending on the needs and requirements of the user.
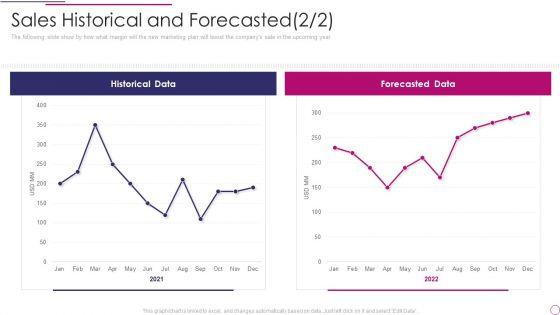
The following slide show by how what margin will the new marketing plan will boost the companys sale in the upcoming year. Deliver and pitch your topic in the best possible manner with this performance analysis of new product development sales historical and forecasted data rules pdf. Use them to share invaluable insights on historical data, forecasted data and impress your audience. This template can be altered and modified as per your expectations. So, grab it now.
DISPLAYING: 60 of 182 Item(s)
Page