- Sign up
- Sign In
 AI PPT Maker
 Templates
 PPT Bundles
 Design Services
 Business PPTs
 Business Plan
 Management
 Strategy
 Introduction PPT
 Roadmap
 Self Introduction
 Timelines
 Process
 Marketing
 Agenda
 Technology
 Medical
 Startup Business Plan
 Cyber Security
 Dashboards
 SWOT
SWOT Proposals
 Education
 Pitch Deck
 Digital Marketing
 KPIs
KPIs Project Management
 Product Management
 Artificial Intelligence
 Target Market
 Communication
 Supply Chain
 Google Slides
 Research Services
 One Pagers
 All Categories
Revenue growth graph PowerPoint Presentation Templates and Google Slides
21 Item(s)


This slide shows the impact of automation on sales performance such as increase in lead qualification rate, pipeline thickness, sales forecast accuracy and response rate after sales process automation.Deliver an awe inspiring pitch with this creative Sales Process Automation For Revenue Growth Impact Of Automation On Sales Performance Graphics PDF bundle. Topics like Lead Qualification, Order Management, Marketing Automation can be discussed with this completely editable template. It is available for immediate download depending on the needs and requirements of the user.

This slide focuses on digital marketing metrics to monitor sales effectiveness which covers total visits and impressions, cost per click, engagement rate, website demographics, quarterly product sales, etc.Deliver and pitch your topic in the best possible manner with this Sales Process Automation For Revenue Growth Digital Marketing Metrics To Monitor Sales Effectiveness Graphics PDF. Use them to share invaluable insights on Automation Potential, Role Of Automation, Included Activities and impress your audience. This template can be altered and modified as per your expectations. So, grab it now.


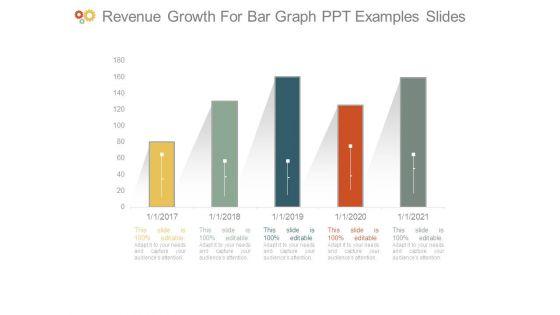
Showcasing this set of slides titled Product Performance Comparison Graph Showing Revenue Growth Portrait PDF. The topics addressed in these templates are Sales Revenue, Product. All the content presented in this PPT design is completely editable. Download it and make adjustments in color, background, font etc. as per your unique business setting.
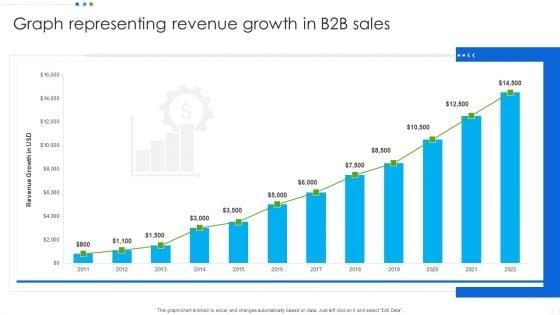
Pitch your topic with ease and precision using this Graph Representing Revenue Growth In B2b Sales Background PDF. This layout presents information on Graph Representing, Revenue Growth, Sales. It is also available for immediate download and adjustment. So, changes can be made in the color, design, graphics or any other component to create a unique layout.
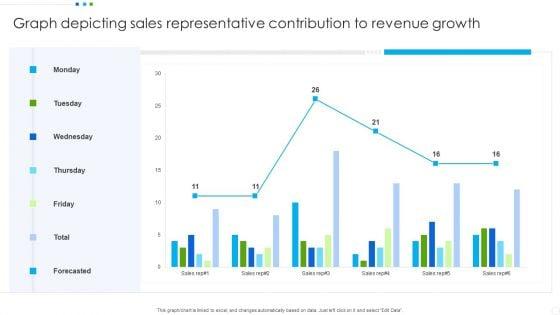

Showcasing this set of slides titled Graph Depicting Sales Representative Contribution To Revenue Growth Graphics PDF. The topics addressed in these templates are Graph Depicting Sales, Revenue Growth. All the content presented in this PPT design is completely editable. Download it and make adjustments in color, background, font etc. as per your unique business setting.

This Slide Illustrates Key Insights About The Revenue Generation Of Global Online Dating Market Along With The Stats Of Revenue Growth Projections. Deliver and pitch your topic in the best possible manner with this Elevator Online Dating Software Worldwide Revenue Generation And Growth Graphics PDF. Use them to share invaluable insights on Revenue Generation, Growth, Global Online, Dating Industry, 2016 To 2022 and impress your audience. This template can be altered and modified as per your expectations. So, grab it now.
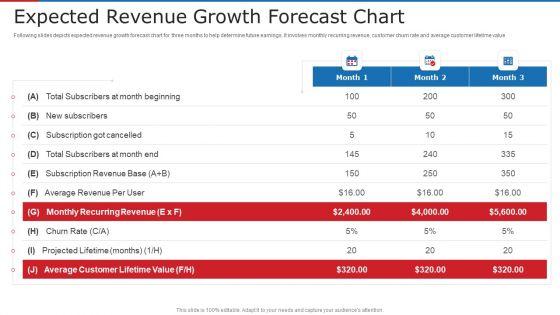

Following slides depicts expected revenue growth forecast chart for three months to help determine future earnings. It involves monthly recurring revenue, customer churn rate and average customer lifetime value Deliver an awe inspiring pitch with this creative expected revenue growth forecast chart ppt professional graphics tutorials pdf bundle. Topics like average, revenue, rate can be discussed with this completely editable template. It is available for immediate download depending on the needs and requirements of the user.
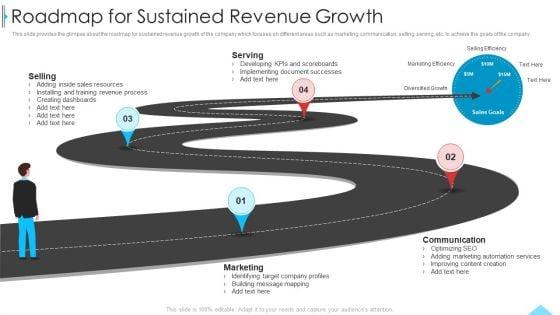
This slide provides the glimpse about the roadmap for sustained revenue growth of the company which focuses on different areas such as marketing, communication, selling, serving, etc. to achieve the goals of the company. Presenting business profile for sales negotiations roadmap for sustained revenue growth ppt professional graphics example pdf to provide visual cues and insights. Share and navigate important information on four stages that need your due attention. This template can be used to pitch topics like selling, serving, marketing, communication. In addtion, this PPT design contains high resolution images, graphics, etc, that are easily editable and available for immediate download.


Presenting seven stages pyramid with growth and revenue ppt powerpoint presentation show graphics download pdf to dispense important information. This template comprises seven stages. It also presents valuable insights into the topics including growth, revenue, global expansion, process, draft, vision, create. This is a completely customizable PowerPoint theme that can be put to use immediately. So, download it and address the topic impactfully.
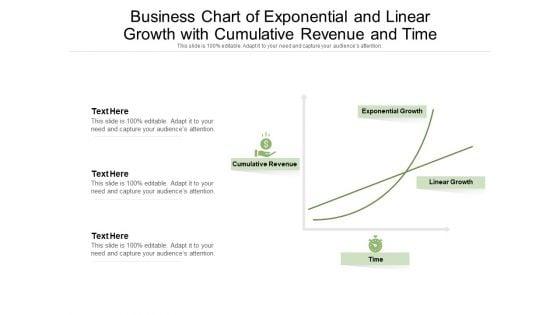

Presenting this set of slides with name business chart of exponential and linear growth with cumulative revenue and time ppt powerpoint presentation professional graphic images pdf. This is a four stage process. The stages in this process are cumulative revenue, exponential growth, linear growth, time. This is a completely editable PowerPoint presentation and is available for immediate download. Download now and impress your audience.


Presenting this set of slides with name omni channel revenue growth ppt powerpoint presentation summary graphics template cpb pdf. This is an editable Powerpoint three stages graphic that deals with topics like omni channel revenue growth to help convey your message better graphically. This product is a premium product available for immediate download and is 100 percent editable in Powerpoint. Download this now and use it in your presentations to impress your audience.
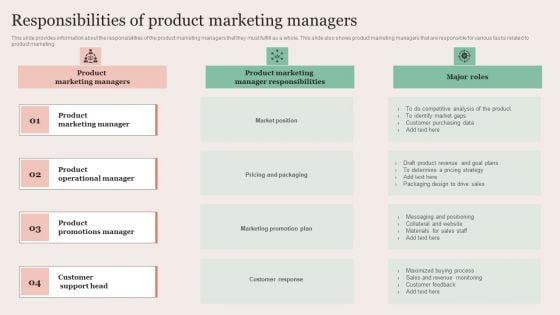


This slide provides information about the responsibilities of the product marketing managers that they must fulfill as a whole. This slide also shows product marketing managers that are responsible for various tasks related to product marketing. Retrieve professionally designed Strategic Brand Promotion For Enhanced Recognition And Revenue Growth Responsibilities Of Product Marketing Managers Graphics PDF to effectively convey your message and captivate your listeners. Save time by selecting pre made slideshows that are appropriate for various topics, from business to educational purposes. These themes come in many different styles, from creative to corporate, and all of them are easily adjustable and can be edited quickly. Access them as PowerPoint templates or as Google Slides themes. You do not have to go on a hunt for the perfect presentation because Slidegeeks got you covered from everywhere.
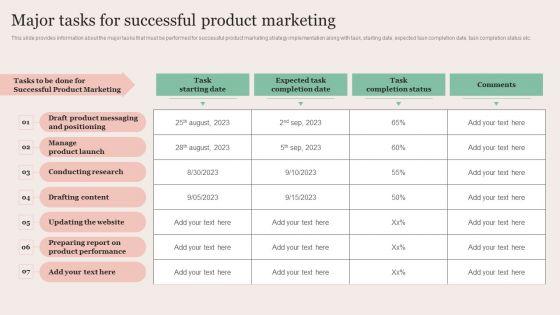
This slide provides information about the major tasks that must be performed for successful product marketing strategy implementation along with task, starting date, expected task completion date, task completion status etc. This modern and well arranged Strategic Brand Promotion For Enhanced Recognition And Revenue Growth Major Tasks For Successful Product Marketing Graphics PDF provides lots of creative possibilities. It is very simple to customize and edit with the Powerpoint Software. Just drag and drop your pictures into the shapes. All facets of this template can be edited with Powerpoint no extra software is necessary. Add your own material, put your images in the places assigned for them, adjust the colors, and then you can show your slides to the world, with an animated slide included.
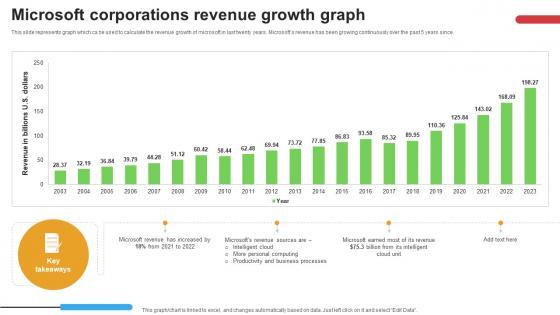

This slide represents graph which ca be used to calculate the revenue growth of microsoft in last twenty years. Microsofts revenue has been growing continuously over the past 5 years since. Slidegeeks has constructed Micosoft Intensive Growth Microsoft Corporations Revenue Growth Graph Strategy SS V after conducting extensive research and examination. These presentation templates are constantly being generated and modified based on user preferences and critiques from editors. Here, you will find the most attractive templates for a range of purposes while taking into account ratings and remarks from users regarding the content. This is an excellent jumping-off point to explore our content and will give new users an insight into our top-notch PowerPoint Templates. This slide represents graph which ca be used to calculate the revenue growth of microsoft in last twenty years. Microsofts revenue has been growing continuously over the past 5 years since.


This slide represents graph which ca be used to calculate the revenue growth of Microsoft in last twenty years. Microsofts revenue has been growing continuously over the past 5 years since. Presenting this PowerPoint presentation, titled Microsoft Corporations Revenue Growth Graph Strategic Advancements By Microsofts Diagrams Pdf, with topics curated by our researchers after extensive research. This editable presentation is available for immediate download and provides attractive features when used. Download now and captivate your audience. Presenting this Microsoft Corporations Revenue Growth Graph Strategic Advancements By Microsofts Diagrams Pdf. Our researchers have carefully researched and created these slides with all aspects taken into consideration. This is a completely customizable Microsoft Corporations Revenue Growth Graph Strategic Advancements By Microsofts Diagrams Pdf that is available for immediate downloading. Download now and make an impact on your audience. Highlight the attractive features available with our PPTs. This slide represents graph which ca be used to calculate the revenue growth of Microsoft in last twenty years. Microsofts revenue has been growing continuously over the past 5 years since.
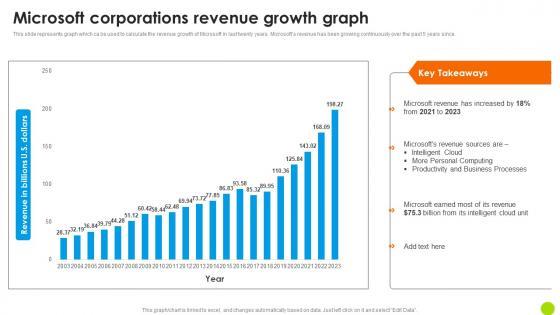

This slide represents graph which ca be used to calculate the revenue growth of Microsoft in last twenty years. Microsofts revenue has been growing continuously over the past 5 years since. Presenting this PowerPoint presentation, titled Microsoft Corporations Revenue Growth Graph Microsoft Long Term Business Professional PDF, with topics curated by our researchers after extensive research. This editable presentation is available for immediate download and provides attractive features when used. Download now and captivate your audience. Presenting this Microsoft Corporations Revenue Growth Graph Microsoft Long Term Business Professional PDF. Our researchers have carefully researched and created these slides with all aspects taken into consideration. This is a completely customizable Microsoft Corporations Revenue Growth Graph Microsoft Long Term Business Professional PDF that is available for immediate downloading. Download now and make an impact on your audience. Highlight the attractive features available with our PPTs. This slide represents graph which ca be used to calculate the revenue growth of Microsoft in last twenty years. Microsofts revenue has been growing continuously over the past 5 years since.


This slide represents graph which ca be used to calculate the revenue growth of Microsoft in last twenty years. Microsofts revenue has been growing continuously over the past 5 years since. Whether you have daily or monthly meetings, a brilliant presentation is necessary. Microsoft Strategic Plan To Become Market Leader Microsoft Corporations Revenue Growth Graph Portrait PDF can be your best option for delivering a presentation. Represent everything in detail using Microsoft Strategic Plan To Become Market Leader Microsoft Corporations Revenue Growth Graph Portrait PDF and make yourself stand out in meetings. The template is versatile and follows a structure that will cater to your requirements. All the templates prepared by Slidegeeks are easy to download and edit. Our research experts have taken care of the corporate themes as well. So, give it a try and see the results.

The following slide outlines key drivers that influence the sale of various products in the retail industry. The major growth drivers of retail businesses are Convenience, store image, eCommerce, and target market. Formulating a presentation can take up a lot of effort and time, so the content and message should always be the primary focus. The visuals of the PowerPoint can enhance the presenters message, so our Retail Ecommerce Merchandising Tactics For Boosting Revenue Major Growth Drivers In USA For Retail Sector Graphics PDF was created to help save time. Instead of worrying about the design, the presenter can concentrate on the message while our designers work on creating the ideal templates for whatever situation is needed. Slidegeeks has experts for everything from amazing designs to valuable content, we have put everything into Retail Ecommerce Merchandising Tactics For Boosting Revenue Major Growth Drivers In USA For Retail Sector Graphics PDF
21 Item(s)