 AI PPT Maker
 Templates
 PPT Bundles
 Design Services
 Business PPTs
 Business Plan
 Management
 Strategy
 Introduction PPT
 Roadmap
 Self Introduction
 Timelines
 Process
 Marketing
 Agenda
 Technology
 Medical
 Startup Business Plan
 Cyber Security
 Dashboards
 SWOT
SWOT Proposals
 Education
 Pitch Deck
 Digital Marketing
 KPIs
KPIs Project Management
 Product Management
 Artificial Intelligence
 Target Market
 Communication
 Supply Chain
 Google Slides
 Research Services
 One Pagers
 All Categories
Revenue expenses PowerPoint Presentation Templates and Google Slides
SHOW
- 60
- 120
- 180
DISPLAYING: 60 of 86 Item(s)
Page

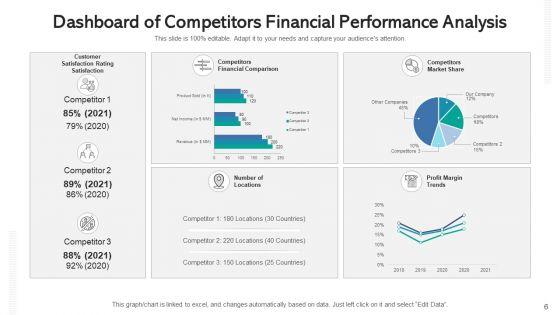
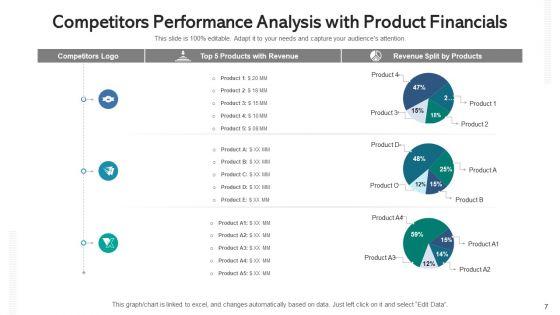


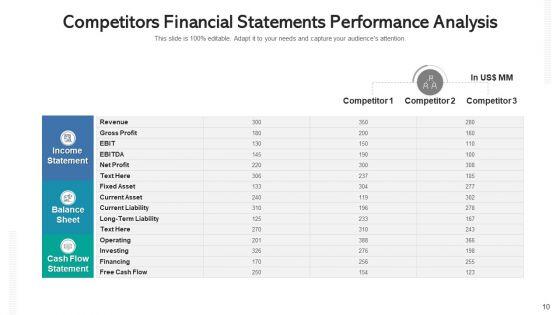


Share a great deal of information on the topic by deploying this competitors revenue statement analysis expenses ppt powerpoint presentation complete deck with slides. Support your ideas and thought process with this prefabricated set. It includes a set of twelve slides, all fully modifiable and editable. Each slide can be restructured and induced with the information and content of your choice. You can add or remove large content boxes as well, to make this PPT slideshow more personalized. Its high-quality graphics and visuals help in presenting a well-coordinated pitch. This PPT template is also a resourceful tool to take visual cues from and implement the best ideas to help your business grow and expand. The main attraction of this well-formulated deck is that everything is editable, giving you the freedom to adjust it to your liking and choice. Changes can be made in the background and theme as well to deliver an outstanding pitch. Therefore, click on the download button now to gain full access to this multifunctional set.
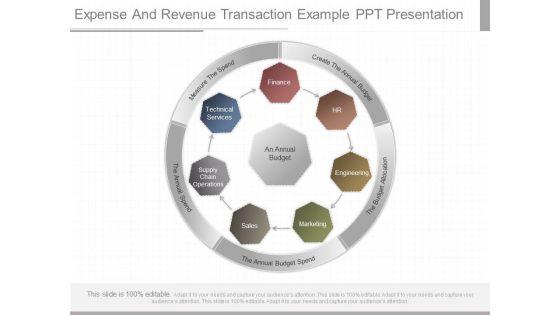


This is a expense and revenue transaction example ppt presentation. This is a seven stage process. The stages in this process are an annual budget, create the annual budget, the budget allocation, the annual budget spend, the annual spend, measure the spend, finance, hr, engineering, marketing, sales, supply chain operations, technical services.


Presenting this set of slides with name revenues expenses ppt powerpoint presentation show template cpb. This is a four stage process. The stages in this process are revenues expenses. This is a completely editable PowerPoint presentation and is available for immediate download. Download now and impress your audience.


This slide represents budget allocation for the key cost that are involved in house flipping process faced by investor. It includes purchase price, renovating cost, carrying cost and selling cost. Do you have an important presentation coming up Are you looking for something that will make your presentation stand out from the rest Look no further than Strategies For Flipping Houses For Maximum Revenue Budget Allocation For Major Expenses Involved Mockup PDF. With our professional designs, you can trust that your presentation will pop and make delivering it a smooth process. And with Slidegeeks, you can trust that your presentation will be unique and memorable. So why wait Grab Strategies For Flipping Houses For Maximum Revenue Budget Allocation For Major Expenses Involved Mockup PDF today and make your presentation stand out from the rest.
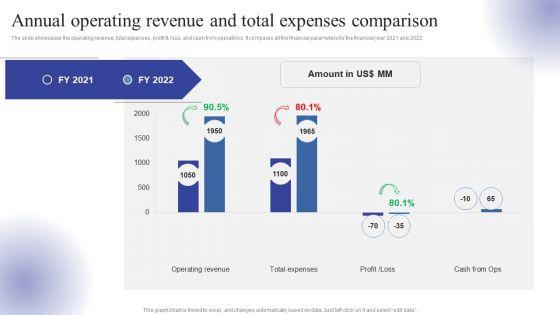
The slide showcases the operating revenue, total expenses, profit and loss, and cash from operations. It compares all the financial parameters for the financial year 2021 and 2022. Want to ace your presentation in front of a live audience Our Annual Operating Revenue And Total Expenses Comparison Ppt Infographic Template Rules PDF can help you do that by engaging all the users towards you.. Slidegeeks experts have put their efforts and expertise into creating these impeccable powerpoint presentations so that you can communicate your ideas clearly. Moreover, all the templates are customizable, and easy-to-edit and downloadable. Use these for both personal and commercial use.

This slide shows the consolidated statement covering the operating revenue and expenses in a fiscal year. Presenting you an exemplary Consolidated Financial Revenue And Expenses One Pager Documents. Our one-pager comprises all the must-have essentials of an inclusive document. You can edit it with ease, as its layout is completely editable. With such freedom, you can tweak its design and other elements to your requirements. Download this Consolidated Financial Revenue And Expenses One Pager Documents brilliant piece now.


This one page covers about revenue generated and expense in financial year through product selling and marketing. Presenting you a fantastic Organizational Revenue Generated With Expenses One Pager Documents. This piece is crafted on hours of research and professional design efforts to ensure you have the best resource. It is completely editable and its design allow you to rehash its elements to suit your needs. Get this Organizational Revenue Generated With Expenses One Pager Documents A4 One-pager now.
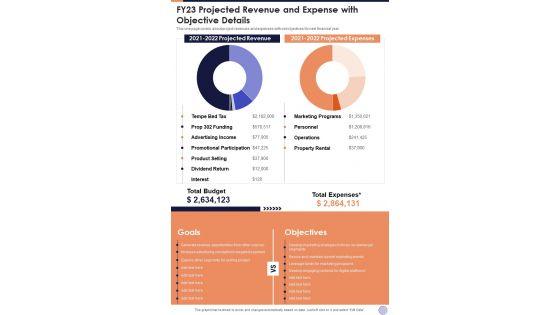
This one page covers about project revenues and expenses with set objectives for next financial year. Presenting you an exemplary FY23 Projected Revenue And Expense With Objective Details One Pager Documents. Our one-pager comprises all the must-have essentials of an inclusive document. You can edit it with ease, as its layout is completely editable. With such freedom, you can tweak its design and other elements to your requirements. Download this FY23 Projected Revenue And Expense With Objective Details One Pager Documents brilliant piece now.


This slide shows pie chart of organizational revenue and expenses. It can be used by a firm to categorize revenue and expenses sources. Showcasing this set of slides titled Financial Position Evaluation Of Organization Revenue And Expenses Slides PDF. The topics addressed in these templates are Expenses, Revenue, Commissions, Services, Products. All the content presented in this PPT design is completely editable. Download it and make adjustments in color, background, font etc. as per your unique business setting.


This slides covers the statement of revenue and expenses on organization from different countries Fy2020. Presenting you a fantastic Determining Expenses And Total Revenue FY2020 One Pager Documents. This piece is crafted on hours of research and professional design efforts to ensure you have the best resource. It is completely editable and its design allow you to rehash its elements to suit your needs. Get this Determining Expenses And Total Revenue FY2020 One Pager Documents A4 One-pager now.
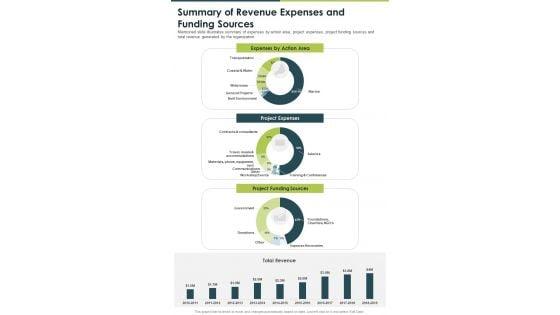

Presenting you a fantastic Summary Of Revenue Expenses And Funding Sources One Pager Documents. This piece is crafted on hours of research and professional design efforts to ensure you have the best resource. It is completely editable and its design allow you to rehash its elements to suit your needs. Get this Summary Of Revenue Expenses And Funding Sources One Pager Documents A4 One-pager now.
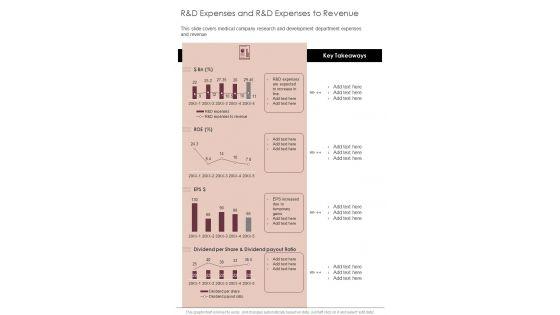

Presenting you a fantastic R And D Expenses And R And D Expenses To Revenue One Pager Documents. This piece is crafted on hours of research and professional design efforts to ensure you have the best resource. It is completely editable and its design allow you to rehash its elements to suit your needs. Get this R And D Expenses And R And D Expenses To Revenue One Pager Documents A4 One-pager now.


Showcasing this set of slides titled Revenue And Expense Budget Deficit Analysis With KPI Dashboard Rules PDF. The topics addressed in these templates are Revenue And Expense, Budget Deficit Analysis. All the content presented in this PPT design is completely editable. Download it and make adjustments in color, background, font etc. as per your unique business setting.
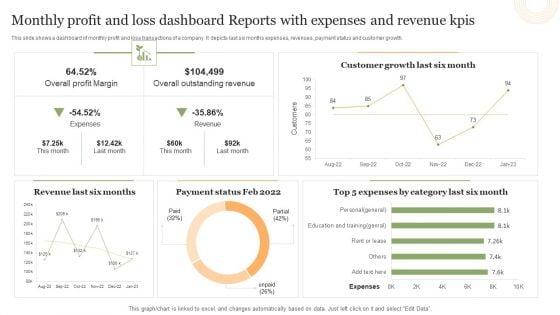
This slide shows a dashboard of monthly profit and loss transactions of a company. It depicts last six months expenses, revenues, payment status and customer growth.Showcasing this set of slides titled Monthly Profit And Loss Dashboard Reports With Expenses And Revenue Kpis Portrait PDF. The topics addressed in these templates are Overall Profit Margin, Overall Outstanding Revenue, Customer Growth. All the content presented in this PPT design is completely editable. Download it and make adjustments in color, background, font etc. as per your unique business setting.
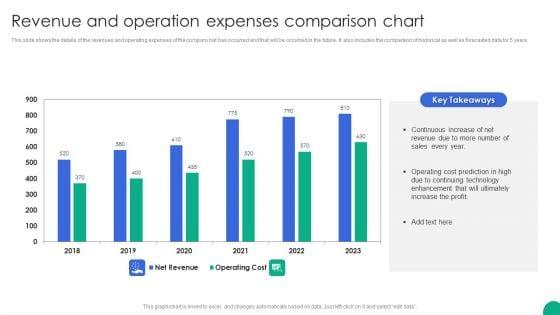
This slide shows the details of the revenues and operating expenses of the company hat has occurred and that will be occurred in the future. It also includes the comparison of historical as well as forecasted data for 5 years.Showcasing this set of slides titled Revenue And Operation Expenses Comparison Chart Slides PDF. The topics addressed in these templates are Continuous Increase, Operating Cost, Enhancement Ultimately. All the content presented in this PPT design is completely editable. Download it and make adjustments in color, background, font etc. as per your unique business setting.
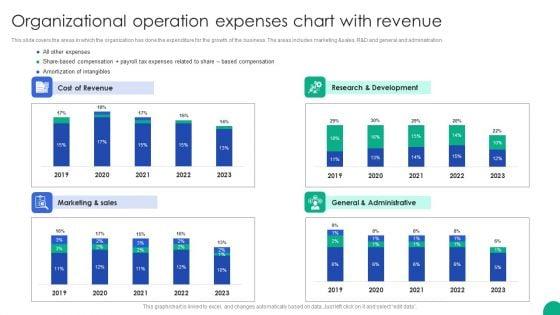

This slide covers the areas in which the organization has done the expenditure for the growth of the business. The areas includes marketing sales, R D and general and administration.Pitch your topic with ease and precision using this Organizational Operation Expenses Chart With Revenue Microsoft PDF. This layout presents information on Cost Revenue, Research Development, General Administrative. It is also available for immediate download and adjustment. So, changes can be made in the color, design, graphics or any other component to create a unique layout.
This slide shows the project management dashboard which covers the name, priorities, indicators and status which includes strategic priorities, research and development, administration, performance management, etc. With purchases in last 30 days and tasks. Showcasing this set of slides titled Project Metrics Dashboard With Revenues And Expenses Icons PDF. The topics addressed in these templates are Performance Management, Research And Development, Strategic Priorities. All the content presented in this PPT design is completely editable. Download it and make adjustments in color, background, font etc. as per your unique business setting.
This slide showcases dashboard that can help organization to evaluate the revenue generated and expenses incurred in conducting operations. It also showcases gross profit and margin of last financial year. Pitch your topic with ease and precision using this Gross Profit Margin Dashboard With Revenue Vs Expenses Icons PDF. This layout presents information on Gross Profit Margin, EBITDA Margin, Net Profit Margin. It is also available for immediate download and adjustment. So, changes can be made in the color, design, graphics or any other component to create a unique layout.

The slide provides revenue and operating expenses comparison for last three years 2017 to 2019 and coming five years 2020 to 2024.Deliver and pitch your topic in the best possible manner with this Investment Banking Security Underwriting Pitchbook Financials Forecast Revenue Vs Operating Expenses Sample PDF Use them to share invaluable insights on Operating Expenses, Operating Expenses, Revenue and impress your audience. This template can be altered and modified as per your expectations. So, grab it now.
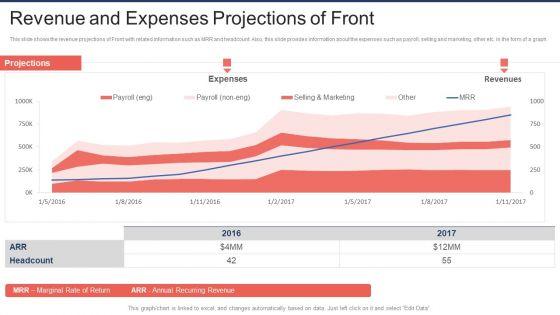
This slide shows the revenue projections of Front with related information such as MRR and headcount. Also, this slide provides information about the expenses such as payroll, selling and marketing, other etc. in the form of a graph. Deliver an awe inspiring pitch with this creative Front Capital Funding Revenue And Expenses Projections Of Front Ppt Portfolio Graphic Tips PDF bundle. Topics like Selling AND Marketing, Payroll Eng, Annual Recurring Revenue can be discussed with this completely editable template. It is available for immediate download depending on the needs and requirements of the user.
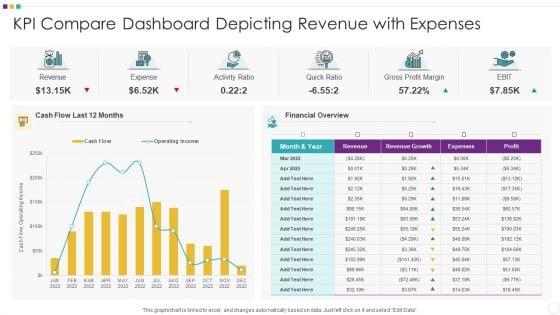

Showcasing this set of slides titled KPI Compare Dashboard Depicting Revenue With Expenses Information PDF The topics addressed in these templates are KPI Compare Dashboard Depicting Revenue With Expenses All the content presented in this PPT design is completely editable. Download it and make adjustments in color, background, font etc. as per your unique business setting.


The slide provides revenue and operating expenses comparison for last three years 2019 to 2021 and coming five years 2022 to 2026. Deliver an awe inspiring pitch with this creative pitch book capital funding deal ipo pitchbook financials forecast revenue vs operating expenses rules pdf bundle. Topics like revenue vs operating expenses, 2019 to 2020, revenue, operating expenses can be discussed with this completely editable template. It is available for immediate download depending on the needs and requirements of the user.
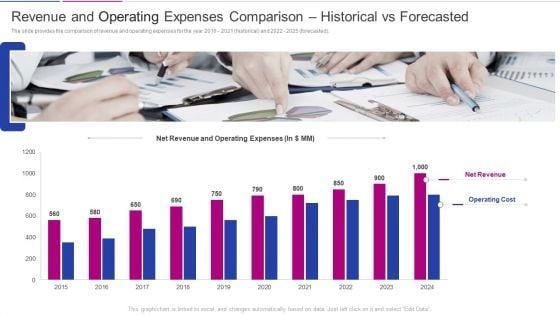
The slide provides the comparison of revenue and operating expenses for the year 2016 to 2021 historical and 2022 to 2025 forecasted. Deliver an awe inspiring pitch with this creative fundraising from corporate investment revenue and operating expenses comparison historical pictures pdf bundle. Topics like net revenue, operating cost can be discussed with this completely editable template. It is available for immediate download depending on the needs and requirements of the user.

This slide showcases Business Revenue Tree that can help ecommerce business to identify the sources of revenue generation. It also showcases expenses incurred by online business in its course of operation. Persuade your audience using this ecommerce business revenue tree analysis with website expenses professional pdf. This PPT design covers one stage, thus making it a great tool to use. It also caters to a variety of topics including ecommerce business revenue tree analysis with website expenses. Download this PPT design now to present a convincing pitch that not only emphasizes the topic but also showcases your presentation skills.
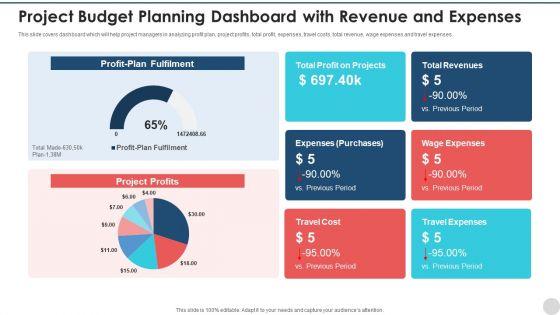

This slide covers dashboard which will help project managers in analyzing profit plan, project profits, total profit, expenses, travel costs, total revenue, wage expenses and travel expenses. Showcasing this set of slides titled project budget planning dashboard with revenue and expenses ideas pdf. The topics addressed in these templates are project budget planning dashboard with revenue and expenses. All the content presented in this PPT design is completely editable. Download it and make adjustments in color, background, font etc. as per your unique business setting.
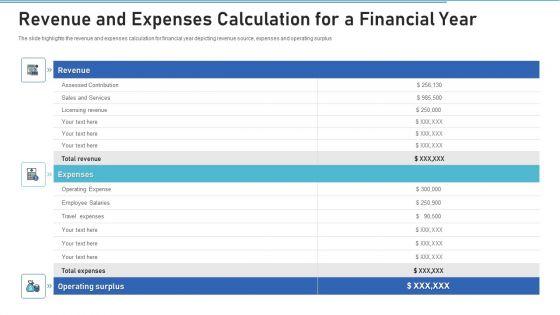
Showcasing this set of slides titled revenue and expenses calculation for a financial year slides pdf. The topics addressed in these templates are revenue, expenses, operating surplus. All the content presented in this PPT design is completely editable. Download it and make adjustments in color, background, font etc. as per your unique business setting.


Pitch Book For Investor Funding Contract Financials Forecast Revenue Vs Operating Expenses Ideas PDF
The slide provides revenue and operating expenses comparison for last three years 2017 to 2019 and coming five years 2020 to 2024. Deliver and pitch your topic in the best possible manner with this pitch book for investor funding contract financials forecast revenue vs operating expenses ideas pdf. Use them to share invaluable insights on revenue, operating expenses and impress your audience. This template can be altered and modified as per your expectations. So, grab it now.
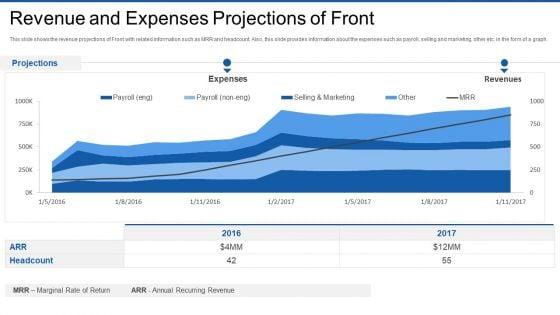

This slide shows the revenue projections of Front with related information such as MRR and headcount. Also, this slide provides information about the expenses such as payroll, selling and marketing, other etc. in the form of a graph. Deliver and pitch your topic in the best possible manner with this front series venture capital funding revenue and expenses projections of front graphics pdf. Use them to share invaluable insights on revenue and expenses projections of front and impress your audience. This template can be altered and modified as per your expectations. So, grab it now.
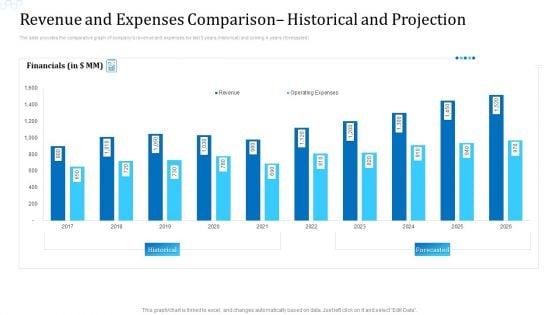
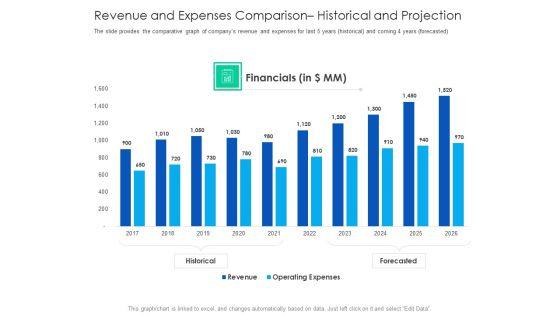
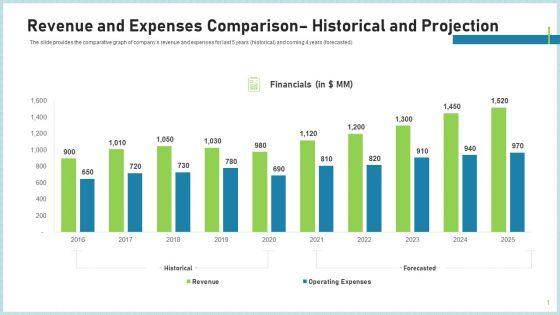
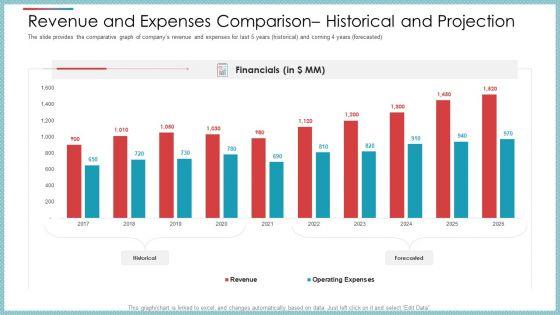
The slide provides the comparative graph of companys revenue and expenses for last 5 years historical and coming 4 years forecasted.Deliver and pitch your topic in the best possible manner with this revenue and expenses comparison historical and projection ppt icon files pdf. Use them to share invaluable insights on financials, 2016 to 2025, revenue, operating expenses and impress your audience. This template can be altered and modified as per your expectations. So, grab it now.

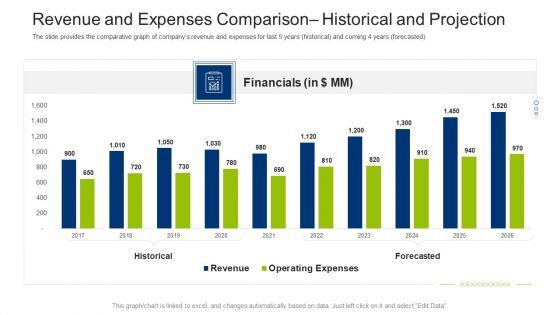
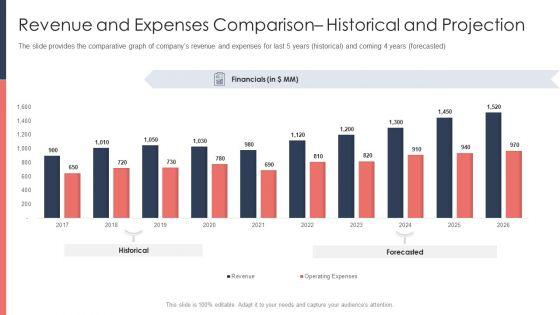
The slide provides the comparative graph of companys revenue and expenses for last 5 years historical and coming 4 years forecasted. Deliver an awe inspiring pitch with this creative revenue and expenses comparison historical and projection mockup pdf bundle. Topics like financials, revenue, expenses can be discussed with this completely editable template. It is available for immediate download depending on the needs and requirements of the user.


The slide provides revenue and operating expenses comparison for last three years 2019 2021 and coming five years 2022 2026. Deliver and pitch your topic in the best possible manner with this pitchbook for ipo deal financials forecast revenue vs operating expenses download pdf. Use them to share invaluable insights on revenue, operating expenses and impress your audience. This template can be altered and modified as per your expectations. So, grab it now.
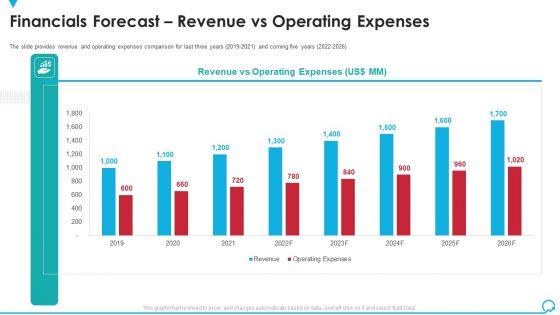

The slide provides revenue and operating expenses comparison for last three years 2019 to 2021 and coming five years 2022 to 2026. Deliver and pitch your topic in the best possible manner with this financials forecast revenue vs operating expenses deal pitchbook ipo demonstration pdf. Use them to share invaluable insights on revenue, operating expenses and impress your audience. This template can be altered and modified as per your expectations. So, grab it now.
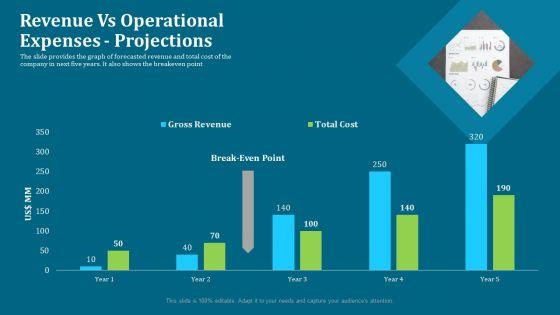
The slide provides the graph of forecasted revenue and total cost of the company in next five years. It also shows the breakeven point. Deliver and pitch your topic in the best possible manner with this seed funding pitch deck revenue vs operational expenses projections designs pdf. Use them to share invaluable insights on gross revenue, total cost and impress your audience. This template can be altered and modified as per your expectations. So, grab it now.

The slide provides the comparison of revenue and operating expenses for the year 2015 - 2020 historical and 2021 - 2024 forecasted. Deliver an awe inspiring pitch with this creative revenue and operating expenses comparison historical vs forecasted summary pdf bundle. Topics like net revenue, operating cost, operating expenses can be discussed with this completely editable template. It is available for immediate download depending on the needs and requirements of the user.
Deliver an awe inspiring pitch with this creative after hours trading revenue and expenses comparison historical and projection microsoft pdf bundle. Topics like revenue and expenses comparison historical and projection can be discussed with this completely editable template. It is available for immediate download depending on the needs and requirements of the user.
Presenting deferred revenue expenses chart vector icon ppt powerpoint presentation file format pdf to dispense important information. This template comprises three stages. It also presents valuable insights into the topics including deferred revenue expenses chart vector icon. This is a completely customizable PowerPoint theme that can be put to use immediately. So, download it and address the topic impactfully.

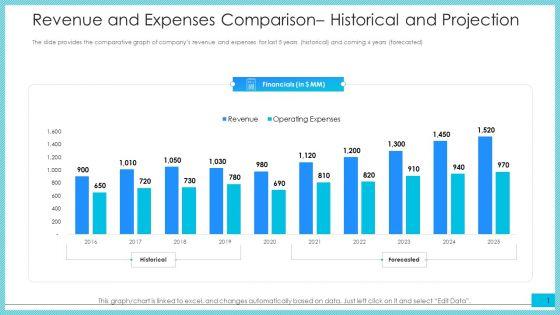
The slide provides the comparative graph of companys revenue and expenses for last 5 years historical and coming 4 years forecasted. Deliver an awe inspiring pitch with this creative investment fundraising pitch deck from stock market revenue and expenses comparison historical and projection infographics pdf bundle. Topics like financials, historical, forecasted, revenue, expenses can be discussed with this completely editable template. It is available for immediate download depending on the needs and requirements of the user.
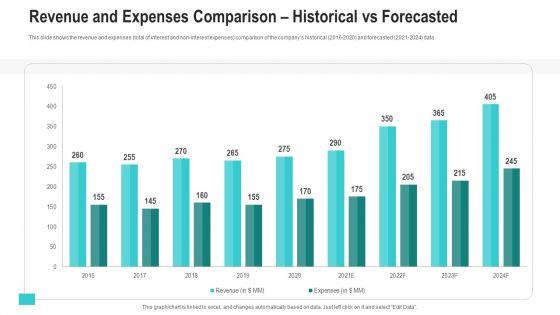

This slide shows the revenue and expenses total of interest and non-interest expenses comparison of the companys historical 2016-2020 and forecasted 2021-2024 data. Deliver and pitch your topic in the best possible manner with this revenue and expenses comparison historical vs forecasted ppt show tips pdf. Use them to share invaluable insights on revenue, expenses and impress your audience. This template can be altered and modified as per your expectations. So, grab it now.


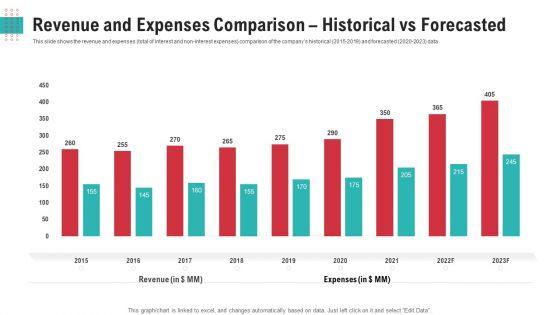
This slide shows the revenue and expenses total of interest and non-interest expenses comparison of the companys historical 2015-2019 and forecasted 2020-2023 data. Deliver an awe inspiring pitch with this creative post initial public offering equity financing pitch revenue and expenses comparison historical vs forecasted summary pdf bundle. Topics like revenue and expenses comparison historical vs forecasted, 2015 to 203 can be discussed with this completely editable template. It is available for immediate download depending on the needs and requirements of the user.
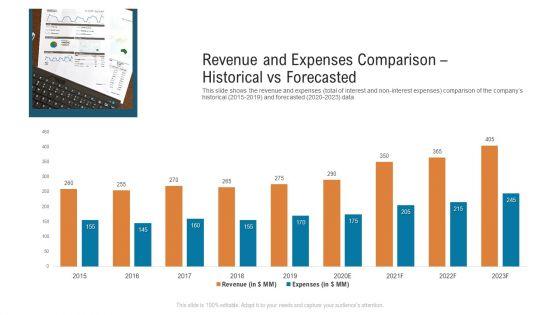
This slide shows the revenue and expenses total of interest and non interest expenses comparison of the companys historical 2015 2019 and forecasted 2020 2023 data. Deliver and pitch your topic in the best possible manner with this revenue and expenses comparison historical vs forecasted microsoft pdf. Use them to share invaluable insights on revenue and expenses comparison historical vs forecasted and impress your audience. This template can be altered and modified as per your expectations. So, grab it now.
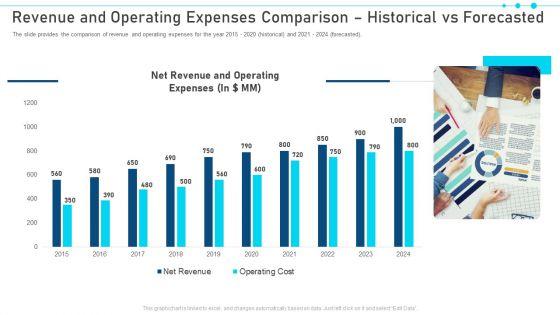

The slide provides the comparison of revenue and operating expenses for the year 2015 2020 historical and 2021 2024 forecasted. Deliver an awe-inspiring pitch with this creative revenue and operating expenses comparison historical vs forecasted pictures pdf. bundle. Topics like revenue and operating expenses comparison historical vs forecasted can be discussed with this completely editable template. It is available for immediate download depending on the needs and requirements of the user.
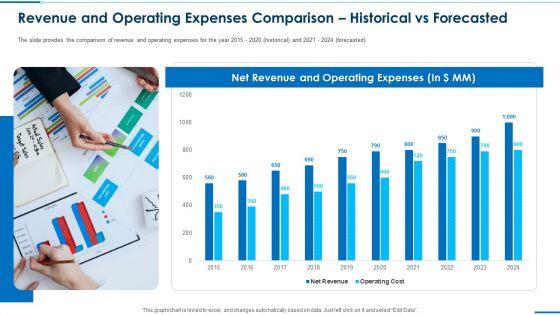

The slide provides the comparison of revenue and operating expenses for the year 2015 2020 historical and 2021 2024 forecasted. Deliver an awe-inspiring pitch with this creative revenue and operating expenses comparison historical vs forecasted background pdf. bundle. Topics like revenue and operating expenses comparison historical vs forecasted can be discussed with this completely editable template. It is available for immediate download depending on the needs and requirements of the user.
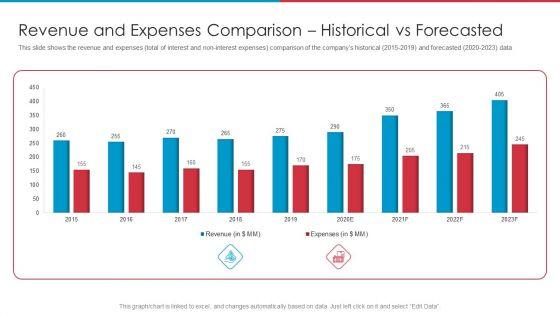

This slide shows the revenue and expenses total of interest and non-interest expenses comparison of the companys historical 2015-2019 and forecasted 2020-2023 data. Deliver an awe-inspiring pitch with this creative after ipo equity revenue and expenses comparison historical vs forecasted slides pdf bundle. Topics like revenue and expenses comparison historical vs forecasted can be discussed with this completely editable template. It is available for immediate download depending on the needs and requirements of the user.
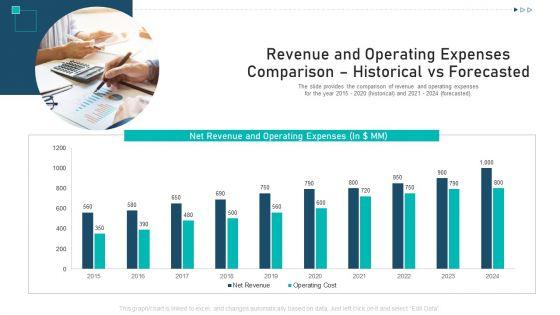

The slide provides the comparison of revenue and operating expenses for the year 2015 2020 historical and 2021 2024 forecasted. Deliver an awe inspiring pitch with this creative revenue and operating expenses comparison historical vs forecasted ppt summary clipart pdf bundle. Topics like revenue and operating expenses comparison historical vs forecasted can be discussed with this completely editable template. It is available for immediate download depending on the needs and requirements of the user.
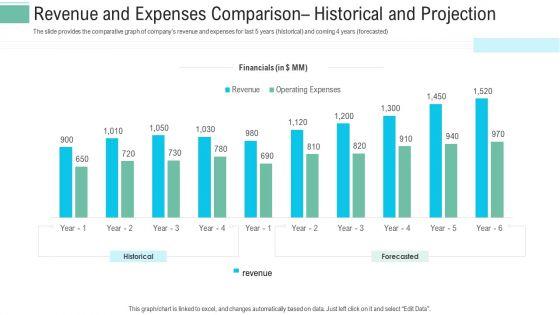
The slide provides the comparative graph of companys revenue and expenses for last 5 years historical and coming 4 years forecasted. Deliver and pitch your topic in the best possible manner with this revenue and expenses comparison historical and projection ppt layouts grid pdf. Use them to share invaluable insights on financials, operating expenses, revenue and impress your audience. This template can be altered and modified as per your expectations. So, grab it now.


The slide provides the comparative graph of companys revenue and expenses for last 5 years historical and coming 4 years forecasted. Deliver and pitch your topic in the best possible manner with this cash market investor deck revenue and expenses comparison historical and projection ppt professional information pdf. Use them to share invaluable insights on financials, revenue, operating expenses, 2016 to 2025 and impress your audience. This template can be altered and modified as per your expectations. So, grab it now.


This slide shows the revenue and expenses total of interest and non interest expenses comparison of the companys historical 2016 to2020 and forecasted 2021 to2024 data.Deliver and pitch your topic in the best possible manner with this revenue and expenses comparison historical vs forecasted ppt show deck pdf. Use them to share invaluable insights on 2015 to 2024, revenue and impress your audience. This template can be altered and modified as per your expectations. So, grab it now.
This slide shows the revenue and expenses total of interest and non-interest expenses comparison of the companys historical 2015 to 2019 and forecasted 2020 to 2023 data.Deliver an awe-inspiring pitch with this creative revenue and expenses comparison historical vs forecasted ppt show outfit pdf. bundle. Topics like 2015 to 2024, revenue can be discussed with this completely editable template. It is available for immediate download depending on the needs and requirements of the user


The slide provides the comparative graph of companys revenue and expenses for last 5 years historical and coming 4 years forecasted. Deliver an awe inspiring pitch with this creative revenue and expenses comparison historical and projection designs pdf bundle. Topics like revenue and expenses comparison historical and projection can be discussed with this completely editable template. It is available for immediate download depending on the needs and requirements of the user.


The slide provides the comparative graph of companys revenue and expenses for last 5 years historical and coming 4 years forecasted. Deliver an awe inspiring pitch with this creative funding pitch to raise funds from pe revenue and expenses comparison historical and projection summary pdf bundle. Topics like financials, historical, forecasted, revenue, expenses can be discussed with this completely editable template. It is available for immediate download depending on the needs and requirements of the user.

the slide provides the comparative graph of companys revenue and expenses for last 5 years historical and coming 4 years forecasted Deliver and pitch your topic in the best possible manner with this pitch deck to attract funding after ipo market revenue and expenses comparison historical and projection topics pdf. Use them to share invaluable insights on historical, forecasted, financials and impress your audience. This template can be altered and modified as per your expectations. So, grab it now.
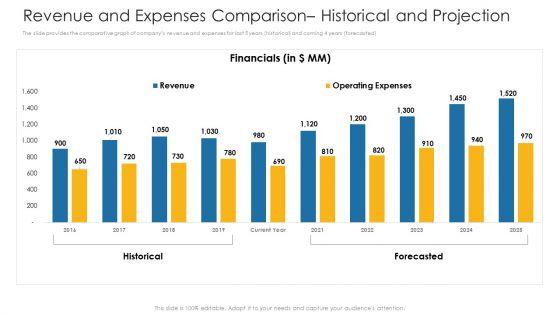

The slide provides the comparative graph of companys revenue and expenses for last 5 years historical and coming 4 years forecasted.Deliver and pitch your topic in the best possible manner with this revenue and expenses comparison historical and projection ppt show slide download pdf. Use them to share invaluable insights on financials, 2016 to 2025, revenue, operating expenses and impress your audience. This template can be altered and modified as per your expectations. So, grab it now.


The slide provides the comparative graph of companys revenue and expenses for last 5 years historical and coming 4 years forecasted. Deliver and pitch your topic in the best possible manner with this pitch deck to raise funding from secondary market revenue and expenses comparison historical and projection summary pdf. Use them to share invaluable insights on financials, revenue, operating expenses and impress your audience. This template can be altered and modified as per your expectations. So, grab it now.

The slide provides the comparative graph of companys revenue and expenses for last 5 years historical and coming 4 years forecasted.Deliver an awe-inspiring pitch with this creative revenue and expenses comparison historical and projection ppt styles graphics design pdf. bundle. Topics like financials, 2016 to 2025, revenue, operating expenses can be discussed with this completely editable template. It is available for immediate download depending on the needs and requirements of the user.

The slide provides the comparative graph of companys revenue and expenses for last 5 years historical and coming 4 years forecastedDeliver and pitch your topic in the best possible manner with this pitch deck for fundraising from post market financing revenue and expenses comparison historical and projection designs pdf. Use them to share invaluable insights on historical, forecasted, financials and impress your audience. This template can be altered and modified as per your expectations. So, grab it now.

The slide provides the comparative graph of companys revenue and expenses for last 5 years historical and coming 4 years forecasted.Deliver and pitch your topic in the best possible manner with this revenue and expenses comparison historical and projection ppt summary example introduction pdf. Use them to share invaluable insights on financials, 2016 to 2025, revenue, operating expenses and impress your audience. This template can be altered and modified as per your expectations. So, grab it now.


The slide provides the comparative graph of companys revenue and expenses for last 5 years historical and coming 4 years forecasted. Deliver and pitch your topic in the best possible manner with this private equity fundraising pitch deck revenue and expenses comparison historical and projection clipart pdf. Use them to share invaluable insights on financials, revenue, operating expenses, 2016 to 2025 and impress your audience. This template can be altered and modified as per your expectations. So, grab it now.


The slide provides the graph of forecasted revenue and total cost of the company in next five years. It also shows the breakeven point. Deliver an awe inspiring pitch with this creative investor pitch deck to generate capital from pre seed round revenue vs operational expenses projections infographics pdf bundle. Topics like revenue vs operational expenses projections can be discussed with this completely editable template. It is available for immediate download depending on the needs and requirements of the user.
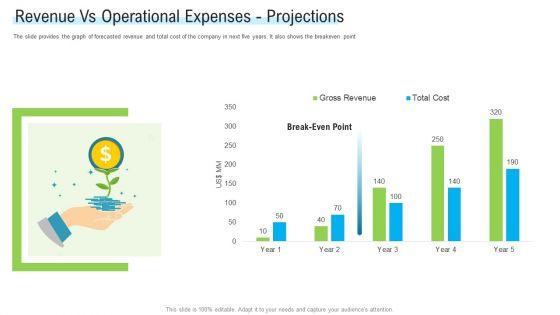

The slide provides the graph of forecasted revenue and total cost of the company in next five years. It also shows the breakeven point. Deliver an awe inspiring pitch with this creative angel investor for seed pitch deck revenue vs operational expenses projections microsoft pdf bundle. Topics like revenue vs operational expenses projections can be discussed with this completely editable template. It is available for immediate download depending on the needs and requirements of the user.
SHOW
- 60
- 120
- 180
DISPLAYING: 60 of 86 Item(s)
Page