- Sign up
- Sign In
 AI PPT Maker
 Templates
 PPT Bundles
 Design Services
 Business PPTs
 Business Plan
 Management
 Strategy
 Introduction PPT
 Roadmap
 Self Introduction
 Timelines
 Process
 Marketing
 Agenda
 Technology
 Medical
 Startup Business Plan
 Cyber Security
 Dashboards
 SWOT
SWOT Proposals
 Education
 Pitch Deck
 Digital Marketing
 KPIs
KPIs Project Management
 Product Management
 Artificial Intelligence
 Target Market
 Communication
 Supply Chain
 Google Slides
 Research Services
 One Pagers
 All Categories
Revenue analysis dashboard PowerPoint Presentation Templates and Google Slides
27 Item(s)

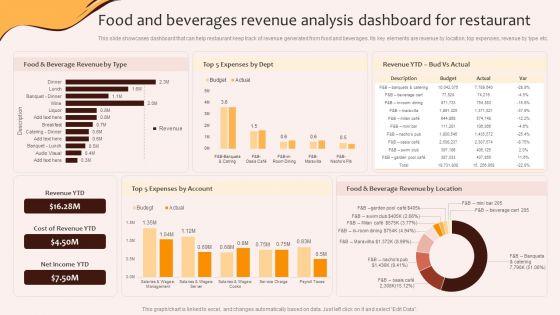
This slide showcases dashboard that can help restaurant keep track of revenue generated from food and beverages. Its key elements are revenue by location, top expenses, revenue by type etc Are you in need of a template that can accommodate all of your creative concepts This one is crafted professionally and can be altered to fit any style. Use it with Google Slides or PowerPoint. Include striking photographs, symbols, depictions, and other visuals. Fill, move around, or remove text boxes as desired. Test out color palettes and font mixtures. Edit and save your work, or work with colleagues. Download Marketing Initiatives To Promote Fast Food Cafe Food And Beverages Revenue Analysis Dashboard Demonstration PDF and observe how to make your presentation outstanding. Give an impeccable presentation to your group and make your presentation unforgettable.
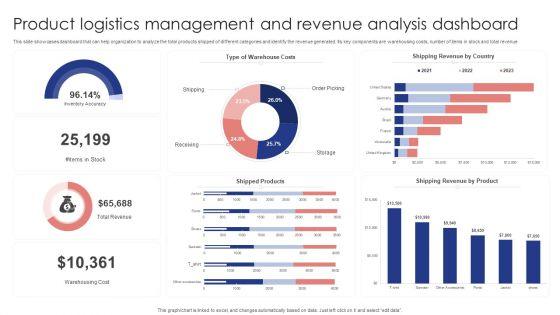

This slide showcases dashboard that can help organization to analyze the total products shipped of different categories and identify the revenue generated. Its key components are warehousing costs, number of items in stock and total revenue. Pitch your topic with ease and precision using this Product Logistics Management And Revenue Analysis Dashboard Demonstration PDF. This layout presents information on Warehouse Costs, Shipping Revenue Country, Shipped Products . It is also available for immediate download and adjustment. So, changes can be made in the color, design, graphics or any other component to create a unique layout.

This slide showcases shipping dashboard that can help company to calculate the revenue generated from delivered products and track the monthly order status. Its key components are highest revenue days, subscription revenue, order status, order revenue and transaction paid status. Showcasing this set of slides titled Logistics Management Revenue Analysis Dashboard With Orders Revenue Brochure PDF. The topics addressed in these templates are Order Revenue, Transaction Paid, Subscription Revenue. All the content presented in this PPT design is completely editable. Download it and make adjustments in color, background, font etc. as per your unique business setting.
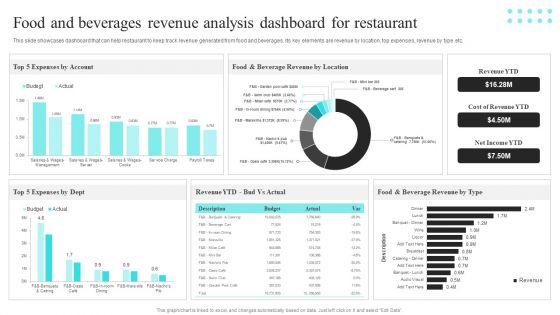

This slide showcases dashboard that can help restaurant to keep track revenue generated from food and beverages. Its key elements are revenue by location, top expenses, revenue by type etc. This Strategic Promotional Guide For Restaurant Business Advertising Food And Beverages Revenue Analysis Dashboard Template PDF from Slidegeeks makes it easy to present information on your topic with precision. It provides customization options, so you can make changes to the colors, design, graphics, or any other component to create a unique layout. It is also available for immediate download, so you can begin using it right away. Slidegeeks has done good research to ensure that you have everything you need to make your presentation stand out. Make a name out there for a brilliant performance.


This slide depicts the dashboard used to analyze the key performance indicators of the revenue planning process. The purpose of this template is to evaluate the revenue based on the actual and budget specified. It includes information related to the product, total, actual and budget revenue. Showcasing this set of slides titled KPI Analysis Of Revenue Planning Procedure Professional PDF. The topics addressed in these templates are Kpi Analysis, Revenue Planning Procedure. All the content presented in this PPT design is completely editable. Download it and make adjustments in color, background, font etc. as per your unique business setting.

This slide showcases dashboard that can help restaurant keep track of revenue generated from food and beverages. Its key elements are revenue by location, top expenses, revenue by type etc.The best PPT templates are a great way to save time, energy, and resources. Slidegeeks have 100precent editable powerpoint slides making them incredibly versatile. With these quality presentation templates, you can create a captivating and memorable presentation by combining visually appealing slides and effectively communicating your message. Download Digital Marketing Plan For Restaurant Business Food And Beverages Revenue Analysis Dashboard Template PDF from Slidegeeks and deliver a wonderful presentation.

This slide provides dashboard showcasing product development project overview with completion status. It provides information regarding cash flow statements, completion progress, project overview and product approval status. Pitch your topic with ease and precision using this KPI Dashboard Showcasing Product Management Revenue Analysis Portrait PDF. This layout presents information on Completion Progress, Product Approval Status, Cash Flow Statements. It is also available for immediate download and adjustment. So, changes can be made in the color, design, graphics or any other component to create a unique layout.


Showcasing this set of slides titled Revenue And Expense Budget Deficit Analysis With KPI Dashboard Rules PDF. The topics addressed in these templates are Revenue And Expense, Budget Deficit Analysis. All the content presented in this PPT design is completely editable. Download it and make adjustments in color, background, font etc. as per your unique business setting.
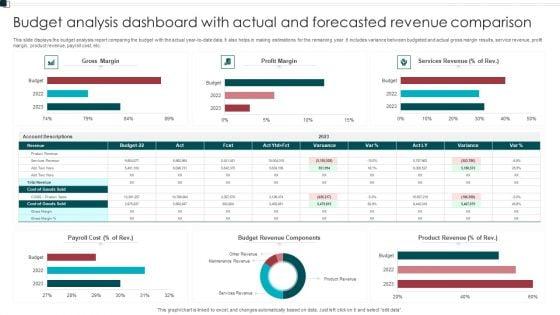

This slide displays the budget analysis report comparing the budget with the actual year to date data. It also helps in making estimations for the remaining year. It includes variance between budgeted and actual gross margin results, service revenue, profit margin, product revenue, payroll cost, etc. Pitch your topic with ease and precision using this Budget Analysis Dashboard With Actual And Forecasted Revenue Comparison Structure PDF. This layout presents information on Payroll Cost, Budget Revenue Components, Product Revenue. It is also available for immediate download and adjustment. So, changes can be made in the color, design, graphics or any other component to create a unique layout.
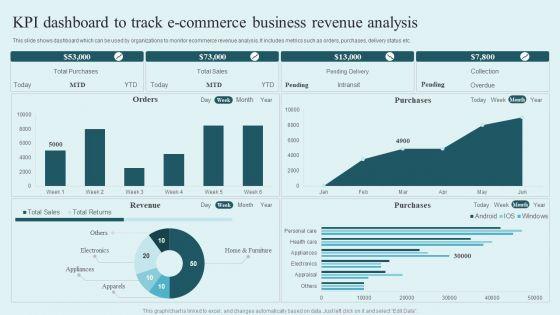
This slide shows dashboard which can be used by organizations to monitor ecommerce revenue analysis. It includes metrics such as orders, purchases, delivery status etc. Pitch your topic with ease and precision using this KPI Dashboard To Track E Commerce Business Revenue Analysis Rules PDF. This layout presents information on Total Purchases, Total Sales, Pending Delivery, Collection. It is also available for immediate download and adjustment. So, changes can be made in the color, design, graphics or any other component to create a unique layout.

This slide shows the key performance indicators dashboard which can be used to analyze current financial position of e-commerce business. It includes metrics such as revenue, expenses, profit, cash in hand, etc. Showcasing this set of slides titled KPI Dashboard To Monitor E Commerce Revenue Analysis Performance Mockup PDF. The topics addressed in these templates are Accounts Receivable, Accounts Payable, Revenue, Expenses. All the content presented in this PPT design is completely editable. Download it and make adjustments in color, background, font etc. as per your unique business setting.
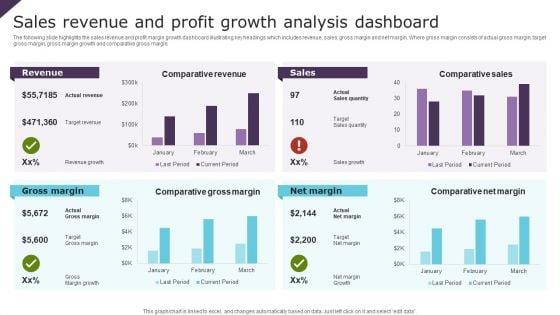

The following slide highlights the sales revenue and profit margin growth dashboard illustrating key headings which includes revenue, sales, gross margin and net margin. Where gross margin consists of actual gross margin, target gross margin, gross margin growth and comparative gross margin. Showcasing this set of slides titled Sales Revenue And Profit Growth Analysis Dashboard Ppt Portfolio Slide PDF. The topics addressed in these templates are Revenue, Sales, Gross Margin, Net Margin. All the content presented in this PPT design is completely editable. Download it and make adjustments in color, background, font etc. as per your unique business setting.
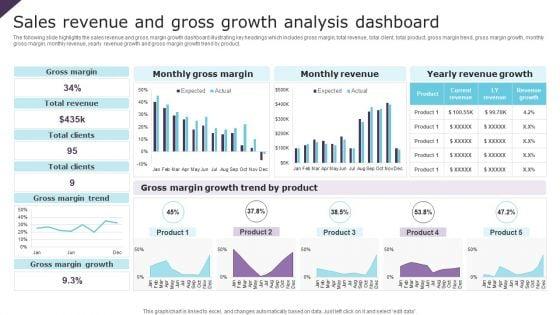

The following slide highlights the sales revenue and gross margin growth dashboard illustrating key headings which includes gross margin, total revenue, total client, total product, gross margin trend, gross margin growth, monthly gross margin, monthly revenue, yearly revenue growth and gross margin growth trend by product. Showcasing this set of slides titled Sales Revenue And Gross Growth Analysis Dashboard Ppt Inspiration Background Image PDF. The topics addressed in these templates are Gross Margin, Total Revenue, Total Clients. All the content presented in this PPT design is completely editable. Download it and make adjustments in color, background, font etc. as per your unique business setting.


The following slide highlights the revenue and margin growth analytics dashboard illustrating key headings which includes revenue, gross margin, gross margin growth, monthly revenue, monthly gross margin, monthly gross margin growth, gross margin by supplier and gross margin by channel. Pitch your topic with ease and precision using this Revenue And Growth Analysis Analytics Dashboard Ppt Infographic Template Brochure PDF. This layout presents information on Monthly Revenue, Monthly Gross Margin, Gross Margin Growth. It is also available for immediate download and adjustment. So, changes can be made in the color, design, graphics or any other component to create a unique layout.
This slide illustrates finance process dashboard indicating yearly revenue analysis which contains gross profit margin, operating profit ratio, net profit, revenue and cost of goods sold cogs operating expenses, etc. It can be referred by company owners who can compare it with previous years performance and make related decisions for future. Showcasing this set of slides titled Financial Procedure Dashboard Indicating Yearly Revenue Analysis Icons PDF. The topics addressed in these templates are Operating Profit Percentage, Net Profit Percentage, Operating Profit Ratio. All the content presented in this PPT design is completely editable. Download it and make adjustments in color, background, font etc. as per your unique business setting.
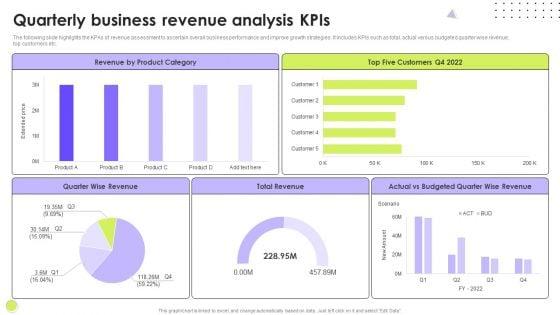

The following slide highlights the KPAs of revenue assessment to ascertain overall business performance and improve growth strategies. It includes KPIs such as total, actual versus budgeted quarter wise revenue, top customers etc. Showcasing this set of slides titled Quarterly Business Revenue Analysis Kpis Slides PDF. The topics addressed in these templates are Quarter Wise Revenue, Customers, Budgeted Quarter. All the content presented in this PPT design is completely editable. Download it and make adjustments in color, background, font etc. as per your unique business setting.
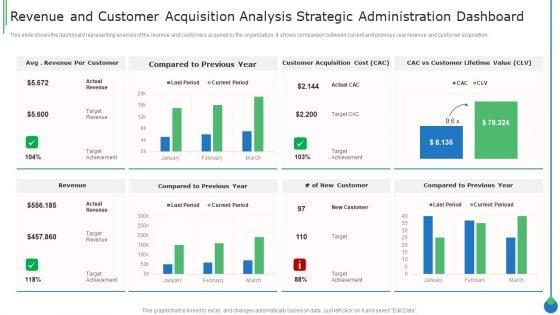
This slide shows the dashboard representing analysis of the revenue and customers acquired by the organization. It shows comparison between current and previous year revenue and customer acquisition.Pitch your topic with ease and precision using this Revenue And Customer Acquisition Analysis Strategic Administration Dashboard Clipart PDF This layout presents information on Revenue Customer, Compared Previous, Customer Acquisition It is also available for immediate download and adjustment. So, changes can be made in the color, design, graphics or any other component to create a unique layout.


This slide illustrates graphical representation of revenue of three brands. It includes weekly revenue line graphs and net promoter score by age of customers.Pitch your topic with ease and precision using this Brand Revenue Comparative Analysis With Net Promoter Score Dashboard Mockup PDF. This layout presents information on Brand Revenue Comparative Analysis With Net Promoter Score Dashboard. It is also available for immediate download and adjustment. So, changes can be made in the color, design, graphics or any other component to create a unique layout.

Following slide outlines a revenue analysis dashboard showcasing the business results after implementing marketing strategy. It provides information about total revenue for the month, revenue for year to date, revenue trend, product revenue and services revenue etc. Pitch your topic with ease and precision using this revenue analysis kpi dashboard post building marketing strategy infographics pdf. This layout presents information on revenue analysis kpi dashboard post building marketing strategy. It is also available for immediate download and adjustment. So, changes can be made in the color, design, graphics or any other component to create a unique layout.
Deliver and pitch your topic in the best possible manner with this business management dashboards revenue business analysis method ppt inspiration icon pdf. Use them to share invaluable insights on cost, revenue, acquisition, revenue, target and impress your audience. This template can be altered and modified as per your expectations. So, grab it now.
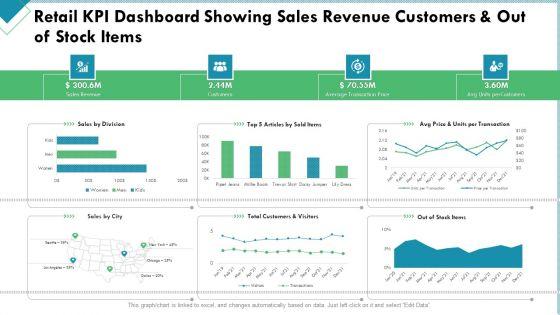

Deliver and pitch your topic in the best possible manner with this market analysis of retail sector retail kpi dashboard showing sales revenue customers and out of stock items structure pdf. Use them to share invaluable insights on sales revenue, customers, average transaction price and impress your audience. This template can be altered and modified as per your expectations. So, grab it now.
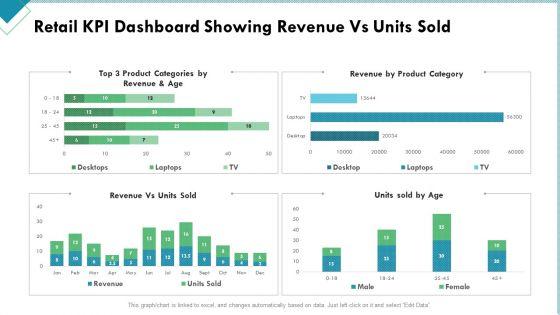

Deliver an awe inspiring pitch with this creative market analysis of retail sector retail kpi dashboard showing revenue vs units sold clipart pdf bundle. Topics like retail kpi dashboard showing revenue vs units sold can be discussed with this completely editable template. It is available for immediate download depending on the needs and requirements of the user.


Deliver and pitch your topic in the best possible manner with this substructure segment analysis infrastructure kpi dashboard showing project revenue summary pdf. Use them to share invaluable insights on square meter price, dollars per employee, net project revenue per employee and impress your audience. This template can be altered and modified as per your expectations. So, grab it now.
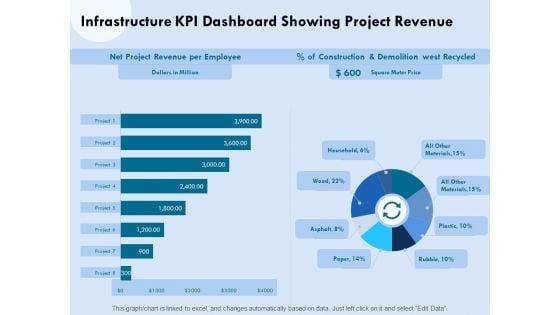

Presenting this set of slides with name functional analysis of business operations infrastructure kpi dashboard showing project revenue clipart pdf. The topics discussed in these slides are revenue, project, employee, construction, price. This is a completely editable PowerPoint presentation and is available for immediate download. Download now and impress your audience.


Presenting Sales Revenue And Profit Growth Analysis Dashboard Icon Ppt Outline Mockup PDF to dispense important information. This template comprises three stages. It also presents valuable insights into the topics including Sales, Revenue And Profit, Growth Analysis, Dashboard Icon. This is a completely customizable PowerPoint theme that can be put to use immediately. So, download it and address the topic impactfully.
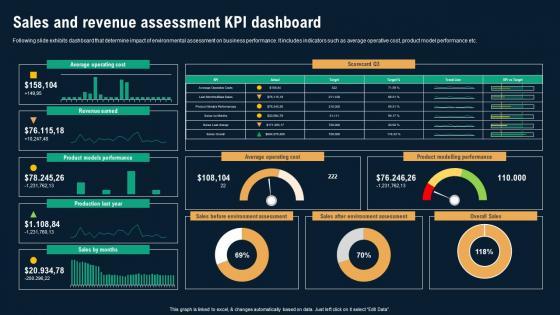
Following slide exhibits dashboard that determine impact of environmental assessment on business performance. It includes indicators such as average operative cost, product model performance etc. There are so many reasons you need a Sales And Revenue Assessment KPI Dashboard Business Environmental Analysis Ideas Pdf The first reason is you can not spend time making everything from scratch, Thus, Slidegeeks has made presentation templates for you too. You can easily download these templates from our website easily. Following slide exhibits dashboard that determine impact of environmental assessment on business performance. It includes indicators such as average operative cost, product model performance etc.


This slide showcases dashboard that can help restaurant to keep track revenue generated from food and beverages. Its key elements are revenue by location, top expenses, revenue by type etc. Are you in need of a template that can accommodate all of your creative concepts This one is crafted professionally and can be altered to fit any style. Use it with Google Slides or PowerPoint. Include striking photographs, symbols, depictions, and other visuals. Fill, move around, or remove text boxes as desired. Test out color palettes and font mixtures. Edit and save your work, or work with colleagues. Download Coffeehouse Promotion Techniques To Boost Revenue Food And Beverages Revenue Analysis Dashboard Inspiration PDF and observe how to make your presentation outstanding. Give an impeccable presentation to your group and make your presentation unforgettable.
27 Item(s)