- Sign up
- Sign In
 AI PPT Maker
 Templates
 PPT Bundles
 Design Services
 Business PPTs
 Business Plan
 Management
 Strategy
 Introduction PPT
 Roadmap
 Self Introduction
 Timelines
 Process
 Marketing
 Agenda
 Technology
 Medical
 Startup Business Plan
 Cyber Security
 Dashboards
 SWOT
SWOT Proposals
 Education
 Pitch Deck
 Digital Marketing
 KPIs
KPIs Project Management
 Product Management
 Artificial Intelligence
 Target Market
 Communication
 Supply Chain
 Google Slides
 Research Services
 One Pagers
 All Categories
Research analytics PowerPoint Presentation Templates and Google Slides
30 Item(s)
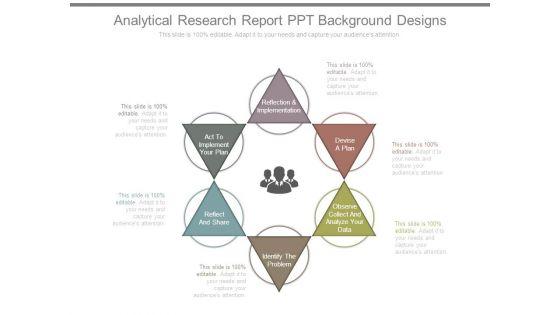


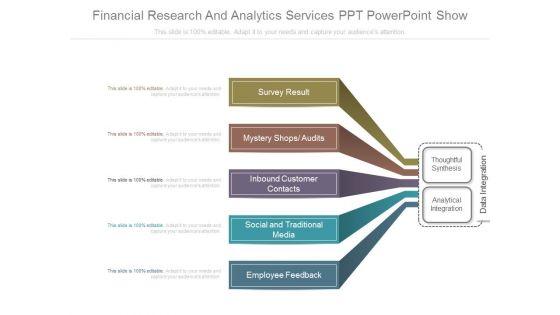


This is a financial research and analytics services ppt powerpoint show. This is a five stage process. The stages in this process are survey result, mystery shops audits, inbound customer contacts, social and traditional media, employee feedback, thoughtful synthesis, analytical integration, data integration.
Presenting this set of slides with name business research and analytics vector icon ppt powerpoint presentation professional show. This is a three stage process. The stages in this process are data visualization icon, research analysis, business focus. This is a completely editable PowerPoint presentation and is available for immediate download. Download now and impress your audience.


The following slide outlines key performance indicator KPI dashboard that can assist marketers to evaluate brand performance on social media channels. The metrics covered are age group, gender, brand perception, branding themes, celebrity analysis, etc. Boost your pitch with our creative Creating Positioning Techniques For Market Research Brand Analytics Kpi Dashboard For Organization Slides PDF. Deliver an awe-inspiring pitch that will mesmerize everyone. Using these presentation templates you will surely catch everyones attention. You can browse the ppts collection on our website. We have researchers who are experts at creating the right content for the templates. So you do not have to invest time in any additional work. Just grab the template now and use them.

The following slide outlines key performance indicator KPI dashboard that can assist marketers to evaluate brand performance on social media channels. The metrics covered are age group, gender, brand perception, branding themes, celebrity analysis, etc. Do you have an important presentation coming up Are you looking for something that will make your presentation stand out from the rest Look no further than Market Research Assessment Of Target Market Requirements Brand Analytics Kpi Dashboard For Organization Clipart PDF. With our professional designs, you can trust that your presentation will pop and make delivering it a smooth process. And with Slidegeeks, you can trust that your presentation will be unique and memorable. So why wait Grab Market Research Assessment Of Target Market Requirements Brand Analytics Kpi Dashboard For Organization Clipart PDF today and make your presentation stand out from the rest.
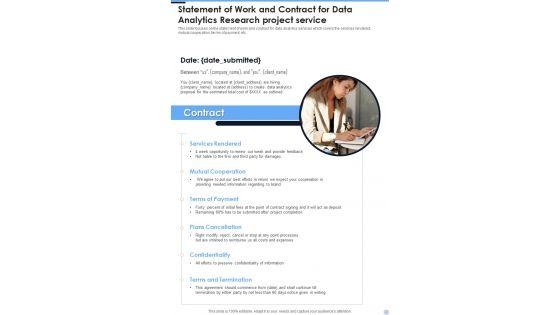

Presenting you an exemplary Statement Of Work And Contract For Data Analytics Research Project Service One Pager Sample Example Document. Our one-pager comprises all the must-have essentials of an inclusive document. You can edit it with ease, as its layout is completely editable. With such freedom, you can tweak its design and other elements to your requirements. Download this Statement Of Work And Contract For Data Analytics Research Project Service One Pager Sample Example Document brilliant piece now.
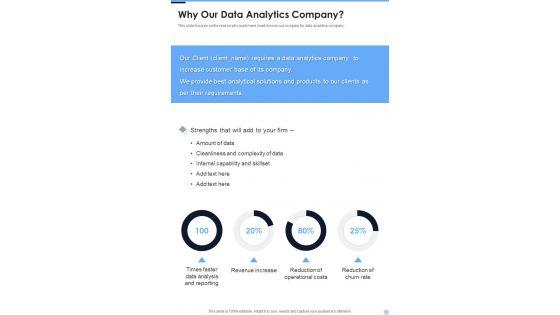
Presenting you an exemplary Proposal For Data Analysis In Research Project Why Our Data Analytics Company One Pager Sample Example Document. Our one-pager comprises all the must-have essentials of an inclusive document. You can edit it with ease, as its layout is completely editable. With such freedom, you can tweak its design and other elements to your requirements. Download this Proposal For Data Analysis In Research Project Why Our Data Analytics Company One Pager Sample Example Document brilliant piece now.
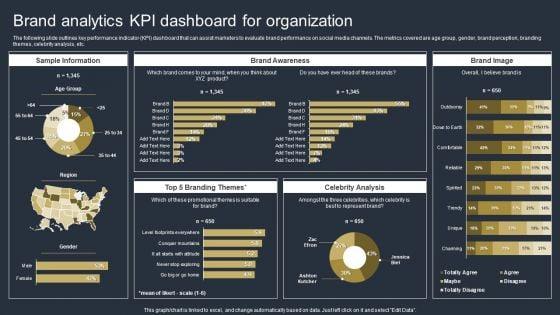

The following slide outlines key performance indicator KPI dashboard that can assist marketers to evaluate brand performance on social media channels. The metrics covered are age group, gender, brand perception, branding themes, celebrity analysis, etc. From laying roadmaps to briefing everything in detail, our templates are perfect for you. You can set the stage with your presentation slides. All you have to do is download these easy-to-edit and customizable templates. Comprehensive Market Research Guide Brand Analytics Kpi Dashboard For Organization Brochure PDF will help you deliver an outstanding performance that everyone would remember and praise you for. Do download this presentation today.


This slide shows visual analytics, the last branch of visualization research, which emerged from the advancements in the other two branches and mainly focused on analytical reasoning.Presenting Departments Of Visualization Research Visual Analytics Branch Of Visualization Research Information PDF to provide visual cues and insights. Share and navigate important information on five stages that need your due attention. This template can be used to pitch topics like Information Visualization, Advancements In Scientific, Interactive Visual Interface In addtion, this PPT design contains high resolution images, graphics, etc, that are easily editable and available for immediate download.


This slide shows visual analytics, the last branch of visualization research, which emerged from the advancements in the other two branches and mainly focused on analytical reasoning. This is a graphical representation of research it visual analytics branch background pdf template with various stages. Focus and dispense information on five stages using this creative set, that comes with editable features. It contains large content boxes to add your information on topics like visual analytics branch of visualization research. You can also showcase facts, figures, and other relevant content using this PPT layout. Grab it now.


Presenting key skills of research analyst with strong analytical mind ppt powerpoint presentation slides design inspiration pdf. to dispense important information. This template comprises three stages. It also presents valuable insights into the topics including research analyst primary skills, strong analytical mind, ability to notice patterns within statistics excellent communication skills, accuracy. This is a completely customizable PowerPoint theme that can be put to use immediately. So, download it and address the topic impactfully.


Presenting this set of slides with name customer facts report with market research and analytics ppt powerpoint presentation file graphics pdf. This is a eight stage process. The stages in this process are market intelligence, customer complaints, customer enquiries, customer analytics, market research, service staff feedback, sales staff feedback, competitive information. This is a completely editable PowerPoint presentation and is available for immediate download. Download now and impress your audience.
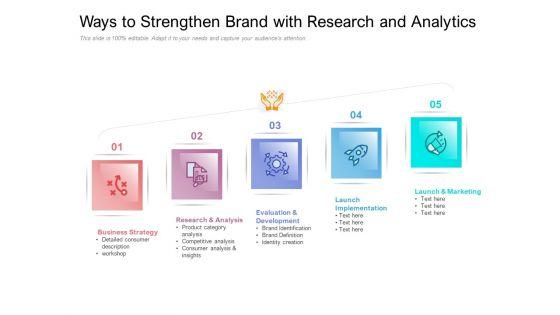
Presenting this set of slides with name ways to strengthen brand with research and analytics ppt powerpoint presentation file styles pdf. This is a five stage process. The stages in this process are strategy, analysis, development. This is a completely editable PowerPoint presentation and is available for immediate download. Download now and impress your audience.
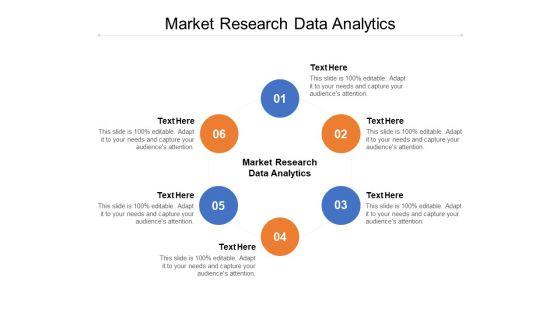
Presenting this set of slides with name market research data analytics ppt powerpoint presentation file ideas cpb. This is an editable Powerpoint six stages graphic that deals with topics like market research data analytics to help convey your message better graphically. This product is a premium product available for immediate download and is 100 percent editable in Powerpoint. Download this now and use it in your presentations to impress your audience.


The following slide illustrates process to execute search engine optimization SEO strategy to boost campaign results and add target keywords. It includes elements such as analyze relevant topics searchers intent, research associated terms, tool etc. This Guide For Marketing Analytics To Improve Decisions Steps To Implement SEO Keywords Research Technique Graphics PDF is perfect for any presentation, be it in front of clients or colleagues. It is a versatile and stylish solution for organizing your meetings. The Guide For Marketing Analytics To Improve Decisions Steps To Implement SEO Keywords Research Technique Graphics PDF features a modern design for your presentation meetings. The adjustable and customizable slides provide unlimited possibilities for acing up your presentation. Slidegeeks has done all the homework before launching the product for you. So, do not wait, grab the presentation templates today
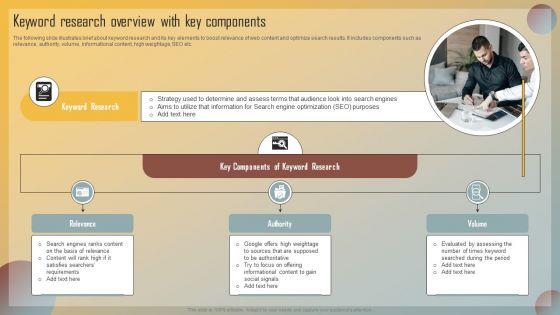
The following slide illustrates brief about keyword research and its key elements to boost relevance of web content and optimize search results. It includes components such as relevance, authority, volume, informational content, high weightage, SEO etc. Crafting an eye catching presentation has never been more straightforward. Let your presentation shine with this tasteful yet straightforward Guide For Marketing Analytics To Improve Decisions Keyword Research Overview With Key Components Guidelines PDF template. It offers a minimalistic and classy look that is great for making a statement. The colors have been employed intelligently to add a bit of playfulness while still remaining professional. Construct the ideal Guide For Marketing Analytics To Improve Decisions Keyword Research Overview With Key Components Guidelines PDF that effortlessly grabs the attention of your audience. Begin now and be certain to wow your customers.

This slide shows visual analytics, the last branch of visualization research, which emerged from the advancements in the other two branches and mainly focused on analytical reasoning. Want to ace your presentation in front of a live audience Our Branches For Visual Analytics Branch Of Visualization Research And Development Slides PDF can help you do that by engaging all the users towards you. Slidegeeks experts have put their efforts and expertise into creating these impeccable powerpoint presentations so that you can communicate your ideas clearly. Moreover, all the templates are customizable, and easy-to-edit and downloadable. Use these for both personal and commercial use.
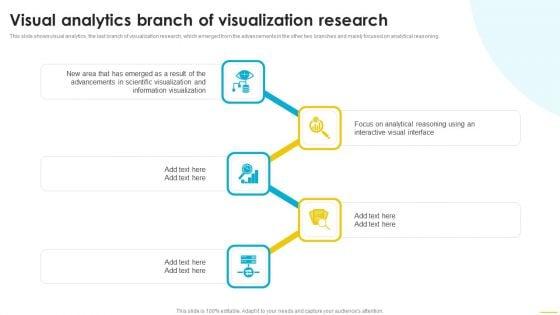
This slide shows visual analytics, the last branch of visualization research, which emerged from the advancements in the other two branches and mainly focused on analytical reasoning. Make sure to capture your audiences attention in your business displays with our gratis customizable Data And Information Visualization Visual Analytics Branch Of Visualization Research Designs PDF. These are great for business strategies, office conferences, capital raising or task suggestions. If you desire to acquire more customers for your tech business and ensure they stay satisfied, create your own sales presentation with these plain slides.
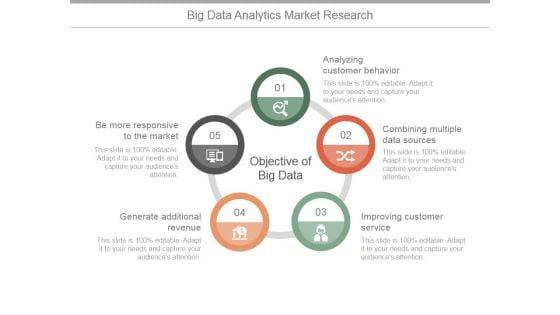
Presenting Customer Behavior Market Research Analytics Icon Ppt Outline Model PDF to dispense important information. This template comprises four stages. It also presents valuable insights into the topics including Customer Behavior, Market Research, Analytics Icon. This is a completely customizable PowerPoint theme that can be put to use immediately. So, download it and address the topic impactfully.


The following slide outlines key performance indicator KPI dashboard that can assist marketers to evaluate brand performance on social media channels. The metrics covered are age group, gender, brand perception, branding themes, celebrity analysis, etc. Present like a pro with Steps To Effectively Conduct Market Research Brand Analytics KPI Dashboard For Organization Template PDF Create beautiful presentations together with your team, using our easy to use presentation slides. Share your ideas in real time and make changes on the fly by downloading our templates. So whether you are in the office, on the go, or in a remote location, you can stay in sync with your team and present your ideas with confidence. With Slidegeeks presentation got a whole lot easier. Grab these presentations today.


The following slide outlines key performance indicator KPI dashboard that can assist marketers to evaluate brand performance on social media channels. The metrics covered are age group, gender, brand perception, branding themes, celebrity analysis, etc. There are so many reasons you need a Market Research To Determine Business Opportunities Brand Analytics KPI Dashboard For Organization Inspiration PDF. The first reason is you cannot spend time making everything from scratch, Thus, Slidegeeks has made presentation templates for you too. You can easily download these templates from our website easily.

This slide represents uses of social media analytics in product research. This includes establish business goal, select platform, sentiment analysis automation, break data silos, etc. Showcasing this set of slides titled Social Media Analytics Use For Product Research Clipart Pdf. The topics addressed in these templates are Establish Business Goal, Sentiment Analysis Automation, Sustain The Benefits. All the content presented in this PPT design is completely editable. Download it and make adjustments in color, background, font etc. as per your unique business setting. This slide represents uses of social media analytics in product research. This includes establish business goal, select platform, sentiment analysis automation, break data silos, etc.

The following slide showcases the vendor selection criteria for market analysis which can assist corporates to select trusted partner. The benchmark is done on the basis of total cost of ownership, ease of use, and data export. From laying roadmaps to briefing everything in detail, our templates are perfect for you. You can set the stage with your presentation slides. All you have to do is download these easy-to-edit and customizable templates. IT Industry Market Research Evaluation Criteria To Select Marketing Analytics Software Summary Pdf will help you deliver an outstanding performance that everyone would remember and praise you for. Do download this presentation today. The following slide showcases the vendor selection criteria for market analysis which can assist corporates to select trusted partner. The benchmark is done on the basis of total cost of ownership, ease of use, and data export.

The following slide highlights the reporting and analytics services offered by Pureprofile. It provides advanced data cleaning, data weighting, RIM weighting and verbatim coding Find a pre-designed and impeccable Analytics Services Marketing Research Services Management Business Summary Pdf. The templates can ace your presentation without additional effort. You can download these easy-to-edit presentation templates to make your presentation stand out from others. So, what are you waiting for Download the template from Slidegeeks today and give a unique touch to your presentation. The following slide highlights the reporting and analytics services offered by Pureprofile. It provides advanced data cleaning, data weighting, RIM weighting and verbatim coding
Persuade your audience using this Worldwide Market Research And Analytics Icon Themes PDF. This PPT design covers three stages, thus making it a great tool to use. It also caters to a variety of topics including Worldwide Market, Research, Analytics. Download this PPT design now to present a convincing pitch that not only emphasizes the topic but also showcases your presentation skills.
30 Item(s)