- Sign up
- Sign In
 AI PPT Maker
 Templates
 PPT Bundles
 Design Services
 Business PPTs
 Business Plan
 Management
 Strategy
 Introduction PPT
 Roadmap
 Self Introduction
 Timelines
 Process
 Marketing
 Agenda
 Technology
 Medical
 Startup Business Plan
 Cyber Security
 Dashboards
 SWOT
SWOT Proposals
 Education
 Pitch Deck
 Digital Marketing
 KPIs
KPIs Project Management
 Product Management
 Artificial Intelligence
 Target Market
 Communication
 Supply Chain
 Google Slides
 Research Services
 One Pagers
 All Categories
Process for data analysis PowerPoint Presentation Templates and Google Slides
22 Item(s)


This slide shows the data exploration process in detail that can be used to bring out the basic understanding of the real time data into data analytics. This is a effective data arrangement for data accessibility and processing readiness data exploration process in detail analysis ideas pdf template with various stages. Focus and dispense information on four stages using this creative set, that comes with editable features. It contains large content boxes to add your information on topics like treatment, outlier treatment, variable transformation. You can also showcase facts, figures, and other relevant content using this PPT layout. Grab it now.
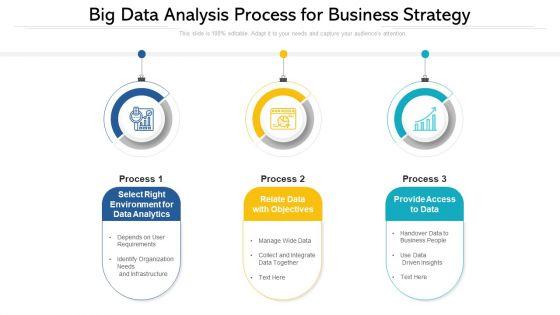

Persuade your audience using this big data analysis process for business strategy diagrams pdf.This PPT design covers three stages, thus making it a great tool to use. It also caters to a variety of topics including select right environment for data analytics, relate data with objectives, provide access to data. Download this PPT design now to present a convincing pitch that not only emphasizes the topic but also showcases your presentation skills.

We present our quarterly data collection roadmap for trimonthly by trimonthly analysis process information. This PowerPoint layout is easy to edit so you can change the font size, font type, color, and shape conveniently. In addition to this, the PowerPoint layout is Google Slides compatible, so you can share it with your audience and give them access to edit it. Therefore, download and save this well researched quarterly data collection roadmap for trimonthly by trimonthly analysis process information in different formats like PDF, PNG, and JPG to smoothly execute your business plan.
Persuade your audience using this system process for data analysis vector icon ppt powerpoint presentation file picture pdf. This PPT design covers two stages, thus making it a great tool to use. It also caters to a variety of topics including system process for data analysis vector icon. Download this PPT design now to present a convincing pitch that not only emphasizes the topic but also showcases your presentation skills.


This slide represents the extraction process for data lineage from start to end. The steps include reading referenced entities, using grammar provider, retrieving entity schemas, using schema provider, and parsing SQL queries and lineage. Explore a selection of the finest Comprehensive Analysis Of Different Data Lineage Classification Extraction Process For Data Lineage Designs PDF here. With a plethora of professionally designed and pre-made slide templates, you can quickly and easily find the right one for your upcoming presentation. You can use our Comprehensive Analysis Of Different Data Lineage Classification Extraction Process For Data Lineage Designs PDF to effectively convey your message to a wider audience. Slidegeeks has done a lot of research before preparing these presentation templates. The content can be personalized and the slides are highly editable. Grab templates today from Slidegeeks.

This template shows the RPA data analysis management process. The purpose of this slide will aid stakeholders in understanding and assessing the effect of automation on their business and the ROI. It includes such as repetitive task, extracting, mass emailing, etc. Presenting Robotic Process Automation Solutions Management Process For Data Analysis Clipart PDF to dispense important information. This template comprises six stages. It also presents valuable insights into the topics including Robotic Process Automation, Solutions Management, Process For Data Analysis. This is a completely customizable PowerPoint theme that can be put to use immediately. So, download it and address the topic impactfully.
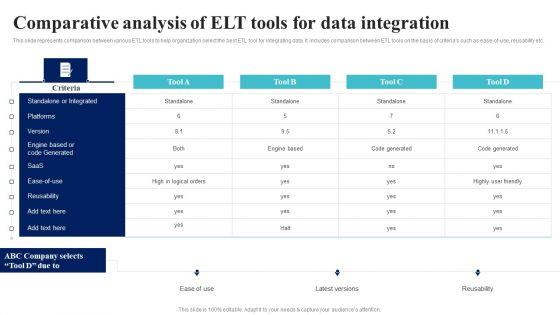
This slide represents comparison between various ETL tools to help organization select the best ETL tool for integrating data. It includes comparison between ETL tools on the basis of criterias such as ease-of-use, reusability etc.If your project calls for a presentation, then Slidegeeks is your go-to partner because we have professionally designed, easy-to-edit templates that are perfect for any presentation. After downloading, you can easily edit BI Implementation To Enhance Hiring Process Comparative Analysis Of Elt Tools For Data Integration Ideas PDF and make the changes accordingly. You can rearrange slides or fill them with different images. Check out all the handy templates.
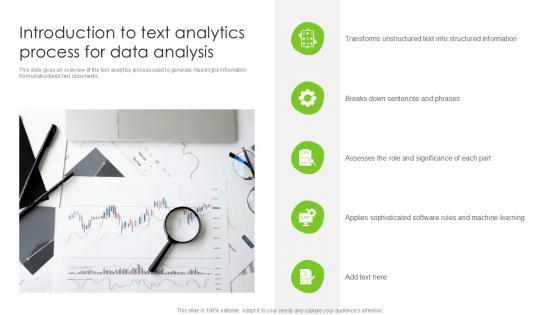
This slide gives an overview of the text analytics process used to generate meaningful information from unstructured text documents. The best PPT templates are a great way to save time, energy, and resources. Slidegeeks have 100 percent editable powerpoint slides making them incredibly versatile. With these quality presentation templates, you can create a captivating and memorable presentation by combining visually appealing slides and effectively communicating your message. Download Introduction To Text Analytics Process For Data Analysis PPT Example SS from Slidegeeks and deliver a wonderful presentation. This slide gives an overview of the text analytics process used to generate meaningful information from unstructured text documents.
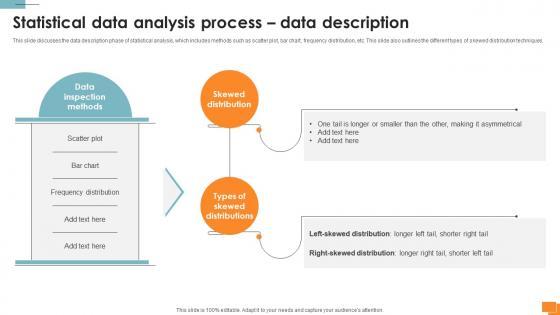
This slide discusses the data description phase of statistical analysis, which includes methods such as scatter plot, bar chart, frequency distribution, etc. This slide also outlines the different types of skewed distribution techniques. Do you have to make sure that everyone on your team knows about any specific topic I yes, then you should give Statistical Tools For Evidence Statistical Data Analysis Process Data Description a try. Our experts have put a lot of knowledge and effort into creating this impeccable Statistical Tools For Evidence Statistical Data Analysis Process Data Description. You can use this template for your upcoming presentations, as the slides are perfect to represent even the tiniest detail. You can download these templates from the Slidegeeks website and these are easy to edit. So grab these today This slide discusses the data description phase of statistical analysis, which includes methods such as scatter plot, bar chart, frequency distribution, etc. This slide also outlines the different types of skewed distribution techniques.
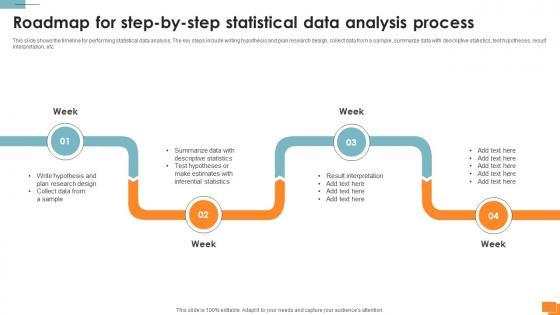
This slide shows the timeline for performing statistical data analysis. The key steps include writing hypothesis and plan research design, collect data from a sample, summarize data with descriptive statistics, test hypotheses, result interpretation, etc. This Statistical Tools For Evidence Roadmap For Step By Step Statistical Data Analysis Process from Slidegeeks makes it easy to present information on your topic with precision. It provides customization options, so you can make changes to the colors, design, graphics, or any other component to create a unique layout. It is also available for immediate download, so you can begin using it right away. Slidegeeks has done good research to ensure that you have everything you need to make your presentation stand out. Make a name out there for a brilliant performance. This slide shows the timeline for performing statistical data analysis. The key steps include writing hypothesis and plan research design, collect data from a sample, summarize data with descriptive statistics, test hypotheses, result interpretation, etc.

This slide discusses the study designing phase of statistical data analysis. The purpose of this slide is to outline the statistical tests used in different research designs, such as descriptive design, correlational design, and experimental design. Slidegeeks is one of the best resources for PowerPoint templates. You can download easily and regulate A135 Statistical Tools For Evidence Statistical Data Analysis Process Study Designing for your personal presentations from our wonderful collection. A few clicks is all it takes to discover and get the most relevant and appropriate templates. Use our Templates to add a unique zing and appeal to your presentation and meetings. All the slides are easy to edit and you can use them even for advertisement purposes. This slide discusses the study designing phase of statistical data analysis. The purpose of this slide is to outline the statistical tests used in different research designs, such as descriptive design, correlational design, and experimental design.
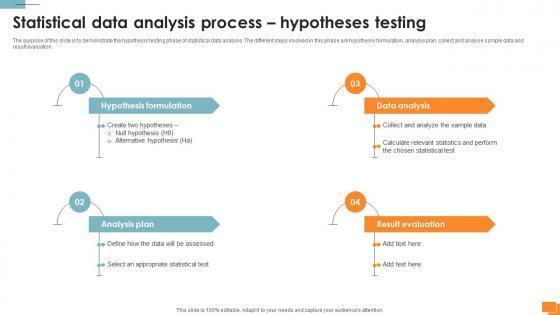
The purpose of this slide is to demonstrate the hypothesis testing phase of statistical data analysis. The different steps involved in this phase are hypothesis formulation, analysis plan, collect and analyse sample data and result evaluation. Create an editable A134 Statistical Tools For Evidence Statistical Data Analysis Process Hypotheses Testing that communicates your idea and engages your audience. Whether you are presenting a business or an educational presentation, pre-designed presentation templates help save time. A134 Statistical Tools For Evidence Statistical Data Analysis Process Hypotheses Testing is highly customizable and very easy to edit, covering many different styles from creative to business presentations. Slidegeeks has creative team members who have crafted amazing templates. So, go and get them without any delay. The purpose of this slide is to demonstrate the hypothesis testing phase of statistical data analysis. The different steps involved in this phase are hypothesis formulation, analysis plan, collect and analyse sample data and result evaluation.
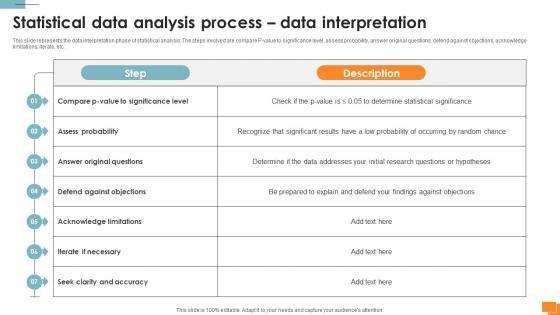
This slide represents the data interpretation phase of statistical analysis. The steps involved are compare P-value to significance level, assess probability, answer original questions, defend against objections, acknowledge limitations, iterate, etc. Boost your pitch with our creative A133 Statistical Tools For Evidence Statistical Data Analysis Process Data Interpretation. Deliver an awe-inspiring pitch that will mesmerize everyone. Using these presentation templates you will surely catch everyones attention. You can browse the ppts collection on our website. We have researchers who are experts at creating the right content for the templates. So you do not have to invest time in any additional work. Just grab the template now and use them. This slide represents the data interpretation phase of statistical analysis. The steps involved are compare P-value to significance level, assess probability, answer original questions, defend against objections, acknowledge limitations, iterate, etc.
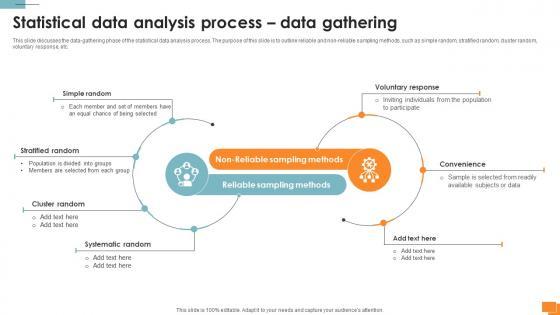
This slide discusses the data-gathering phase of the statistical data analysis process. The purpose of this slide is to outline reliable and non-reliable sampling methods, such as simple random, stratified random, cluster random, voluntary response, etc. Find a pre-designed and impeccable A132 Statistical Tools For Evidence Statistical Data Analysis Process Data Gathering. The templates can ace your presentation without additional effort. You can download these easy-to-edit presentation templates to make your presentation stand out from others. So, what are you waiting for Download the template from Slidegeeks today and give a unique touch to your presentation. This slide discusses the data-gathering phase of the statistical data analysis process. The purpose of this slide is to outline reliable and non-reliable sampling methods, such as simple random, stratified random, cluster random, voluntary response, etc.

This template highlights the prescriptive analysis tools that emphasize actionable insights . It include key analysis tools with their ,features, free trail, pros and cons ,pricing and user review. Pitch your topic with ease and precision using this Prescriptive Analysis Tool For Data Process Information PDF. This layout presents information on Data Visualization, Visualization Capabilities, Automated Workflows. It is also available for immediate download and adjustment. So, changes can be made in the color, design, graphics or any other component to create a unique layout.

This slide showcases the data cleaning tips and techniques for optimum analysis and outcomes. It includes various steps such as remove irrelevant data, deduplicate data, data validation, fix structural errors, filter out data outliers and deal with missing data. Presenting Data Cleaning Process For Successful Analysis Diagrams PDF to dispense important information. This template comprises six stages. It also presents valuable insights into the topics including Filter Out Data Outliers, Data Validation, Remove Irrelevant Data. This is a completely customizable PowerPoint theme that can be put to use immediately. So, download it and address the topic impactfully.

This template showcases the data collection method to visualize organisation decision making. It includes various methods such as surveys, transactional tracking, focus groups, observation and monitor social media. Presenting Analysis Of Data Collection Process For Establish Business Value Formats PDF to dispense important information. This template comprises five stages. It also presents valuable insights into the topics including Monitor Social Media, Observation, Transactional Tracking. This is a completely customizable PowerPoint theme that can be put to use immediately. So, download it and address the topic impactfully.
22 Item(s)