- Sign up
- Sign In
 AI PPT Maker
 Templates
 PPT Bundles
 Design Services
 Business PPTs
 Business Plan
 Management
 Strategy
 Introduction PPT
 Roadmap
 Self Introduction
 Timelines
 Process
 Marketing
 Agenda
 Technology
 Medical
 Startup Business Plan
 Cyber Security
 Dashboards
 SWOT
SWOT Proposals
 Education
 Pitch Deck
 Digital Marketing
 KPIs
KPIs Project Management
 Product Management
 Artificial Intelligence
 Target Market
 Communication
 Supply Chain
 Google Slides
 Research Services
 One Pagers
 All Categories
Operational result PowerPoint Presentation Templates and Google Slides
19 Item(s)
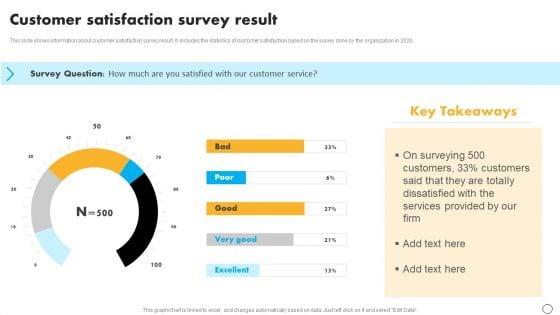
This slide shows information about customer satisfaction survey result. It includes the statistics of customer satisfaction based on the survey done by the organization in 2020. From laying roadmaps to briefing everything in detail, our templates are perfect for you. You can set the stage with your presentation slides. All you have to do is download these easy to edit and customizable templates. Retail Business Optimization Through Operational Excellence Strategy Customer Satisfaction Survey Result Ideas PDF will help you deliver an outstanding performance that everyone would remember and praise you for. Do download this presentation today.


The following slide outlines a comprehensive dashboard depicting the business process automation BPA results in the supply chain. Information covered in the slide is related to average order processing days, average shipping days, etc.Deliver and pitch your topic in the best possible manner with this KPI Dashboard Highlighting Automation Results In Supply Achieving Operational Efficiency Graphics PDF. Use them to share invaluable insights on Orders Progress, Late Deliveries, Deliveries Warehouse and impress your audience. This template can be altered and modified as per your expectations. So, grab it now.


Showcasing this set of slides titled Dashboard Survey Response Results KPI Report For Mobile Operating System Designs PDF. The topics addressed in these templates are Operating System, Survey Results, Completed Survey. All the content presented in this PPT design is completely editable. Download it and make adjustments in color, background, font etc. as per your unique business setting.

Mentioned slide displays the results of assessment questionnaire along with key considerations about the AI technology. It also showcases information about the capabilities of AI approach.This is a Artificial Intelligence For IT Operations Playbook Stage One Questionnaire Results And Key Considerations Ideas PDF template with various stages. Focus and dispense information on five stages using this creative set, that comes with editable features. It contains large content boxes to add your information on topics like Incremental Gains, Enhanced Experience, Demonstrating Capabilities You can also showcase facts, figures, and other relevant content using this PPT layout. Grab it now.
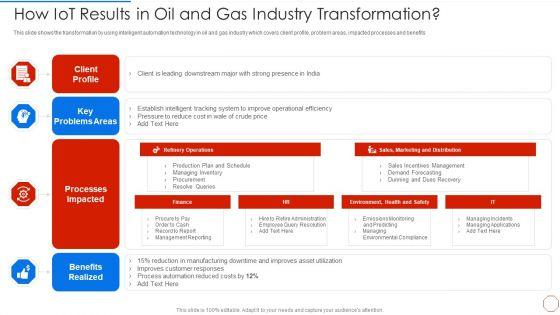

This slide shows the transformation by using intelligent automation technology in oil and gas industry which covers client profile, problem areas, impacted processes and benefits. Deliver an awe inspiring pitch with this creative minimizing operational cost through iot virtual twins implementation how iot results in oil inspiration pdf bundle. Topics like cost, system, price, key problems areas can be discussed with this completely editable template. It is available for immediate download depending on the needs and requirements of the user.

Deliver and pitch your topic in the best possible manner with this table of contents for manufacturing and operation quality improvement practices tools and templates results infographics pdf. Use them to share invaluable insights on objectives and key results, six sigma, theory of constraints, zero defects, value stream mapping and impress your audience. This template can be altered and modified as per your expectations. So, grab it now.
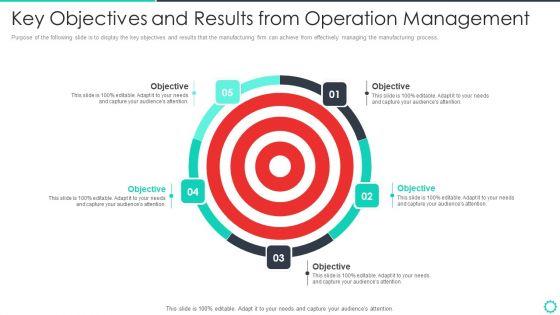

Purpose of the following slide is to display the key objectives and results that the manufacturing firm can achieve from effectively managing the manufacturing process. Presenting manufacturing operation quality improvement practices tools templates key objectives and results pictures pdf to provide visual cues and insights. Share and navigate important information on five stages that need your due attention. This template can be used to pitch topics like key objectives and results from operation management. In addtion, this PPT design contains high resolution images, graphics, etc, that are easily editable and available for immediate download.
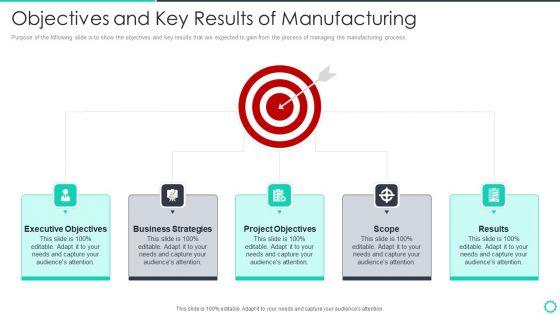
Purpose of the following slide is to show the objectives and key results that are expected to gain from the process of managing the manufacturing process. Presenting manufacturing operation quality improvement practices tools templates objectives and key results of manufacturing information pdf to provide visual cues and insights. Share and navigate important information on five stages that need your due attention. This template can be used to pitch topics like executive objectives, business strategies, project objectives, scope, results. In addtion, this PPT design contains high resolution images, graphics, etc, that are easily editable and available for immediate download.
Persuade your audience using this executive with operational capabilities for quality results vector icon ppt powerpoint presentation model picture pdf. This PPT design covers three stages, thus making it a great tool to use. It also caters to a variety of topics including executive with operational capabilities for quality results vector icon. Download this PPT design now to present a convincing pitch that not only emphasizes the topic but also showcases your presentation skills.


Persuade your audience using this Key Business Operation Drivers Icon To Achieve Result Ppt Model Inspiration PDF. This PPT design covers three stages, thus making it a great tool to use. It also caters to a variety of topics including Key Business, Operation Drivers,Icon, To Achieve Result. Download this PPT design now to present a convincing pitch that not only emphasizes the topic but also showcases your presentation skills.
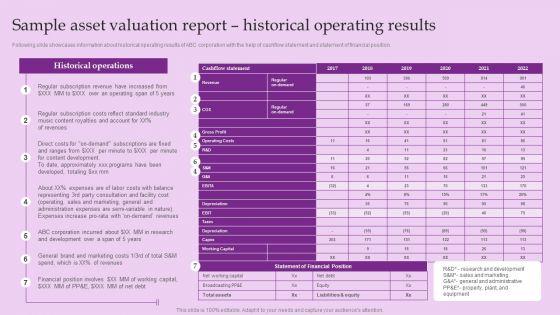
Following slide showcases information about historical operating results of ABC corporation with the help of cashflow statement and statement of financial position.Find highly impressive Sample Asset Valuation Report Historical Operating Results Brand And Equity Evaluation Techniques Infographics PDF on Slidegeeks to deliver a meaningful presentation. You can save an ample amount of time using these presentation templates. No need to worry to prepare everything from scratch because Slidegeeks experts have already done a huge research and work for you. You need to download Sample Asset Valuation Report Historical Operating Results Brand And Equity Evaluation Techniques Infographics PDF for your upcoming presentation. All the presentation templates are 100 precent editable and you can change the color and personalize the content accordingly. Download now.
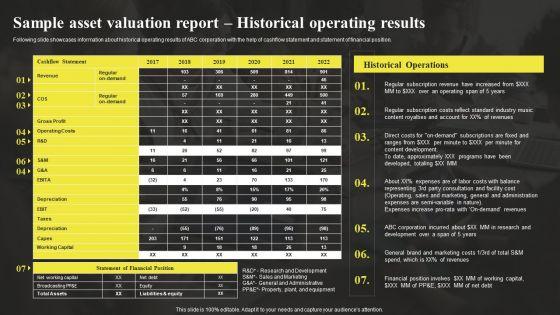
Following slide showcases information about historical operating results of ABC corporation with the help of cashflow statement and statement of financial position.Present like a pro with Sample Asset Valuation Report Historical Operating Results Sample Asset Valuation Summary Diagrams PDF Create beautiful presentations together with your team, using our easy-to-use presentation slides. Share your ideas in real-time and make changes on the fly by downloading our templates. So whether you are in the office, on the go, or in a remote location, you can stay in sync with your team and present your ideas with confidence. With Slidegeeks presentation got a whole lot easier. Grab these presentations today.

This slide focuses on performance indicators to measure business results such as customer satisfaction, market share, customer retention, employee turnover, cycle time, etc. Explore a selection of the finest BPR To Develop Operational Effectiveness Performance Indicators To Measure Business Results Structure PDF here. With a plethora of professionally designed and pre made slide templates, you can quickly and easily find the right one for your upcoming presentation. You can use our BPR To Develop Operational Effectiveness Performance Indicators To Measure Business Results Structure PDF to effectively convey your message to a wider audience. Slidegeeks has done a lot of research before preparing these presentation templates. The content can be personalized and the slides are highly editable. Grab templates today from Slidegeeks.
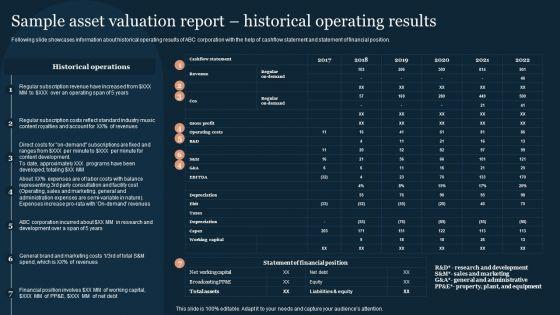
Following slide showcases information about historical operating results of ABC corporation with the help of cashflow statement and statement of financial position.Slidegeeks is here to make your presentations a breeze with Guide To Develop And Estimate Brand Value Sample Asset Valuation Report Historical Operating Results Background PDF With our easy-to-use and customizable templates, you can focus on delivering your ideas rather than worrying about formatting. With a variety of designs to choose from, you are sure to find one that suits your needs. And with animations and unique photos, illustrations, and fonts, you can make your presentation pop. So whether you are giving a sales pitch or presenting to the board, make sure to check out Slidegeeks first.
This slide illustrates information about ABC corporations valuation using greenfield approach. Fair value of license is calculated by subtracting tax amortization benefit from total value.Want to ace your presentation in front of a live audience Our Sample Asset Valuation Report Historical Operating Results Brand Value Estimation Guide Icons PDF can help you do that by engaging all the users towards you.. Slidegeeks experts have put their efforts and expertise into creating these impeccable powerpoint presentations so that you can communicate your ideas clearly. Moreover, all the templates are customizable, and easy-to-edit and downloadable. Use these for both personal and commercial use.
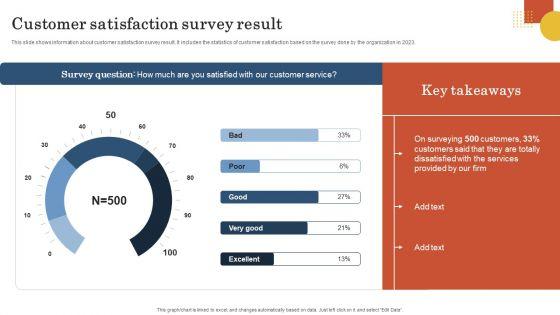

This slide shows information about customer satisfaction survey result. It includes the statistics of customer satisfaction based on the survey done by the organization in 2023. From laying roadmaps to briefing everything in detail, our templates are perfect for you. You can set the stage with your presentation slides. All you have to do is download these easy to edit and customizable templates. Retail Business Operation Management To Optimize Customer Experience Customer Satisfaction Survey Result Information PDF will help you deliver an outstanding performance that everyone would remember and praise you for. Do download this presentation today.


The following slide showcases the business performance status summary to effectively measure results and outcomes. It includes elements such as task status, priority, planned and actual budget, pending tasks, decisions, actions and change requests etc. Create an editable Analysing Operational Tasks Status Summary Objectives And Key Result Methodology For Business that communicates your idea and engages your audience. Whether you are presenting a business or an educational presentation, pre-designed presentation templates help save time. Analysing Operational Tasks Status Summary Objectives And Key Result Methodology For Business is highly customizable and very easy to edit, covering many different styles from creative to business presentations. Slidegeeks has creative team members who have crafted amazing templates. So, go and get them without any delay. The following slide showcases the business performance status summary to effectively measure results and outcomes. It includes elements such as task status, priority, planned and actual budget, pending tasks, decisions, actions and change requests etc.


The following slide highlights various indicators in manufacturing operations. The key components are- average result area score of manufacturing and production targets, capacity utilizations, operating efficiency etc. Showcasing this set of slides titled Production Operations Key Result Areas With Average Scores Structure Pdf. The topics addressed in these templates are Result Areas. All the content presented in this PPT design is completely editable. Download it and make adjustments in color, background, font etc. as per your unique business setting. The following slide highlights various indicators in manufacturing operations. The key components are- average result area score of manufacturing and production targets, capacity utilizations, operating efficiency etc.

Following slide shows survey results to understand challenges in company billing system. It include pointers such as management issue, data manipulation, complexity, reporting concern etc. Take your projects to the next level with our ultimate collection of Survey Results Depicting Enhancing Customer Service Operations Using CRM Technology Download Pdf. Slidegeeks has designed a range of layouts that are perfect for representing task or activity duration, keeping track of all your deadlines at a glance. Tailor these designs to your exact needs and give them a truly corporate look with your own brand colors they will make your projects stand out from the rest Following slide shows survey results to understand challenges in company billing system. It include pointers such as management issue, data manipulation, complexity, reporting concern etc.
19 Item(s)