- Sign up
- Sign In
 AI PPT Maker
 Templates
 PPT Bundles
 Design Services
 Business PPTs
 Business Plan
 Management
 Strategy
 Introduction PPT
 Roadmap
 Self Introduction
 Timelines
 Process
 Marketing
 Agenda
 Technology
 Medical
 Startup Business Plan
 Cyber Security
 Dashboards
 SWOT
SWOT Proposals
 Education
 Pitch Deck
 Digital Marketing
 KPIs
KPIs Project Management
 Product Management
 Artificial Intelligence
 Target Market
 Communication
 Supply Chain
 Google Slides
 Research Services
 One Pagers
 All Categories
Metric representing PowerPoint Presentation Templates and Google Slides
5 Item(s)
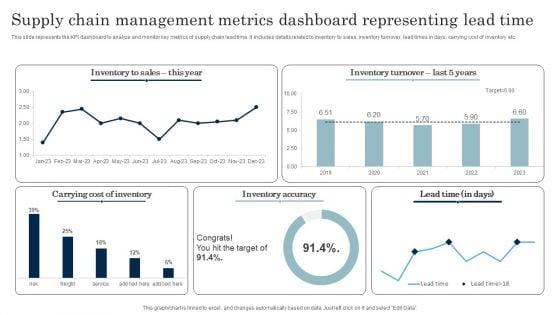
This slide represents the KPI dashboard to analyze and monitor key metrics of supply chain lead time. It includes details related to inventory to sales, inventory turnover, lead times in days, carrying cost of inventory etc. Pitch your topic with ease and precision using this Supply Chain Management Metrics Dashboard Representing Lead Time Download PDF. This layout presents information on Inventory Accuracy, Carrying Cost Of Inventory. It is also available for immediate download and adjustment. So, changes can be made in the color, design, graphics or any other component to create a unique layout.
This slide shows the graphical representation of success metrics that helps to measure the customer service team which includes customer lifetime value, customer churn, net promoter score, revenues churn, customer experience score, customer renewals, etc. Showcasing this set of slides titled bar graph representing accomplishment metrics for customer service team icons pdf. The topics addressed in these templates are importance level, least important. All the content presented in this PPT design is completely editable. Download it and make adjustments in color, background, font etc. as per your unique business setting.


Presenting Operations Metrics Icon Representing Business Performance Portrait PDF to dispense important information. This template comprises Three stages. It also presents valuable insights into the topics including Operations Metrics Icon, Representing Business Performance. This is a completely customizable PowerPoint theme that can be put to use immediately. So, download it and address the topic impactfully.
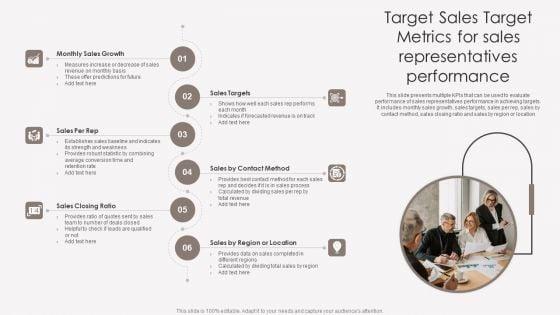
This slide presents multiple KPIs that can be used to evaluate performance of sales representatives performance in achieving targets. It includes monthly sales growth, sales targets, sales per rep, sales by contact method, sales closing ratio and sales by region or location. Persuade your audience using this Target Sales Target Metrics For Sales Representatives Performance Ideas PDF. This PPT design covers six stages, thus making it a great tool to use. It also caters to a variety of topics including Monthly Sales Growth, Sales Closing Ratio, Region Or Location. Download this PPT design now to present a convincing pitch that not only emphasizes the topic but also showcases your presentation skills.
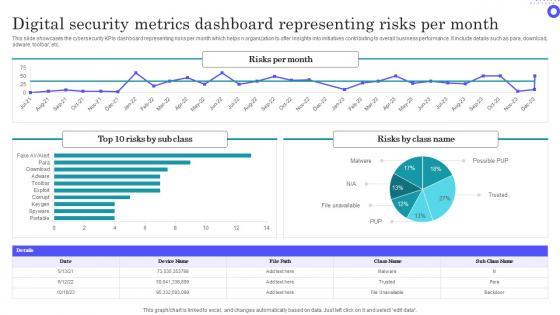
Showcasing this set of slides titled Digital Security Metrics Dashboard Representing Risks Per Month Themes Pdf The topics addressed in these templates are Digital Security, Metrics Dashboard, Representing Risks All the content presented in this PPT design is completely editable. Download it and make adjustments in color, background, font etc. as per your unique business setting. This slide showcases the cybersecurity KPIs dashboard representing risks per month which helps n organization to offer insights into initiatives contributing to overall business performance. It include details such as para, download, adware, toolbar, etc.
5 Item(s)