- Sign up
- Sign In
 AI PPT Maker
 Templates
 PPT Bundles
 Design Services
 Business PPTs
 Business Plan
 Management
 Strategy
 Introduction PPT
 Roadmap
 Self Introduction
 Timelines
 Process
 Marketing
 Agenda
 Technology
 Medical
 Startup Business Plan
 Cyber Security
 Dashboards
 SWOT
SWOT Proposals
 Education
 Pitch Deck
 Digital Marketing
 KPIs
KPIs Project Management
 Product Management
 Artificial Intelligence
 Target Market
 Communication
 Supply Chain
 Google Slides
 Research Services
 One Pagers
 All Categories
Marketing kpi dashboard PowerPoint Presentation Templates and Google Slides
DISPLAYING: 60 of 296 Item(s)
Page

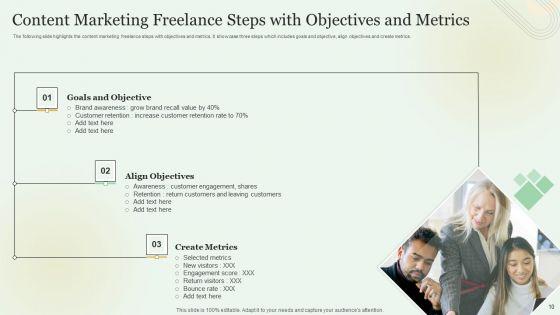
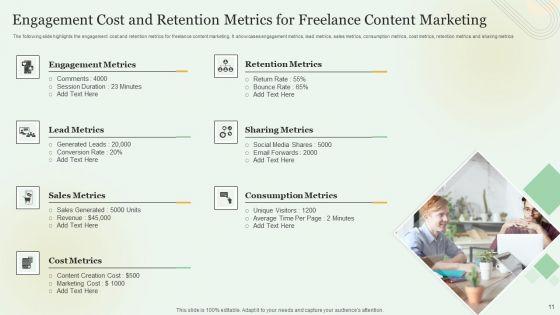
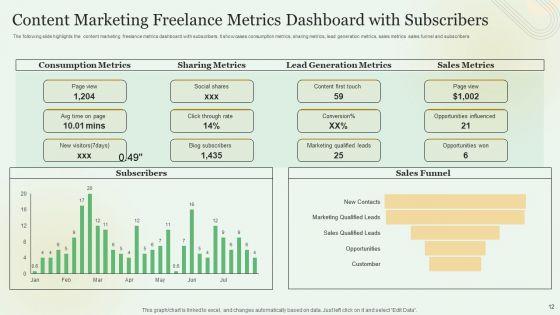
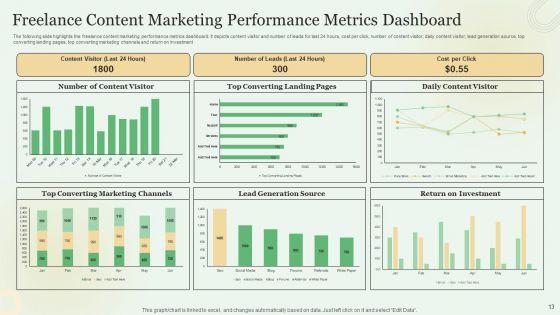
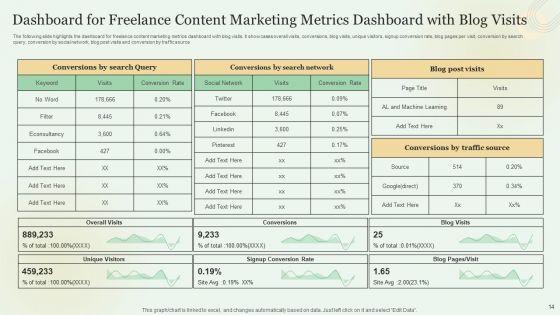
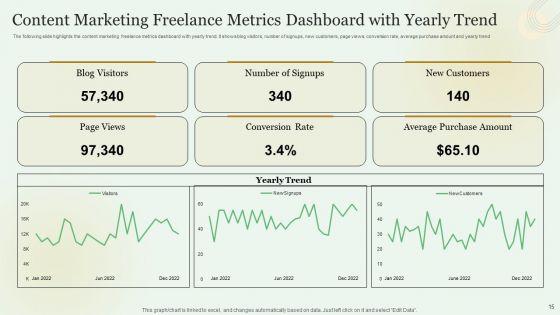
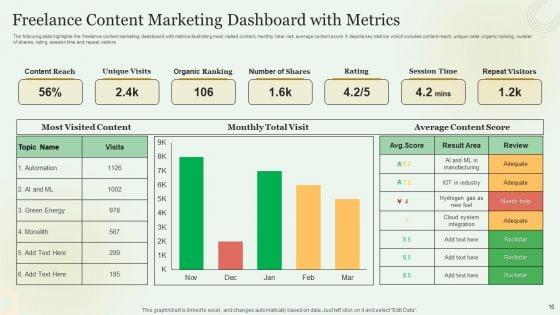
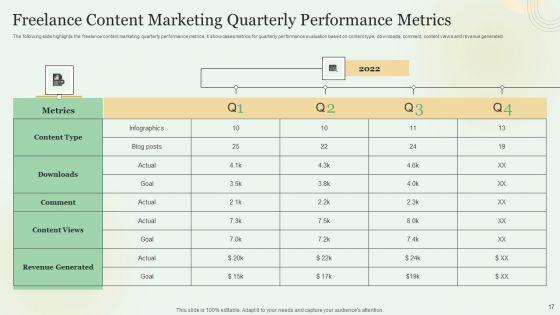
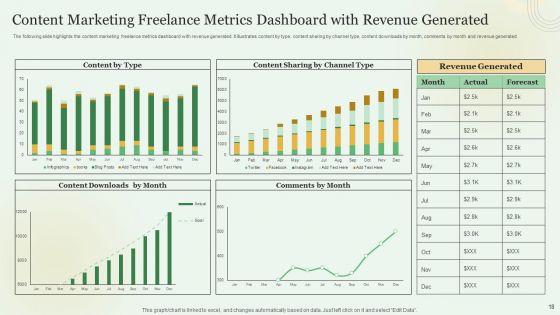
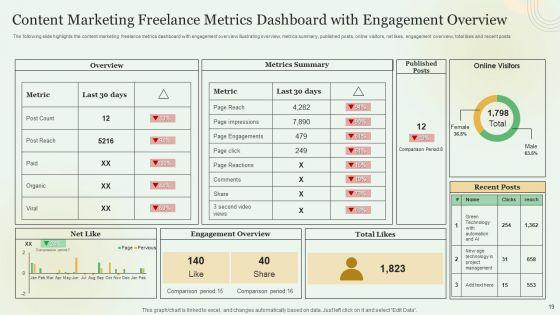
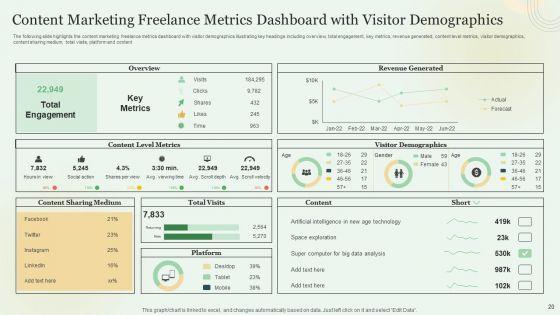
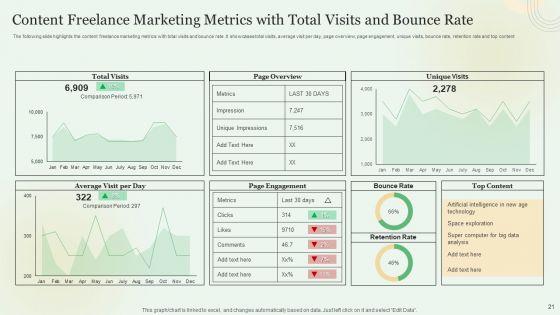
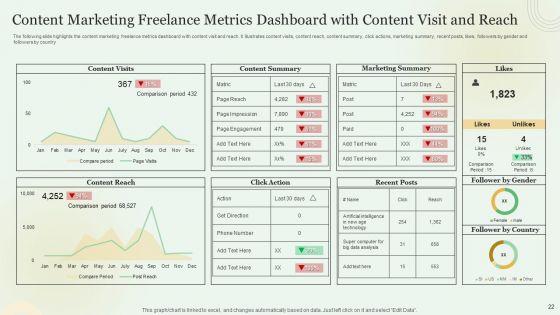
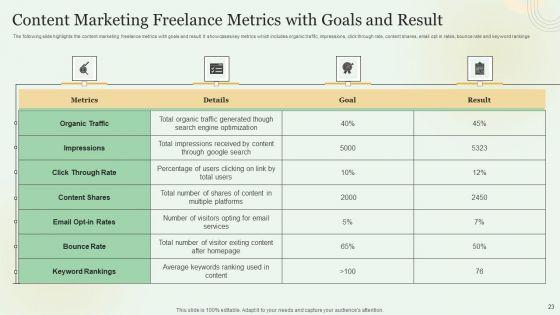

If designing a presentation takes a lot of your time and resources and you are looking for a better alternative, then this Content Marketing Freelance KPI Dashboard Ppt PowerPoint Presentation Complete With Slides is the right fit for you. This is a prefabricated set that can help you deliver a great presentation on the topic. All the twenty seven slides included in this sample template can be used to present a birds-eye view of the topic. These slides are also fully editable, giving you enough freedom to add specific details to make this layout more suited to your business setting. Apart from the content, all other elements like color, design, theme are also replaceable and editable. This helps in designing a variety of presentations with a single layout. Not only this, you can use this PPT design in formats like PDF, PNG, and JPG once downloaded. Therefore, without any further ado, download and utilize this sample presentation as per your liking.


Boost your confidence and team morale with this well-structured Marketing Activities KPI Dashboard Ppt PowerPoint Presentation Complete Deck With Slides. This prefabricated set gives a voice to your presentation because of its well-researched content and graphics. Our experts have added all the components very carefully, thus helping you deliver great presentations with a single click. Not only that, it contains a set of twelv slides that are designed using the right visuals, graphics, etc. Various topics can be discussed, and effective brainstorming sessions can be conducted using the wide variety of slides added in this complete deck. Apart from this, our PPT design contains clear instructions to help you restructure your presentations and create multiple variations. The color, format, design anything can be modified as deemed fit by the user. Not only this, it is available for immediate download. So, grab it now.


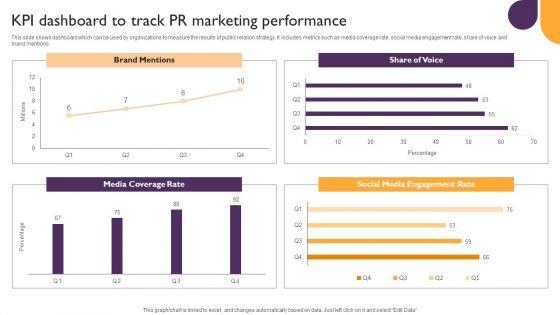
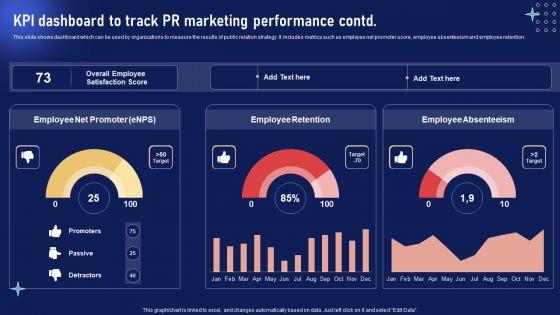
This slide shows dashboard which can be used by organizations to measure the results of public relation strategy. It includes metrics such as media coverage rate, social media engagement rate, share of voice and brand mentions. This modern and well arranged Internal Promotion Strategy To Enhance Brand Awareness KPI Dashboard To Track PR Marketing Performance Ideas PDF provides lots of creative possibilities. It is very simple to customize and edit with the Powerpoint Software. Just drag and drop your pictures into the shapes. All facets of this template can be edited with Powerpoint no extra software is necessary. Add your own material, put your images in the places assigned for them, adjust the colors, and then you can show your slides to the world, with an animated slide included.


This slide shows dashboard which can be used by organizations to measure the results of public relation strategy. It includes metrics such as media coverage rate, social media engagement rate, share of voice and brand mentions. Make sure to capture your audiences attention in your business displays with our gratis customizable Public Relations Guide To Enhance Brand Credibility KPI Dashboard To Track PR Marketing Performance Diagrams PDF. These are great for business strategies, office conferences, capital raising or task suggestions. If you desire to acquire more customers for your tech business and ensure they stay satisfied, create your own sales presentation with these plain slides.


This slide shows dashboard which can be used by organizations to measure the results of public relation strategy. It includes metrics such as media coverage rate, social media engagement rate, share of voice and brand mentions. Present like a pro with Implementing Internal Marketing Kpi Dashboard To Track PR Marketing Performance Mockup PDF Create beautiful presentations together with your team, using our easy-to-use presentation slides. Share your ideas in real-time and make changes on the fly by downloading our templates. So whether youre in the office, on the go, or in a remote location, you can stay in sync with your team and present your ideas with confidence. With Slidegeeks presentation got a whole lot easier. Grab these presentations today.
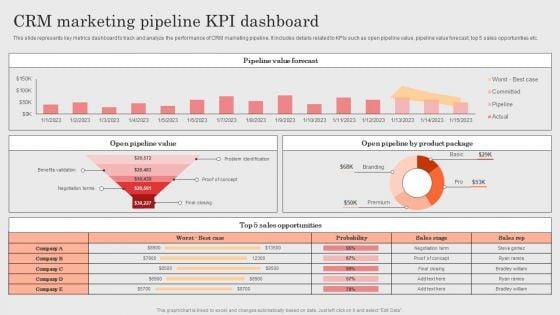

This slide represents key metrics dashboard to track and analyze the performance of CRM marketing pipeline. It includes details related to KPIs such as open pipeline value, pipeline value forecast, top 5 sales opportunities etc. Crafting an eye catching presentation has never been more straightforward. Let your presentation shine with this tasteful yet straightforward Integrating CRM Solution To Acquire Potential Customers CRM Marketing Pipeline KPI Dashboard Background PDF template. It offers a minimalistic and classy look that is great for making a statement. The colors have been employed intelligently to add a bit of playfulness while still remaining professional. Construct the ideal Integrating CRM Solution To Acquire Potential Customers CRM Marketing Pipeline KPI Dashboard Background PDF that effortlessly grabs the attention of your audience. Begin now and be certain to wow your customers.
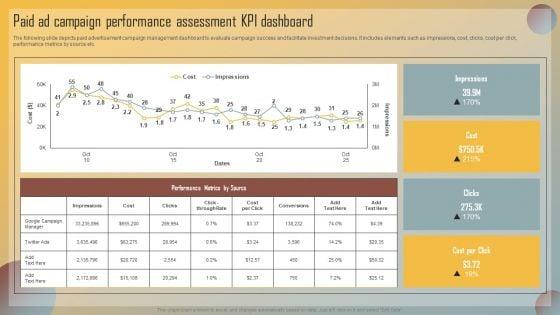

The following slide depicts paid advertisement campaign management dashboard to evaluate campaign success and facilitate investment decisions. It includes elements such as impressions, cost, clicks, cost per click, performance metrics by source etc. There are so many reasons you need a Guide For Marketing Analytics To Improve Decisions Paid Ad Campaign Performance Assessment KPI Dashboard Microsoft PDF. The first reason is you cannot spend time making everything from scratch, Thus, Slidegeeks has made presentation templates for you too. You can easily download these templates from our website easily.
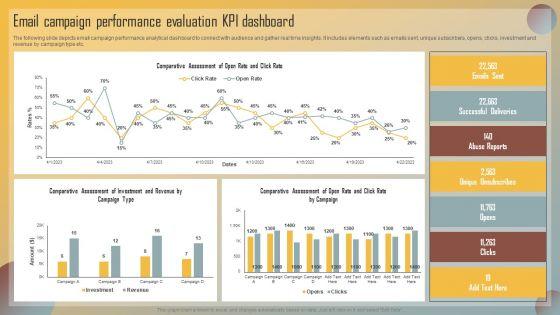
The following slide depicts email campaign performance analytical dashboard to connect with audience and gather real time insights. It includes elements such as emails sent, unique subscribers, opens, clicks, investment and revenue by campaign type etc. Create an editable Guide For Marketing Analytics To Improve Decisions Email Campaign Performance Evaluation KPI Dashboard Summary PDF that communicates your idea and engages your audience. Whether youre presenting a business or an educational presentation, pre designed presentation templates help save time. Guide For Marketing Analytics To Improve Decisions Email Campaign Performance Evaluation KPI Dashboard Summary PDF is highly customizable and very easy to edit, covering many different styles from creative to business presentations. Slidegeeks has creative team members who have crafted amazing templates. So, go and get them without any delay.

The following slide showcases a comprehensive key performance indicator KPI dashboard which can be used to showcase the outcome of marketing campaign. The major metrics covered in the slide are brand mentions, customer lifetime value CLV, customer acquisition cost CAC, net promoter score NPS, etc. Are you in need of a template that can accommodate all of your creative concepts This one is crafted professionally and can be altered to fit any style. Use it with Google Slides or PowerPoint. Include striking photographs, symbols, depictions, and other visuals. Fill, move around, or remove text boxes as desired. Test out color palettes and font mixtures. Edit and save your work, or work with colleagues. Download KPI Dashboard Highlighting Result Of Marketing Campaign Ppt PowerPoint Presentation Diagram Lists PDF and observe how to make your presentation outstanding. Give an impeccable presentation to your group and make your presentation unforgettable.
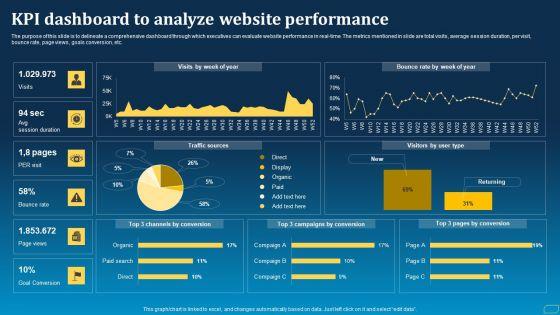

The purpose of this slide is to delineate a comprehensive dashboard through which executives can evaluate website performance in real-time. The metrics mentioned in slide are total visits, average session duration, per visit, bounce rate, page views, goals conversion, etc. Crafting an eye catching presentation has never been more straightforward. Let your presentation shine with this tasteful yet straightforward Direct Marketing Techniques To Enhance Business Presence KPI Dashboard To Analyze Website Performance Background PDF template. It offers a minimalistic and classy look that is great for making a statement. The colors have been employed intelligently to add a bit of playfulness while still remaining professional. Construct the ideal Direct Marketing Techniques To Enhance Business Presence KPI Dashboard To Analyze Website Performance Background PDF that effortlessly grabs the attention of your audience. Begin now and be certain to wow your customers.
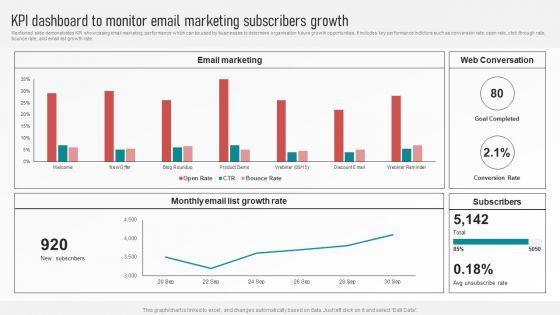

Mentioned slide demonstrates KPI showcasing email marketing performance which can be used by businesses to determine organisation future growth opportunities. It includes key performance indictors such as conversion rate, open rate, click through rate, bounce rate, and email list growth rate. Make sure to capture your audiences attention in your business displays with our gratis customizable Customer Retention With Email Advertising Campaign Plan KPI Dashboard To Monitor Email Marketing Structure PDF. These are great for business strategies, office conferences, capital raising or task suggestions. If you desire to acquire more customers for your tech business and ensure they stay satisfied, create your own sales presentation with these plain slides.
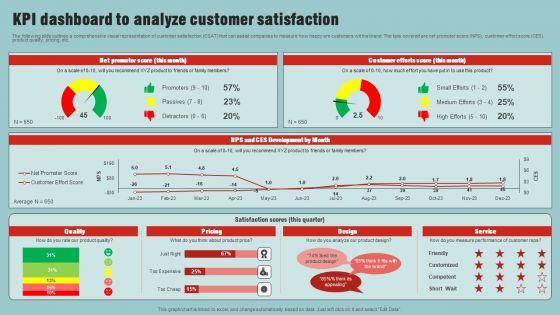

The following slide outlines a comprehensive visual representation of customer satisfaction CSAT that can assist companies to measure how happy are customers wit the brand. The kpis covered are net promoter score NPS, customer effort score CES, product quality, pricing, etc. Retrieve professionally designed Market Analysis Overview And Different Categories KPI Dashboard To Analyze Customer Satisfaction Elements PDF to effectively convey your message and captivate your listeners. Save time by selecting pre made slideshows that are appropriate for various topics, from business to educational purposes. These themes come in many different styles, from creative to corporate, and all of them are easily adjustable and can be edited quickly. Access them as PowerPoint templates or as Google Slides themes. You do not have to go on a hunt for the perfect presentation because Slidegeeks got you covered from everywhere.


The following slide outlines key performance indicator KPI dashboard that can assist marketers to evaluate brand performance on social media channels. The metrics covered are age group, gender, brand perception, branding themes, celebrity analysis, etc. Present like a pro with Market Analysis Overview And Different Categories Brand Analytics Kpi Dashboard For Organization Rules PDF Create beautiful presentations together with your team, using our easy to use presentation slides. Share your ideas in real time and make changes on the fly by downloading our templates. So whether you are in the office, on the go, or in a remote location, you can stay in sync with your team and present your ideas with confidence. With Slidegeeks presentation got a whole lot easier. Grab these presentations today.
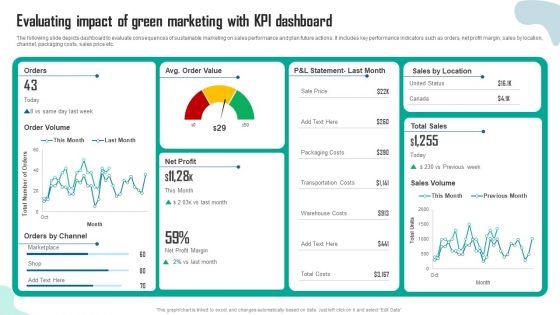

The following slide depicts dashboard to evaluate consequences of sustainable marketing on sales performance and plan future actions. It includes key performance indicators such as orders, net profit margin, sales by location, channel, packaging costs, sales price etc. This Evaluating Impact Of Green Marketing With Kpi Dashboard Inspiration PDF from Slidegeeks makes it easy to present information on your topic with precision. It provides customization options, so you can make changes to the colors, design, graphics, or any other component to create a unique layout. It is also available for immediate download, so you can begin using it right away. Slidegeeks has done good research to ensure that you have everything you need to make your presentation stand out. Make a name out there for a brilliant performance.
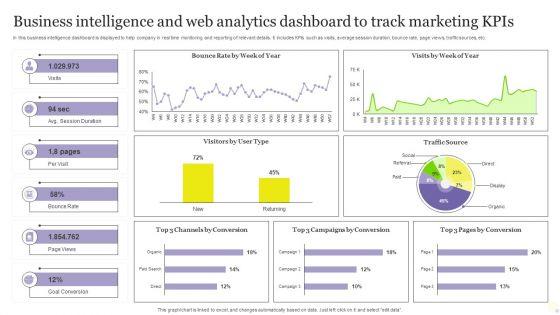

In this business intelligence dashboard is displayed to help company in real time monitoring and reporting of relevant details. It includes KPIs such as visits, average session duration, bounce rate, page views, traffic sources, etc. Showcasing this set of slides titled Business Intelligence And Web Analytics Dashboard To Track Marketing Kpis Inspiration PDF. The topics addressed in these templates are Goal Conversion, Track Marketing Kpis, Web Analytics Dashboard. All the content presented in this PPT design is completely editable. Download it and make adjustments in color, background, font etc. as per your unique business setting.

Following slide showcases KPI dashboard to determine best market for launching new business. It includes key components such as growth rate by different industries, best states to launch startup, sales forecast, market growth forecast, projected sales by different states. Showcasing this set of slides titled KPI Dashboard To Track Best Market Opportunities For New Established Business Pictures PDF. The topics addressed in these templates are Forecasted Sales, Growth Rate, Startup Industries. All the content presented in this PPT design is completely editable. Download it and make adjustments in color, background, font etc. as per your unique business setting.


Following slide demonstrate KPI dashboard to determine target audience which can be used by businesses for startup growth. It includes key components such as target audience age, target audience gender, target audience interest, target audience social media interest, target audience location, etc. Showcasing this set of slides titled KPI Dashboard To Identify Target Market For New Established Business Formats PDF. The topics addressed in these templates are Target Audience Age, Target Audience Interest, Target Audience Location. All the content presented in this PPT design is completely editable. Download it and make adjustments in color, background, font etc. as per your unique business setting.
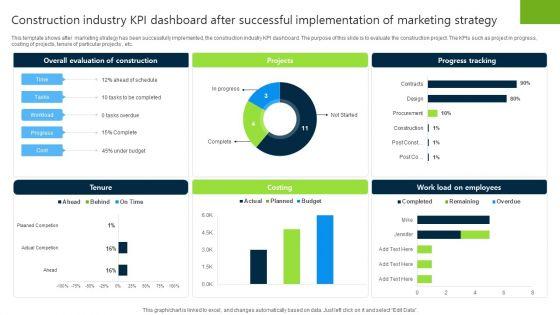

Construction Industry KPI Dashboard After Successful Implementation Of Marketing Strategy Sample PDF
This template shows after marketing strategy has been successfully implemented, the construction industry KPI dashboard. The purpose of this slide is to evaluate the construction project. The KPIs such as project in progress, costing of projects, tenure of particular projects , etc. Showcasing this set of slides titled Construction Industry KPI Dashboard After Successful Implementation Of Marketing Strategy Sample PDF. The topics addressed in these templates are Projetcs, Progress Tracking, Costing. All the content presented in this PPT design is completely editable. Download it and make adjustments in color, background, font etc. as per your unique business setting.
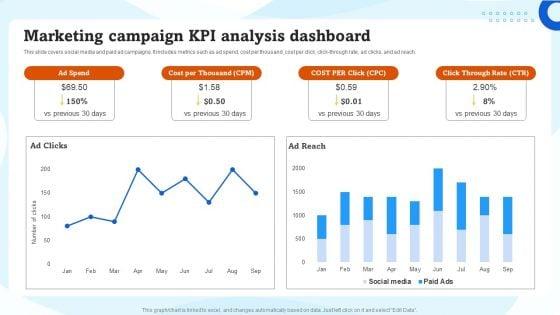

This slide covers social media and paid ad campaigns. It includes metrics such as ad spend, cost per thousand, cost per click, click-through rate, ad clicks, and ad reach. Coming up with a presentation necessitates that the majority of the effort goes into the content and the message you intend to convey. The visuals of a PowerPoint presentation can only be effective if it supplements and supports the story that is being told. Keeping this in mind our experts created Marketing Campaign KPI Analysis Dashboard Ppt Inspiration Example File PDF to reduce the time that goes into designing the presentation. This way, you can concentrate on the message while our designers take care of providing you with the right template for the situation.
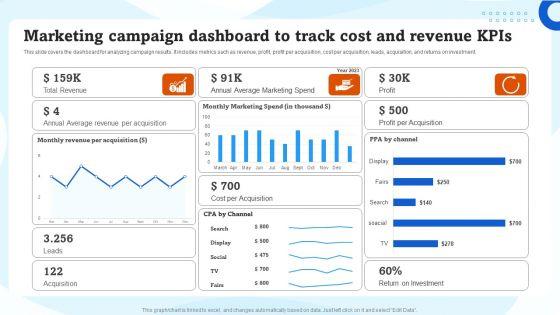
This slide covers the dashboard for analyzing campaign results. It includes metrics such as revenue, profit, profit per acquisition, cost per acquisition, leads, acquisition, and returns on investment. Formulating a presentation can take up a lot of effort and time, so the content and message should always be the primary focus. The visuals of the PowerPoint can enhance the presenters message, so our Marketing Campaign Dashboard To Track Cost And Revenue Kpis Ppt Infographics Good PDF was created to help save time. Instead of worrying about the design, the presenter can concentrate on the message while our designers work on creating the ideal templates for whatever situation is needed. Slidegeeks has experts for everything from amazing designs to valuable content, we have put everything into Marketing Campaign Dashboard To Track Cost And Revenue Kpis Ppt Infographics Good PDF.
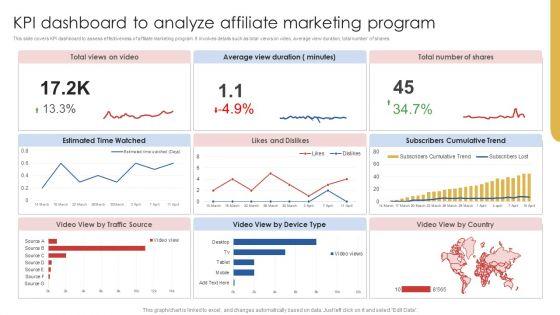

This slide covers KPI dashboard to assess effectiveness of affiliate marketing program. It involves details such as total views on video, average view duration, total number of shares. Create an editable KPI Dashboard To Analyze Affiliate Marketing Program Rules PDF that communicates your idea and engages your audience. Whether you are presenting a business or an educational presentation, pre-designed presentation templates help save time. KPI Dashboard To Analyze Affiliate Marketing Program Rules PDF is highly customizable and very easy to edit, covering many different styles from creative to business presentations. Slidegeeks has creative team members who have crafted amazing templates. So, go and get them without any delay.
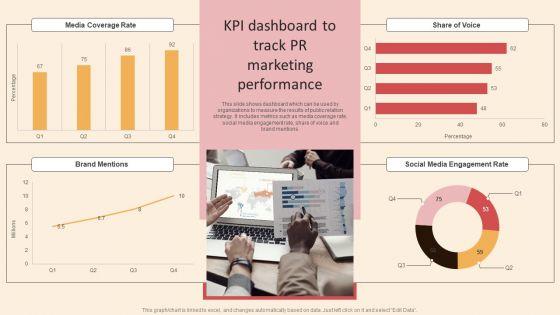

This slide shows dashboard which can be used by organizations to measure the results of public relation strategy. It includes metrics such as media coverage rate, social media engagement rate, share of voice and brand mentions. Make sure to capture your audiences attention in your business displays with our gratis customizable Online PR Techniques To Boost Brands Online Visibility KPI Dashboard To Track PR Marketing Summary PDF. These are great for business strategies, office conferences, capital raising or task suggestions. If you desire to acquire more customers for your tech business and ensure they stay satisfied, create your own sales presentation with these plain slides.
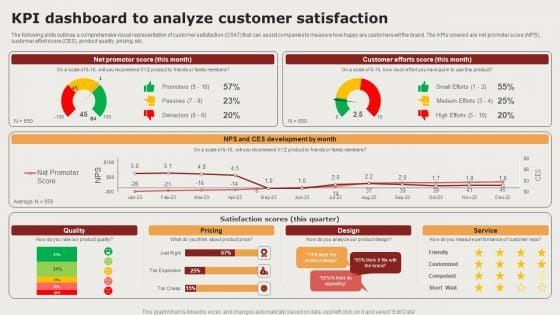
The following slide outlines a comprehensive visual representation of customer satisfaction CSAT that can assist companies to measure how happy are customers wit the brand. The KPIs covered are net promoter score NPS, customer effort score CES, product quality, pricing, etc. Want to ace your presentation in front of a live audience Our Creating Positioning Techniques For Market Research Kpi Dashboard To Analyze Customer Satisfaction Mockup PDF can help you do that by engaging all the users towards you. Slidegeeks experts have put their efforts and expertise into creating these impeccable powerpoint presentations so that you can communicate your ideas clearly. Moreover, all the templates are customizable, and easy to edit and downloadable. Use these for both personal and commercial use.


The following slide outlines key performance indicator KPI dashboard that can assist marketers to evaluate brand performance on social media channels. The metrics covered are age group, gender, brand perception, branding themes, celebrity analysis, etc. Boost your pitch with our creative Creating Positioning Techniques For Market Research Brand Analytics Kpi Dashboard For Organization Slides PDF. Deliver an awe-inspiring pitch that will mesmerize everyone. Using these presentation templates you will surely catch everyones attention. You can browse the ppts collection on our website. We have researchers who are experts at creating the right content for the templates. So you do not have to invest time in any additional work. Just grab the template now and use them.


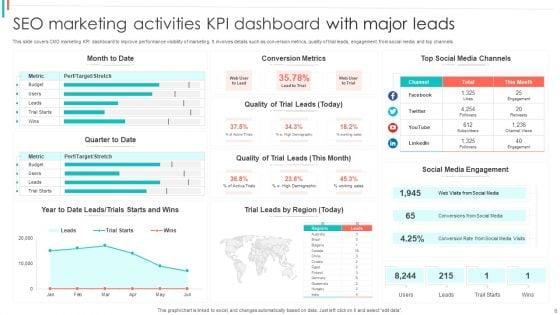
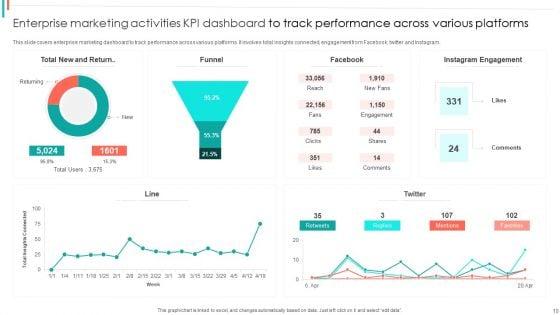
This slide showcases dashboard that can help organization to measure the KPIs after implementing personalized marketing campaigns. Its key elements are lead breakdown, web user to lead, lead to trial, leads by region and google analtics web traffic Are you in need of a template that can accommodate all of your creative concepts This one is crafted professionally and can be altered to fit any style. Use it with Google Slides or PowerPoint. Include striking photographs, symbols, depictions, and other visuals. Fill, move around, or remove text boxes as desired. Test out color palettes and font mixtures. Edit and save your work, or work with colleagues. Download Dashboard For Personalized Digital Marketing Kpis Ppt PowerPoint Presentation File Backgrounds PDF and observe how to make your presentation outstanding. Give an impeccable presentation to your group and make your presentation unforgettable.


The following slide outlines a comprehensive visual representation of customer satisfaction CSAT that can assist companies to measure how happy are customers wit the brand. The KPIs covered are net promoter score NPS, customer effort score CES, product quality, pricing, etc. Presenting this PowerPoint presentation, titled Market Research Assessment Of Target Market Requirements Kpi Dashboard To Analyze Customer Satisfaction Pictures PDF, with topics curated by our researchers after extensive research. This editable presentation is available for immediate download and provides attractive features when used. Download now and captivate your audience. Presenting this Market Research Assessment Of Target Market Requirements Kpi Dashboard To Analyze Customer Satisfaction Pictures PDF. Our researchers have carefully researched and created these slides with all aspects taken into consideration. This is a completely customizable Market Research Assessment Of Target Market Requirements Kpi Dashboard To Analyze Customer Satisfaction Pictures PDF that is available for immediate downloading. Download now and make an impact on your audience. Highlight the attractive features available with our PPTs.

The following slide outlines key performance indicator KPI dashboard that can assist marketers to evaluate brand performance on social media channels. The metrics covered are age group, gender, brand perception, branding themes, celebrity analysis, etc. Do you have an important presentation coming up Are you looking for something that will make your presentation stand out from the rest Look no further than Market Research Assessment Of Target Market Requirements Brand Analytics Kpi Dashboard For Organization Clipart PDF. With our professional designs, you can trust that your presentation will pop and make delivering it a smooth process. And with Slidegeeks, you can trust that your presentation will be unique and memorable. So why wait Grab Market Research Assessment Of Target Market Requirements Brand Analytics Kpi Dashboard For Organization Clipart PDF today and make your presentation stand out from the rest.
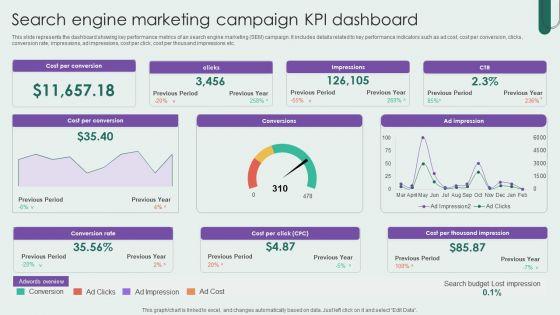
This slide represents the dashboard showing key performance metrics of an search engine marketing SEM campaign. It includes details related to key performance indicators such as ad cost, cost per conversion, clicks, conversion rate, impressions, ad impressions, cost per click, cost per thousand impressions etc. Showcasing this set of slides titled Search Engine Marketing Campaign KPI Dashboard Inspiration PDF. The topics addressed in these templates are Search Engine Marketing, Campaign KPI Dashboard. All the content presented in this PPT design is completely editable. Download it and make adjustments in color, background, font etc. as per your unique business setting.


Following slide demonstrates monthly real estate strategic sales progress KPI dashboard to determine business performance. It includes elements such as monthly sales comparison, yearly sales , revenue by project status, monthly sales trend, maximum sales by states and units sold by states. Showcasing this set of slides titled KPI Dashboard To Track Techniques Marketing Performance Of Real Estate Information PDF. The topics addressed in these templates are Revenue By Status, Monthly Sales Comparison, Monthly Sales Trend. All the content presented in this PPT design is completely editable. Download it and make adjustments in color, background, font etc. as per your unique business setting.


This slide showcases the parameters that would help the business organization to evaluate Pay Per Click PPC marketing performance. It includes ad cost, clicks, impression, conversions, ad impressions, conversion rate, Cost Per Click CPC, etc. Presenting this PowerPoint presentation, titled KPI Dashboard To Analyze PPC Marketing Campaigns Performance Information PDF, with topics curated by our researchers after extensive research. This editable presentation is available for immediate download and provides attractive features when used. Download now and captivate your audience. Presenting this KPI Dashboard To Analyze PPC Marketing Campaigns Performance Information PDF. Our researchers have carefully researched and created these slides with all aspects taken into consideration. This is a completely customizable KPI Dashboard To Analyze PPC Marketing Campaigns Performance Information PDF that is available for immediate downloading. Download now and make an impact on your audience. Highlight the attractive features available with our PPTs.
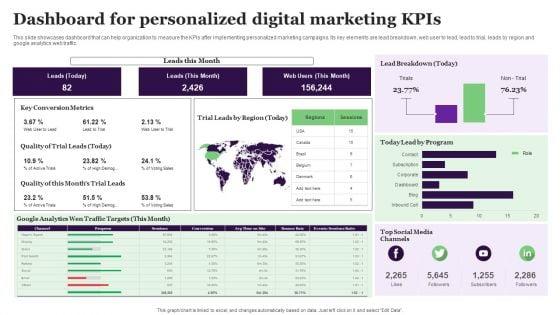

This slide showcases dashboard that can help organization to measure the KPIs after implementing personalized marketing campaigns. Its key elements are lead breakdown, web user to lead, lead to trial, leads by region and google analytics web traffic. Boost your pitch with our creative Dashboard For Personalized Digital Marketing Kpis Introduction PDF. Deliver an awe-inspiring pitch that will mesmerize everyone. Using these presentation templates you will surely catch everyones attention. You can browse the ppts collection on our website. We have researchers who are experts at creating the right content for the templates. So you do not have to invest time in any additional work. Just grab the template now and use them.
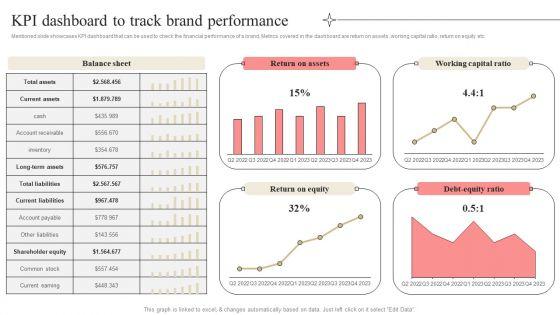

Mentioned slide showcases KPI dashboard that can be used to check the financial performance of a brand. Metrics covered in the dashboard are return on assets, working capital ratio, return on equity etc. Coming up with a presentation necessitates that the majority of the effort goes into the content and the message you intend to convey. The visuals of a PowerPoint presentation can only be effective if it supplements and supports the story that is being told. Keeping this in mind our experts created Developing Market Leading Businesses KPI Dashboard To Track Brand Performance Summary PDF to reduce the time that goes into designing the presentation. This way, you can concentrate on the message while our designers take care of providing you with the right template for the situation.
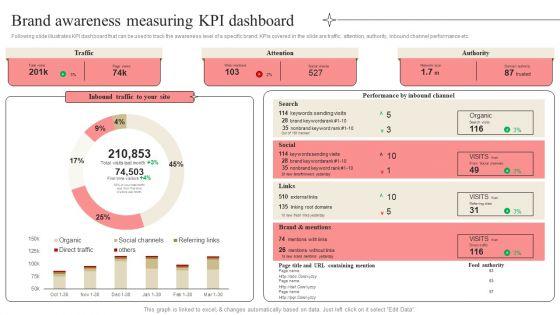

Following slide illustrates KPI dashboard that can be used to track the awareness level of a specific brand. KPIs covered in the slide are traffic, attention, authority, inbound channel performance etc. Are you in need of a template that can accommodate all of your creative concepts This one is crafted professionally and can be altered to fit any style. Use it with Google Slides or PowerPoint. Include striking photographs, symbols, depictions, and other visuals. Fill, move around, or remove text boxes as desired. Test out color palettes and font mixtures. Edit and save your work, or work with colleagues. Download Developing Market Leading Businesses Brand Awareness Measuring KPI Dashboard Themes PDF and observe how to make your presentation outstanding. Give an impeccable presentation to your group and make your presentation unforgettable.


The following slide showcases the impact of offline marketing strategies on store performance. The key performance indicators KPIs mentioned in slide are sales, customers, average transaction price, average units per customer, top collections, sales by different segments, etc. Retrieve professionally designed Comprehensive Guide To Build Marketing Traditional Marketing KPI Dashboard With Total Designs PDF to effectively convey your message and captivate your listeners. Save time by selecting pre-made slideshows that are appropriate for various topics, from business to educational purposes. These themes come in many different styles, from creative to corporate, and all of them are easily adjustable and can be edited quickly. Access them as PowerPoint templates or as Google Slides themes. You do not have to go on a hunt for the perfect presentation because Slidegeeks got you covered from everywhere.
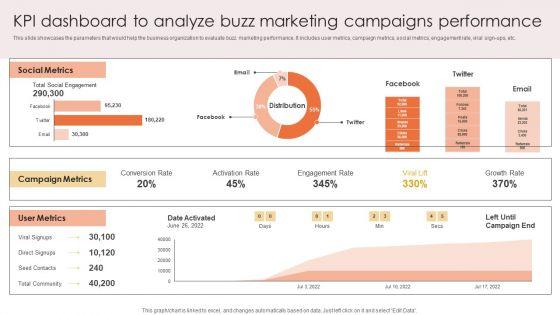

This slide showcases the parameters that would help the business organization to evaluate buzz marketing performance. It includes user metrics, campaign metrics, social metrics, engagement rate, viral sign-ups, etc. Take your projects to the next level with our ultimate collection of Kpi Dashboard To Analyze Buzz Marketing Campaigns Performance Download PDF. Slidegeeks has designed a range of layouts that are perfect for representing task or activity duration, keeping track of all your deadlines at a glance. Tailor these designs to your exact needs and give them a truly corporate look with your own brand colors they will make your projects stand out from the rest.
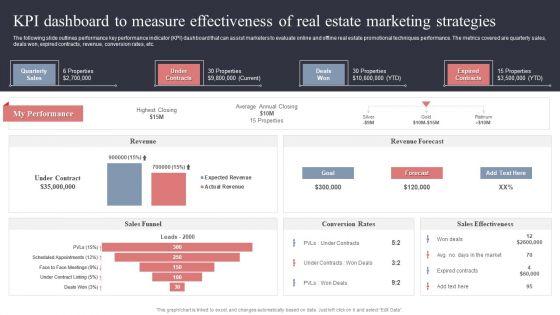

The following slide outlines performance key performance indicator KPI dashboard that can assist marketers to evaluate online and offline real estate promotional techniques performance. The metrics covered are quarterly sales, deals won, expired contracts, revenue, conversion rates, etc. Coming up with a presentation necessitates that the majority of the effort goes into the content and the message you intend to convey. The visuals of a PowerPoint presentation can only be effective if it supplements and supports the story that is being told. Keeping this in mind our experts created KPI Dashboard To Measure Effectiveness Of Real Estate Marketing Strategies Inspiration PDF to reduce the time that goes into designing the presentation. This way, you can concentrate on the message while our designers take care of providing you with the right template for the situation.


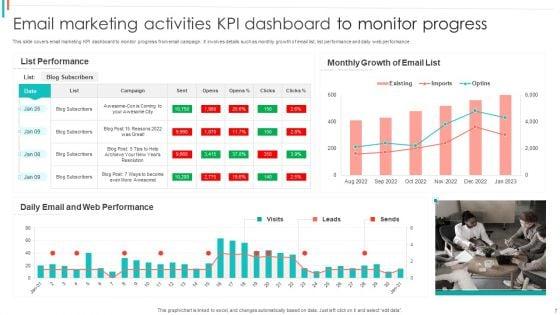
This slide represents the key performance metrics to dashboard to monitor and analyze progress of personalized email marketing campaign conducted by the enterprise. It includes details related to KPIs such as wen conversions, subscribers, list growth rate etc. If your project calls for a presentation, then Slidegeeks is your go-to partner because we have professionally designed, easy-to-edit templates that are perfect for any presentation. After downloading, you can easily edit Personalized Email Marketing Campaign KPI Dashboard Inspiration PDF and make the changes accordingly. You can rearrange slides or fill them with different images. Check out all the handy templates


The following slide exhibits detailed view of companys revenue-related website metrics. It helps in determining initiatives and areas for organisational improvement. It includes information about visitors, gross volume, etc. Pitch your topic with ease and precision using this KPI Dashboard For Marketing Website Analytics Summary PDF. This layout presents information on Visitors, Leads, Qualified Leads, Customers, Gross Volume, Successful Payment. It is also available for immediate download and adjustment. So, changes can be made in the color, design, graphics or any other component to create a unique layout.
This slide covers a dashboard for analyzing the metrics of the website landing page. It includes KPIs such as conversions, conversion rate, sessions, bounce rate, engagement sickness, etc. Present like a pro with Marketers Guide To Data Analysis Optimization Website Landing Page KPI Tracking Dashboard Information PDF Create beautiful presentations together with your team, using our easy to use presentation slides. Share your ideas in real time and make changes on the fly by downloading our templates. So whether you are in the office, on the go, or in a remote location, you can stay in sync with your team and present your ideas with confidence. With Slidegeeks presentation got a whole lot easier. Grab these presentations today.
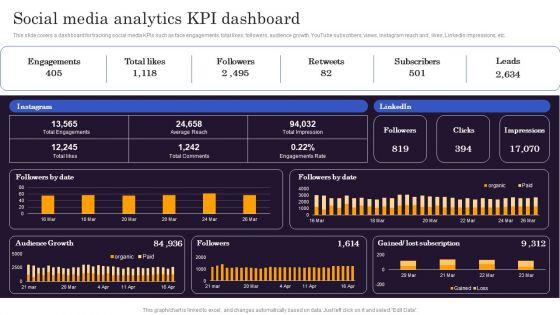

This slide covers a dashboard for tracking social media KPIs such as face engagements, total likes, followers, audience growth, YouTube subscribers, views, Instagram reach and , likes, LinkedIn impressions, etc. Find a pre designed and impeccable Marketers Guide To Data Analysis Optimization Social Media Analytics KPI Dashboard Clipart PDF. The templates can ace your presentation without additional effort. You can download these easy to edit presentation templates to make your presentation stand out from others. So, what are you waiting for Download the template from Slidegeeks today and give a unique touch to your presentation.
This slide covers the KPI dashboard for analyzing SEO metrics such as authority score, organic traffic, organic keywords, paid keywords, ref. Domains, site audit, link-building tool, organic traffic, on-page SEO checker, backlink audit, etc. This Marketers Guide To Data Analysis Optimization KPI Dashboard For Tracking SEO Analytics Template PDF from Slidegeeks makes it easy to present information on your topic with precision. It provides customization options, so you can make changes to the colors, design, graphics, or any other component to create a unique layout. It is also available for immediate download, so you can begin using it right away. Slidegeeks has done good research to ensure that you have everything you need to make your presentation stand out. Make a name out there for a brilliant performance.
This slide covers the dashboard for analyzing paid search metrics such as ad cost, clicks, impressions, click-through rate, cost per conversion, conversion rate, cost per click, etc. Here you can discover an assortment of the finest PowerPoint and Google Slides templates. With these templates, you can create presentations for a variety of purposes while simultaneously providing your audience with an eye catching visual experience. Download Marketers Guide To Data Analysis Optimization KPI Dashboard For Tracking Paid Ad Campaign Performance Clipart PDF to deliver an impeccable presentation. These templates will make your job of preparing presentations much quicker, yet still, maintain a high level of quality. Slidegeeks has experienced researchers who prepare these templates and write high quality content for you. Later on, you can personalize the content by editing the Marketers Guide To Data Analysis Optimization KPI Dashboard For Tracking Paid Ad Campaign Performance Clipart PDF.
This slide covers the dashboard for analyzing email marketing metrics such as overall open rate, click-through rate, click-to-open ratio, unsubscribe rate, hard bounce rate, soft rate, monthly open rate, total monthly subscribers, etc. Presenting this PowerPoint presentation, titled Marketers Guide To Data Analysis Optimization KPI Dashboard For Tracking Email Marketing Campaign Infographics PDF, with topics curated by our researchers after extensive research. This editable presentation is available for immediate download and provides attractive features when used. Download now and captivate your audience. Presenting this Marketers Guide To Data Analysis Optimization KPI Dashboard For Tracking Email Marketing Campaign Infographics PDF. Our researchers have carefully researched and created these slides with all aspects taken into consideration. This is a completely customizable Marketers Guide To Data Analysis Optimization KPI Dashboard For Tracking Email Marketing Campaign Infographics PDF that is available for immediate downloading. Download now and make an impact on your audience. Highlight the attractive features available with our PPTs.
This slide covers the dashboard for analyzing blogging KPIs such as performance, published posts, views, new blog subscribers, top blog posts by pageviews, top blog posts by CTR, etc. Coming up with a presentation necessitates that the majority of the effort goes into the content and the message you intend to convey. The visuals of a PowerPoint presentation can only be effective if it supplements and supports the story that is being told. Keeping this in mind our experts created Marketers Guide To Data Analysis Optimization Dashboard For Tracking Business Blog Kpis Infographics PDF to reduce the time that goes into designing the presentation. This way, you can concentrate on the message while our designers take care of providing you with the right template for the situation.
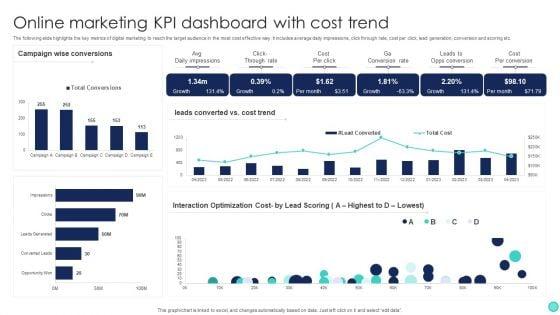

The following slide highlights the key metrics of digital marketing to reach the target audience in the most cost effective way. It includes average daily impressions, click through rate, cost per click, lead generation, conversion and scoring etc. Pitch your topic with ease and precision using this Online Marketing KPI Dashboard With Cost Trend Slides PDF. This layout presents information on Average Daily Impressions, Click Through Rate, Cost Per Click, Lead Generation, Conversion And Scoring. It is also available for immediate download and adjustment. So, changes can be made in the color, design, graphics or any other component to create a unique layout.
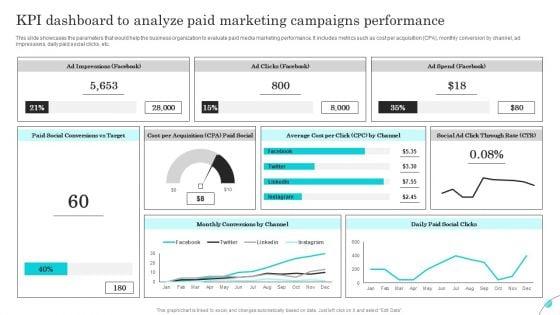

This slide showcases the parameters that would help the business organization to evaluate paid media marketing performance. It includes metrics such as cost per acquisition CPA, monthly conversion by channel, ad impressions, daily paid social clicks, etc. Present like a pro with KPI Dashboard To Analyze Paid Marketing Campaigns Performance Background PDF Create beautiful presentations together with your team, using our easy to use presentation slides. Share your ideas in real time and make changes on the fly by downloading our templates. So whether you are in the office, on the go, or in a remote location, you can stay in sync with your team and present your ideas with confidence. With Slidegeeks presentation got a whole lot easier. Grab these presentations today.
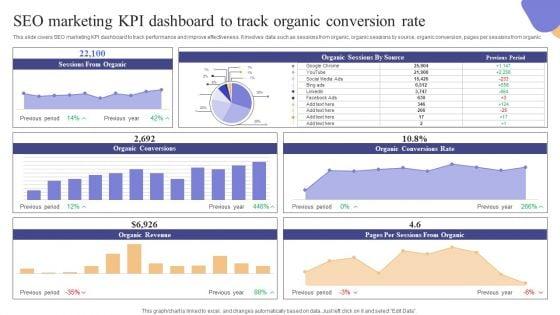

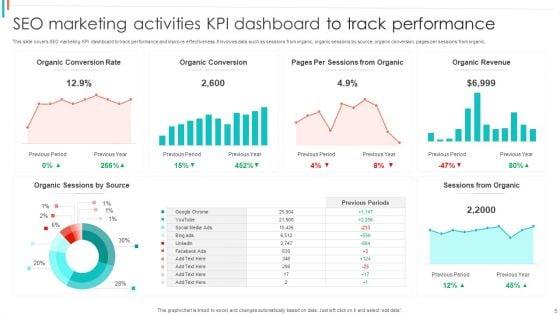
This slide covers SEO marketing KPI dashboard to track performance and improve effectiveness. It involves data such as sessions from organic, organic sessions by source, organic conversion, pages per sessions from organic. Formulating a presentation can take up a lot of effort and time, so the content and message should always be the primary focus. The visuals of the PowerPoint can enhance the presenters message, so our SEO Marketing KPI Dashboard To Track Organic Conversion Rate Microsoft PDF was created to help save time. Instead of worrying about the design, the presenter can concentrate on the message while our designers work on creating the ideal templates for whatever situation is needed. Slidegeeks has experts for everything from amazing designs to valuable content, we have put everything into SEO Marketing KPI Dashboard To Track Organic Conversion Rate Microsoft PDF
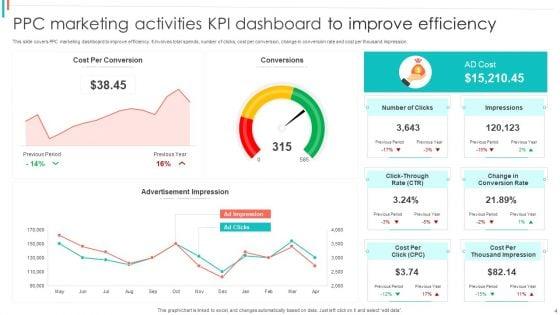
This slide covers PPC marketing dashboard to improve efficiency. It involves total spends, number of clicks, cost per conversion, change in conversion rate and cost per thousand impression. Make sure to capture your audiences attention in your business displays with our gratis customizable PPC Marketing KPI Dashboard To Analyse Strategy Efficiency Icons PDF. These are great for business strategies, office conferences, capital raising or task suggestions. If you desire to acquire more customers for your tech business and ensure they stay satisfied, create your own sales presentation with these plain slides.

This slide covers KPI dashboard to analyse results of conducting market research. It involves details such as brand awareness, sample information and major branding themes. Crafting an eye-catching presentation has never been more straightforward. Let your presentation shine with this tasteful yet straightforward KPI Dashboard To Determine Market Research Results Information PDF template. It offers a minimalistic and classy look that is great for making a statement. The colors have been employed intelligently to add a bit of playfulness while still remaining professional. Construct the ideal KPI Dashboard To Determine Market Research Results Information PDF that effortlessly grabs the attention of your audience Begin now and be certain to wow your customers


Following slide outlines a KPI dashboard which can be used by companies to evaluate the performance of stocks in various sectors. The KPIs mentioned in the slide are total investment in various countries, total portfolio value, yield cost ratio etc. Pitch your topic with ease and precision using this KPI Dashboard To Analyze Share Market Sector Wise Performance Summary PDF. This layout presents information on Sector Sheets, Dividends Vs Unrealized, Investment Style. It is also available for immediate download and adjustment. So, changes can be made in the color, design, graphics or any other component to create a unique layout.
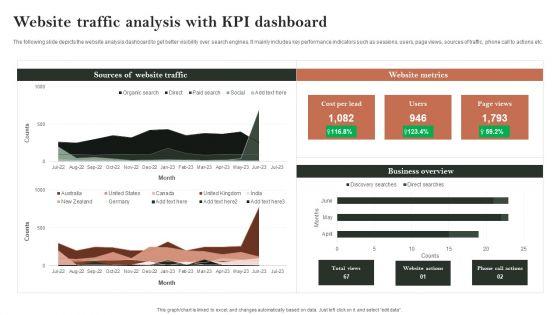

The following slide depicts the website analysis dashboard to get better visibility over search engines. It mainly includes key performance indicators such as sessions, users, page views, sources of traffic, phone call to actions etc. Want to ace your presentation in front of a live audience Our Search Engine Marketing Website Traffic Analysis With KPI Dashboard Brochure PDF can help you do that by engaging all the users towards you.. Slidegeeks experts have put their efforts and expertise into creating these impeccable powerpoint presentations so that you can communicate your ideas clearly. Moreover, all the templates are customizable, and easy-to-edit and downloadable. Use these for both personal and commercial use.
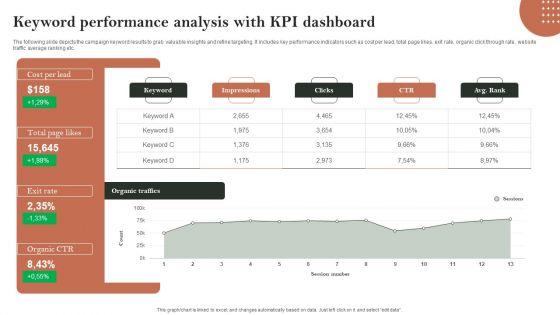
The following slide depicts the campaign keyword results to grab valuable insights and refine targeting. It includes key performance indicators such as cost per lead, total page likes, exit rate, organic click through rate, website traffic average ranking etc. Get a simple yet stunning designed Search Engine Marketing Keyword Performance Analysis With Kpi Dashboard Brochure PDF. It is the best one to establish the tone in your meetings. It is an excellent way to make your presentations highly effective. So, download this PPT today from Slidegeeks and see the positive impacts. Our easy-to-edit Search Engine Marketing Keyword Performance Analysis With Kpi Dashboard Brochure PDF can be your go-to option for all upcoming conferences and meetings. So, what are you waiting for Grab this template today.
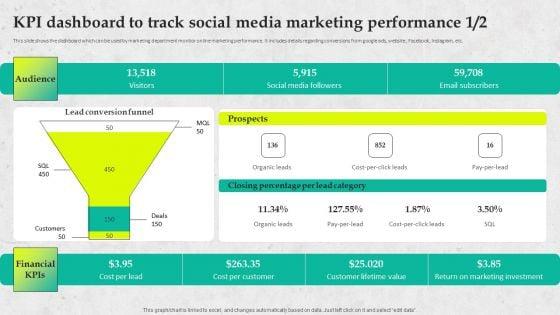
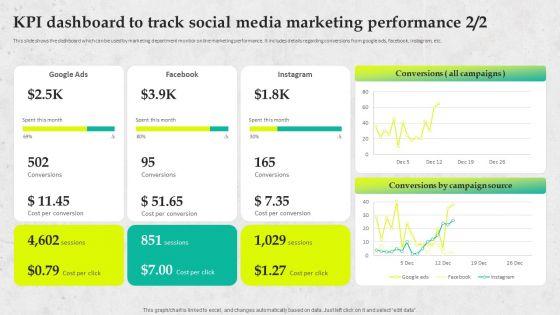
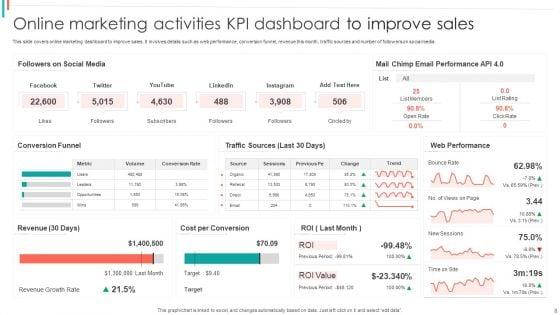
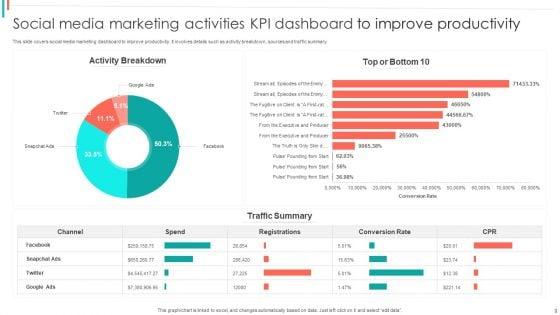
This slide shows the dashboard which can be used by marketing department monitor online marketing performance. It includes details regarding conversions from google ads, website , Facebook, Instagram, etc. Crafting an eye-catching presentation has never been more straightforward. Let your presentation shine with this tasteful yet straightforward Service Promotion Plan KPI Dashboard To Track Social Media Marketing Performance Slides PDF template. It offers a minimalistic and classy look that is great for making a statement. The colors have been employed intelligently to add a bit of playfulness while still remaining professional. Construct the ideal Service Promotion Plan KPI Dashboard To Track Social Media Marketing Performance Slides PDF that effortlessly grabs the attention of your audience Begin now and be certain to wow your customers.
This slide covers the dashboard for analyzing blogging KPIs such as performance, published posts, views, new blog subscribers, top blog posts by pageviews, top blog posts by CTR, etc. Retrieve professionally designed Marketing Success Metrics Dashboard For Tracking Business Blog Kpis Brochure PDF to effectively convey your message and captivate your listeners. Save time by selecting pre-made slideshows that are appropriate for various topics, from business to educational purposes. These themes come in many different styles, from creative to corporate, and all of them are easily adjustable and can be edited quickly. Access them as PowerPoint templates or as Google Slides themes. You dont have to go on a hunt for the perfect presentation because Slidegeeks got you covered from everywhere.
DISPLAYING: 60 of 296 Item(s)
Page