- Sign up
- Sign In
 AI PPT Maker
 Templates
 PPT Bundles
 Design Services
 Business PPTs
 Business Plan
 Management
 Strategy
 Introduction PPT
 Roadmap
 Self Introduction
 Timelines
 Process
 Marketing
 Agenda
 Technology
 Medical
 Startup Business Plan
 Cyber Security
 Dashboards
 SWOT
SWOT Proposals
 Education
 Pitch Deck
 Digital Marketing
 KPIs
KPIs Project Management
 Product Management
 Artificial Intelligence
 Target Market
 Communication
 Supply Chain
 Google Slides
 Research Services
 One Pagers
 All Categories
Graphical-representation PowerPoint Presentation Templates and Google Slides
DISPLAYING: 60 of 128 Item(s)
Page


Pitch yourself both in house and outside by utilizing this complete deck. This graphical representation of research it ppt powerpoint presentation complete with slides focuses on key fundamentals of the topic, displayed using different slides. With a total of forty eight slides, this template is the best tool you can use to persuade your audience. It will not only help you create great presentations but also induce strategic thinking because of its well researched content and graphics. You can easily personalize any of the elements to suit your unique business setting. Additionally, it can be saved in PNG, JPG, and PDF formats to save your time and resources.


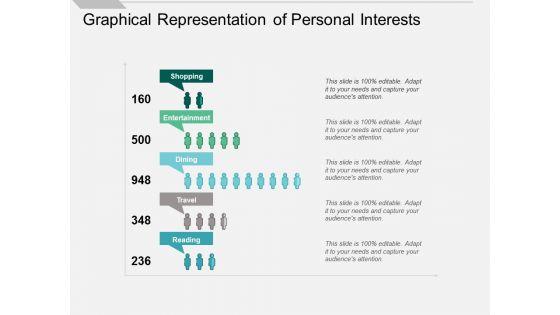


Graphical Representation Of Personal Interests Ppt PowerPoint Presentation Pictures Designs Download
Presenting this set of slides with name graphical representation of personal interests ppt powerpoint presentation pictures designs download. This is a five stage process. The stages in this process are people graph, sales performance, population data demographics. This is a completely editable PowerPoint presentation and is available for immediate download. Download now and impress your audience.


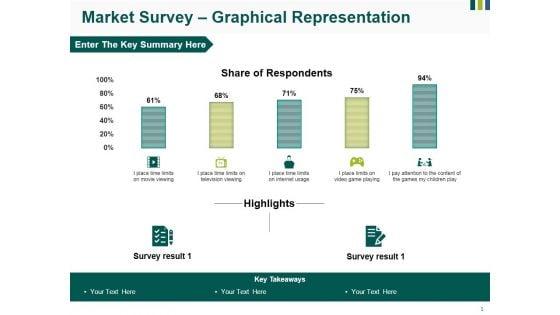


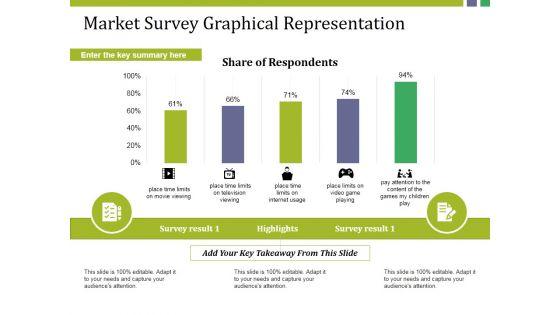


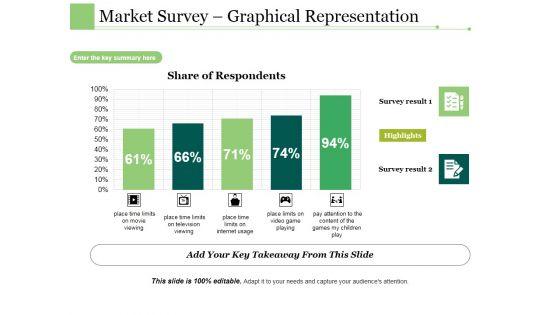


This is a market survey graphical representation ppt powerpoint presentation ideas show. This is a five stage process. The stages in this process are place time limits on movie viewing, place time limits on television viewing, place time limits on internet usage, place limits on video game playing, pay attention to the content of the games my children play.


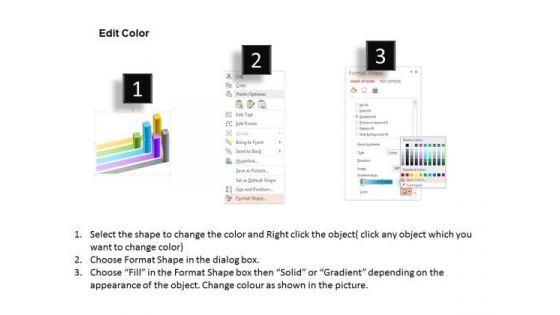
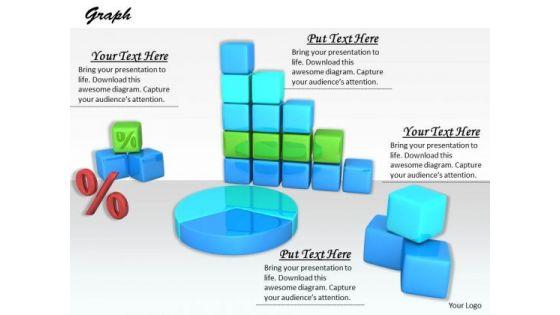
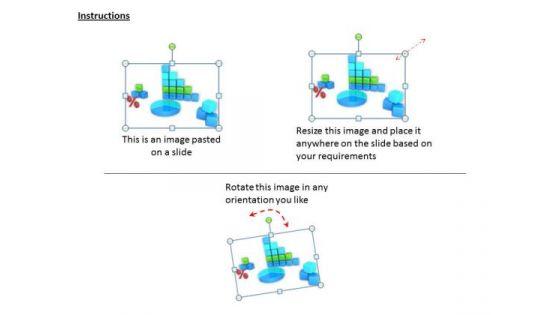
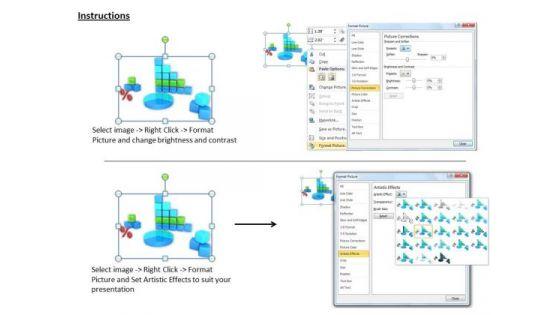
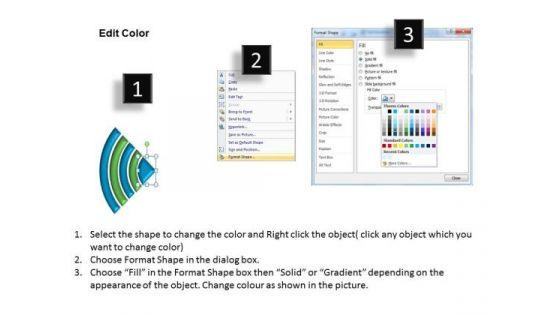
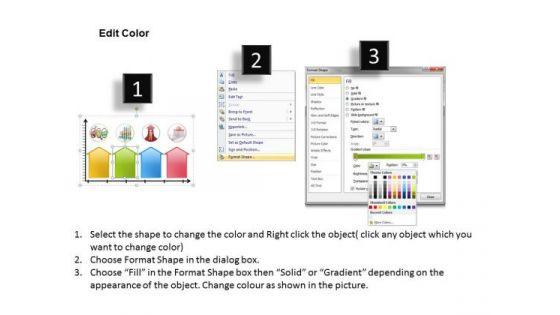
This diagram displays 3d cube steps. This diagram may be used to depict progress, process, stages and steps. You ma change color, size and orientation of any icon to your liking. You may use this diagram in business, marketing and social presentations. This diagram will enhance the quality of your presentations.
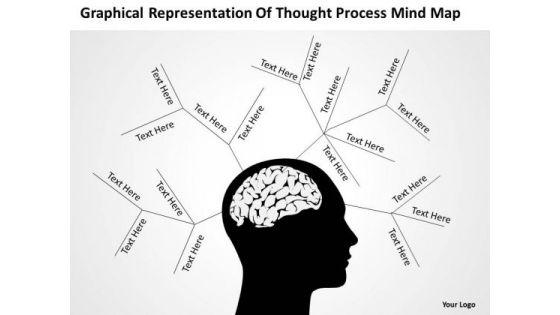
Our Timeline Graphical Representation Of Thought Process Mind Map are the chords of your song. String them along and provide the lilt to your views. Our Timeline Graphical Representation Of Thought Process Mind Map help you pinpoint your timelines. Highlight the reasons for your deadlines with their use.


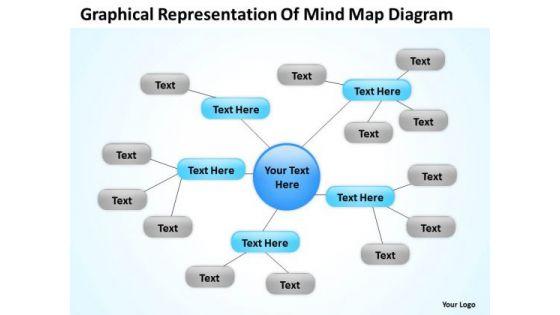
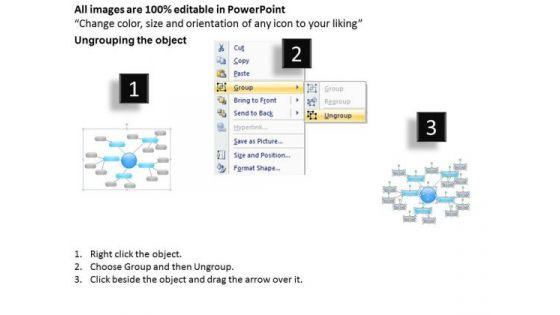
We present our graphical representation of mind map diagram ppt business plan PowerPoint Slides.Download our Business PowerPoint Templates because Our PowerPoint Templates and Slides will let you Hit the target. Go the full distance with ease and elan. Present our Process and Flows PowerPoint Templates because Our PowerPoint Templates and Slides will embellish your thoughts. See them provide the desired motivation to your team. Download and present our Shapes PowerPoint Templates because You can Score a slam dunk with our PowerPoint Templates and Slides. Watch your audience hang onto your every word. Use our Marketing PowerPoint Templates because You should Bet on your luck with our PowerPoint Templates and Slides. Be assured that you will hit the jackpot. Download our Flow Charts PowerPoint Templates because Our PowerPoint Templates and Slides are conceived by a dedicated team. Use them and give form to your wondrous ideas.Use these PowerPoint slides for presentations relating to 3d,process, chart, organization, vision, market, enhance, target, formula, corporate, future, business, plan, success, mindmap, analysis, marketing, relation, idea, solutions, training, guidelines, direction, design,employee, conference, brainstorming, successful, conceptual, financial, action, product, tactic. The prominent colors used in the PowerPoint template are Blue, Gray, Blue light. Our Graphical Representation Of Mind Map Diagram Ppt Business Plan PowerPoint Slides will extend a hand. They provide all the assistance you desire.
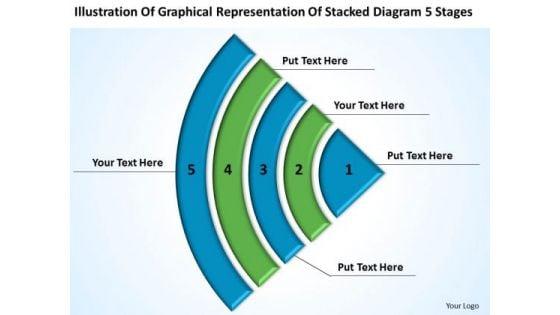
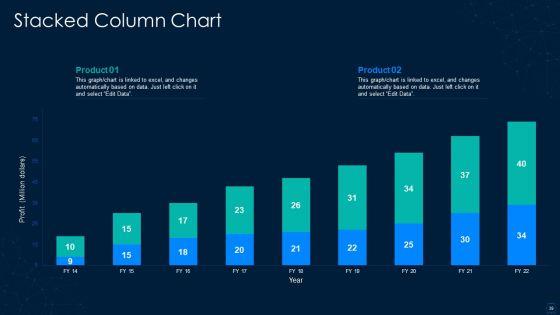
We present our graphical representation stacked diagram 5 stages subway business plan PowerPoint Slides.Use our Business PowerPoint Templates because They will Put the wind in your sails. Skim smoothly over the choppy waters of the market. Use our Leadership PowerPoint Templates because Our PowerPoint Templates and Slides will Activate the energies of your audience. Get their creative juices flowing with your words. Download and present our Targets PowerPoint Templates because You should Press the right buttons with our PowerPoint Templates and Slides. They will take your ideas down the perfect channel. Use our Signs PowerPoint Templates because These PowerPoint Templates and Slides will give the updraft to your ideas. See them soar to great heights with ease. Download and present our Process and Flows PowerPoint Templates because Our PowerPoint Templates and Slides will let your ideas bloom. Create a bed of roses for your audience.Use these PowerPoint slides for presentations relating to team, logo icon, leadership, leader, forward, progress bar, target, circle logo, achievement, business, concept, sign, success, teamwork, symbol, logo design, diagram, circle, graphic, finance, difference, process, goal, marketing, different, development, price, abstract, graph, sectors, illustration, icon, circular, chart, forecast, direction, design, moving, motion, company, competition, progress, profit, increase, background, path, investment, aim, financial, communication. The prominent colors used in the PowerPoint template are Green, Blue, Black. You have been given an exacting task. Plan your approach with our Graphical Representation Stacked Diagram 5 Stages Subway Business Plan PowerPoint Slides.
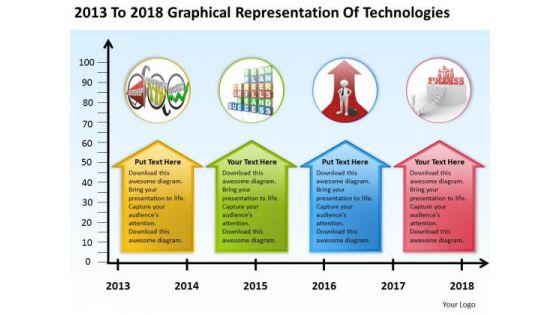
We present our 2013 To 2018 Graphical Representation Of Technologies PowerPoint Templates PPT Slides Graphics.Present our Marketing PowerPoint Templates because You can Double your output with our PowerPoint Templates and Slides. They make beating deadlines a piece of cake. Present our Timelines PowerPoint Templates because Our PowerPoint Templates and Slides will give good value for money. They also have respect for the value of your time. Use our Business PowerPoint Templates because Our PowerPoint Templates and Slides come in all colours, shades and hues. They help highlight every nuance of your views. Download our Arrows PowerPoint Templates because You can Channelise the thoughts of your team with our PowerPoint Templates and Slides. Urge them to focus on the goals you have set. Present our Time planning PowerPoint Templates because These PowerPoint Templates and Slides will give the updraft to your ideas. See them soar to great heights with ease.Use these PowerPoint slides for presentations relating to Art, Background, Button, Call, City, Colorful, Concept, Country, Destination, Editable, Flag, Fuel, Geography, Graphic, Home, Icon, Illustration, Journey, Land, Locate, Location, Macro, Map, Mapping, Mark, Navigate, Needle, Petrol, Pin, Pinpoint, Place, Pointing, Pump, Push, Pushpin, Restaurant, Road, Roadmap, Service, Set, Shiny, Space, Symbol, Town, Travel, Trip. The prominent colors used in the PowerPoint template are Green, Yellow, Red. Realise fantasies with our 2013 To 2018 Graphical Representation Of Technologies PowerPoint Templates Ppt Slides Graphics. Actualise your dreams with their help.
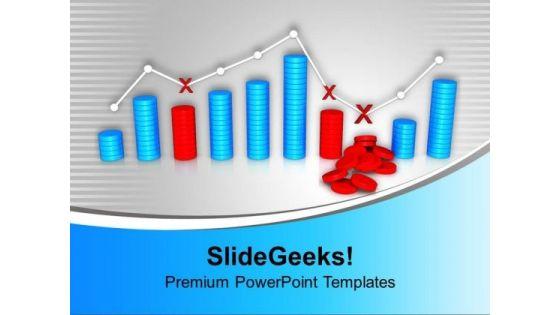
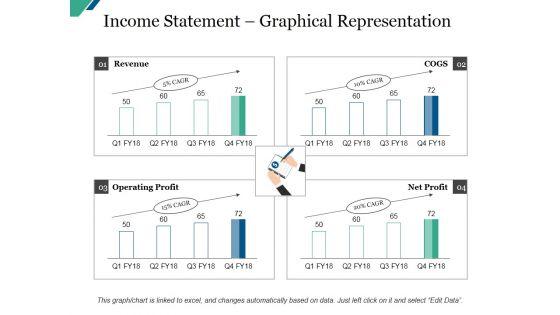
We present our Graphical Representation Of Profit Business PowerPoint Templates PPT Backgrounds For Slides 1112.Use our Marketing PowerPoint Templates because networking is an imperative in todays world. You need to access the views of others. Similarly you need to give access to them of your abilities. Present our Business PowerPoint Templates because you have had a great year or so business wise. It is time to celebrate the efforts of your team. Use our Finance PowerPoint Templates because you have some excellent plans to spread some more of it across your community. Download and present our Future PowerPoint Templates because let this slide illustrates others piggyback on you to see well over the horizon. Present our Shapes PowerPoint Templates because they help to lay the base of your trend of thought.Use these PowerPoint slides for presentations relating to Profit and loss graph, business, shapes, finance, future, marketing. The prominent colors used in the PowerPoint template are Blue light, Red, Gray. People tell us our Graphical Representation Of Profit And Loss Business PowerPoint Templates PPT Backgrounds For Slides 1112 are readymade to fit into any presentation structure. Presenters tell us our shapes PowerPoint templates and PPT Slides are Ultra. PowerPoint presentation experts tell us our Graphical Representation Of Profit And Loss Business PowerPoint Templates PPT Backgrounds For Slides 1112 will impress their bosses and teams. Customers tell us our marketing PowerPoint templates and PPT Slides will generate and maintain the level of interest you desire. They will create the impression you want to imprint on your audience. Customers tell us our Graphical Representation Of Profit And Loss Business PowerPoint Templates PPT Backgrounds For Slides 1112 are Wistful. Customers tell us our finance PowerPoint templates and PPT Slides are the best it can get when it comes to presenting. Enthral your listeners with your suggestions. Keep them clued in with our Graphical Representation Of Profit Business PowerPoint Templates Ppt Backgrounds For Slides 1112.
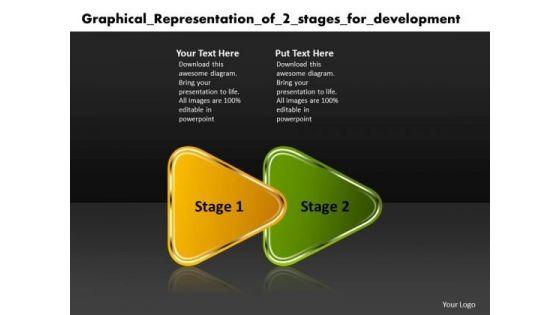
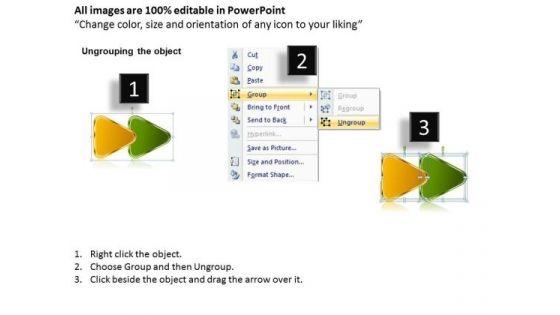
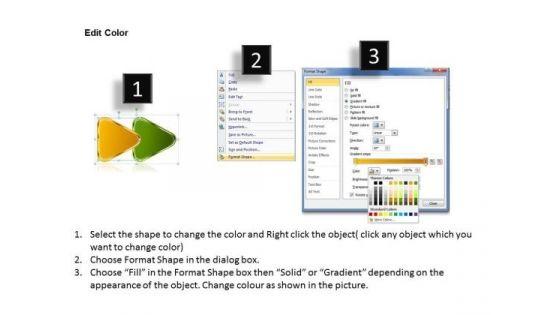
We present our graphical representation of 2 stages for development electronic circuit design PowerPoint templates.Use our Business PowerPoint Templates because,Like the famed William Tell, they put aside all emotions and concentrate on the target. Use our Arrows PowerPoint Templates because,You will be able to Highlight the various ways in which we can maintain its efficiency. Use our Shapes PowerPoint Templates because,our templates emphasises your views. Use our Design PowerPoint Templates because,Using our templates for your colleagues will impart knowledge tofeed. Use our Abstract PowerPoint Templates because, You can Be the cynosure of all eyes with our template depicting .Use these PowerPoint slides for presentations relating to algorithm, arrow, arrows, block, business, chart, connection, design, development, diagram, direction, element, flow, flowchart, graph, kind, linear, management, of, organization, process, program, section, segment, set, sign, solution, strategy, symbol. The prominent colors used in the PowerPoint template are Yellow, Green, Black. People tell us our graphical representation of 2 stages for development electronic circuit design PowerPoint templates are Whimsical. The feedback we get is that our arrows PowerPoint templates and PPT Slides are Efficacious. People tell us our graphical representation of 2 stages for development electronic circuit design PowerPoint templates are Pretty. Presenters tell us our arrows PowerPoint templates and PPT Slides are Adorable. The feedback we get is that our graphical representation of 2 stages for development electronic circuit design PowerPoint templates will make the presenter successul in his career/life. Professionals tell us our design PowerPoint templates and PPT Slides are Magical. Present to top tier executives with our Graphical Representation Of 2 Stages For Development Electronic Circuit Design PowerPoint Templates. They will make you look good.
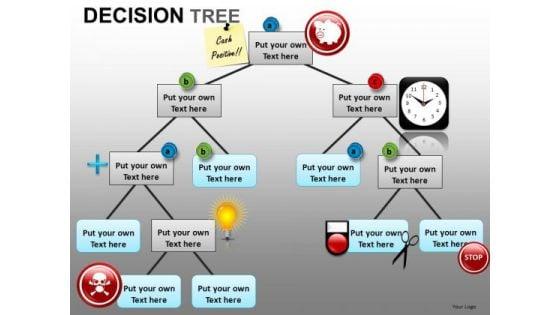
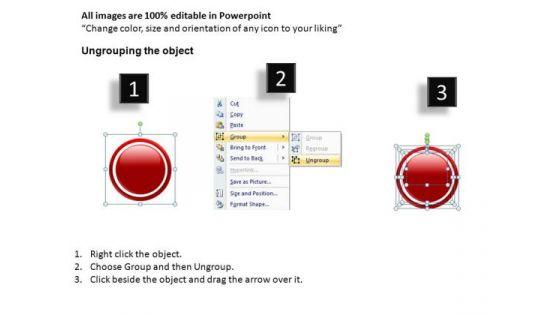
PowerPoint Slides with Decision tree Graphical representation-These high quality powerpoint pre-designed slides and powerpoint templates have been carefully created by our professional team to help you impress your audience. All slides have been created and are 100% editable in powerpoint. Each and every property of any graphic - color, size, orientation, shading, outline etc. can be modified to help you build an effective powerpoint presentation. Any text can be entered at any point in the powerpoint template or slide. Simply DOWNLOAD, TYPE and PRESENT! Exhibit high fibre with our PowerPoint Slides With Decision Tree Graphical Representation. They display your fearless character.


This slide showcases a graphical representation of various sectors which employ attended automation for streamlining business activities. The sectors consist of information technology, human resources, finance, sales etc. Pitch your topic with ease and precision using this Graphical Representation Of Sectors Deploying Robotic Desktop Automation Formats PDF. This layout presents information on Productivity, Cost Reductions, Finance. It is also available for immediate download and adjustment. So, changes can be made in the color, design, graphics or any other component to create a unique layout.
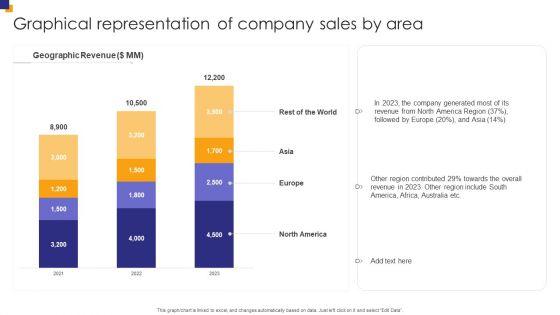

Showcasing this set of slides titled Graphical Representation Of Company Sales By Area Elements PDF. The topics addressed in these templates are Region Contributed, America Region, Include South. All the content presented in this PPT design is completely editable. Download it and make adjustments in color, background, font etc. as per your unique business setting.


Showcasing this set of slides titled Graphical Representation Of Firm Business Sales Highlights Pictures PDF. The topics addressed in these templates are Average Revenue Per Unit, Customer Acquisition Cost, Sale Revenue. All the content presented in this PPT design is completely editable. Download it and make adjustments in color, background, font etc. as per your unique business setting.
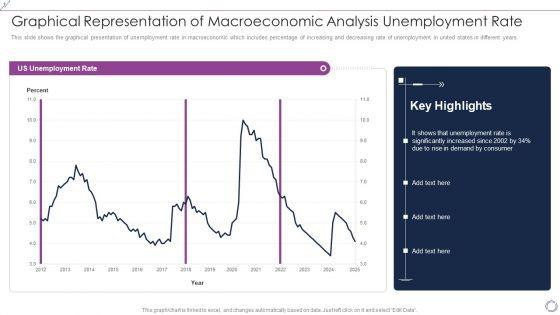
This slide shows the graphical presentation of unemployment rate in macroeconomic which includes percentage of increasing and decreasing rate of unemployment in united states in different years. Showcasing this set of slides titled Graphical Representation Of Macroeconomic Analysis Unemployment Rate Slides PDF. The topics addressed in these templates are US Unemployment Rate, Consumer. All the content presented in this PPT design is completely editable. Download it and make adjustments in color, background, font etc. as per your unique business setting.

This slide shows the graphical representation of international labour market in terms of high, middle and low-skilled workers which affects the production capacity of different industries that adversely affects the national income of the economy. Pitch your topic with ease and precision using this Graphical Representation Of International Macroeconomic Analysis Labour Market Diagrams PDF. This layout presents information on High Skilled, Middle Skilled, Low Skilled. It is also available for immediate download and adjustment. So, changes can be made in the color, design, graphics or any other component to create a unique layout.
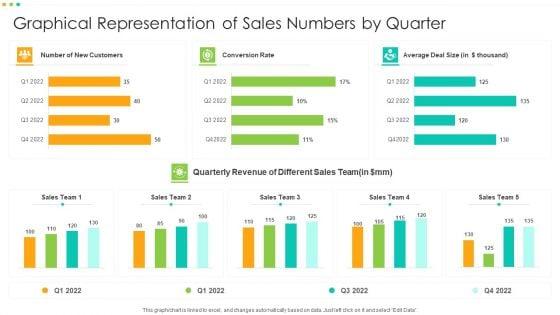
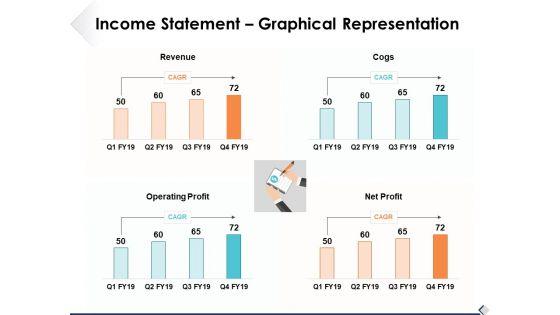
Showcasing this set of slides titled Graphical Representation Of Sales Numbers By Quarter Template PDF. The topics addressed in these templates are Graphical Representation Of Sales Numbers By Quarter. All the content presented in this PPT design is completely editable. Download it and make adjustments in color, background, font etc. as per your unique business setting.
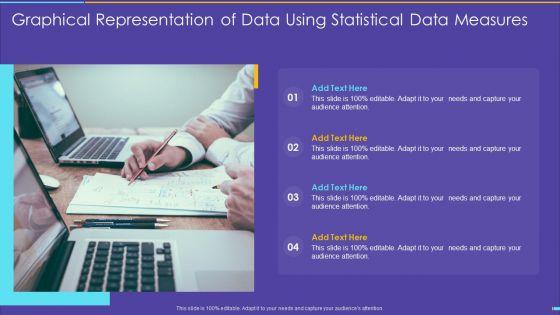
Persuade your audience using this graphical representation of data using statistical data measures elements pdf. This PPT design covers four stages, thus making it a great tool to use. It also caters to a variety of topics including graphical representation of data using statistical data measures. Download this PPT design now to present a convincing pitch that not only emphasizes the topic but also showcases your presentation skills.
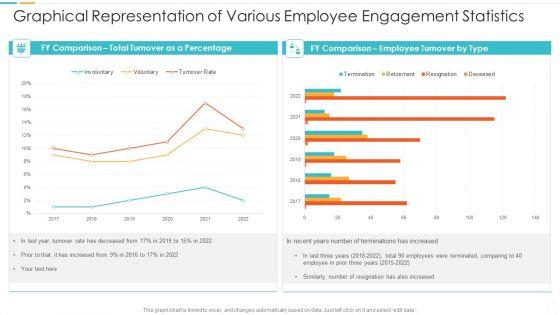
Showcasing this set of slides titled graphical representation of various employee engagement statistics microsoft pdf. The topics addressed in these templates are graphical representation of various employee engagement statistics. All the content presented in this PPT design is completely editable. Download it and make adjustments in color, background, font etc. as per your unique business setting.


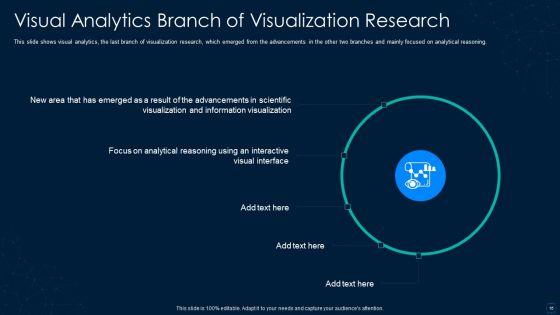
This slide shows visual analytics, the last branch of visualization research, which emerged from the advancements in the other two branches and mainly focused on analytical reasoning. This is a graphical representation of research it visual analytics branch background pdf template with various stages. Focus and dispense information on five stages using this creative set, that comes with editable features. It contains large content boxes to add your information on topics like visual analytics branch of visualization research. You can also showcase facts, figures, and other relevant content using this PPT layout. Grab it now.
This slide depicts the univariate analysis technique for data visualization, including distribution, box and whisker, and the violin plot. Presenting graphical representation of research it univariate analysis techniques icons pdf to provide visual cues and insights. Share and navigate important information on three stages that need your due attention. This template can be used to pitch topics like information, supplies, information, target. In addtion, this PPT design contains high resolution images, graphics, etc, that are easily editable and available for immediate download.
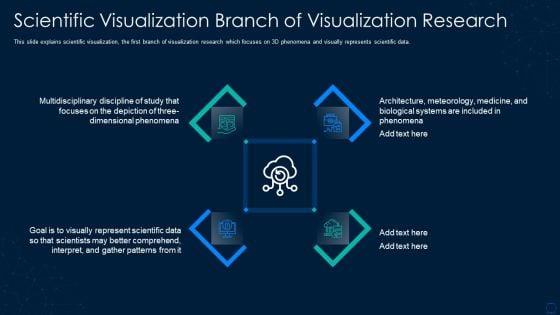
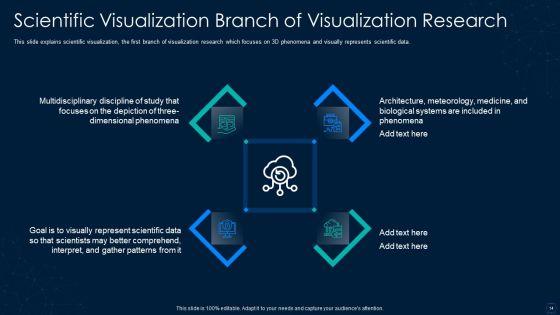
This slide explains scientific visualization, the first branch of visualization research which focuses on 3D phenomena and visually represents scientific data. This is a graphical representation of research it scientific visualization branch information pdf template with various stages. Focus and dispense information on four stages using this creative set, that comes with editable features. It contains large content boxes to add your information on topics like scientific visualization branch of visualization research. You can also showcase facts, figures, and other relevant content using this PPT layout. Grab it now.


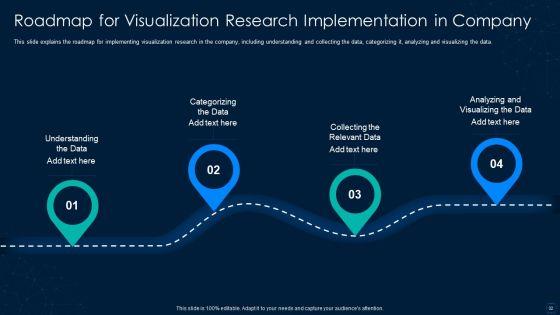
This slide explains the roadmap for implementing visualization research in the company, including understanding and collecting the data, categorizing it, analyzing and visualizing the data. Presenting graphical representation of research it roadmap for visualization research summary pdf to provide visual cues and insights. Share and navigate important information on four stages that need your due attention. This template can be used to pitch topics like roadmap for visualization research implementation in company. In addtion, this PPT design contains high resolution images, graphics, etc, that are easily editable and available for immediate download.
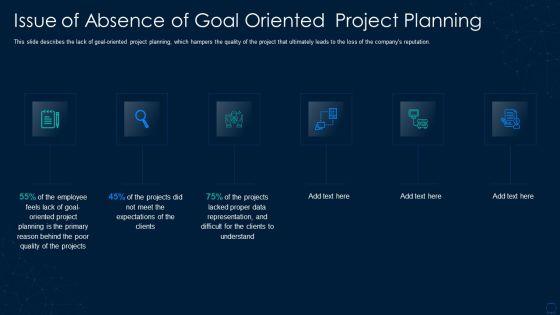

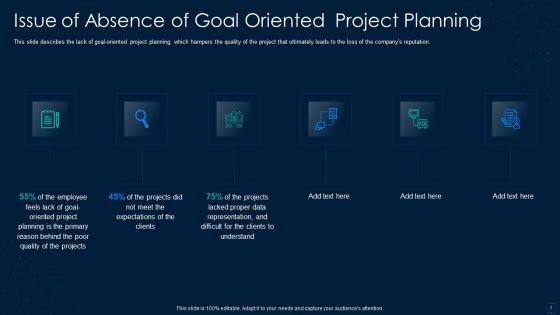
This is a graphical representation of research it issue of absence of goal designs pdf template with various stages. Focus and dispense information on six stages using this creative set, that comes with editable features. It contains large content boxes to add your information on topics like planning, projects, quality. You can also showcase facts, figures, and other relevant content using this PPT layout. Grab it now.
This slide explains information visualization as a branch of visualization research that includes visuals like histograms, trend graphs, flow charts. Presenting graphical representation of research it information visualization research branch icons pdf to provide visual cues and insights. Share and navigate important information on four stages that need your due attention. This template can be used to pitch topics like geographic, information, design. In addtion, this PPT design contains high resolution images, graphics, etc, that are easily editable and available for immediate download.
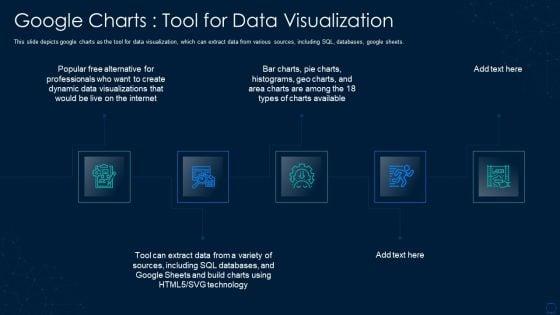

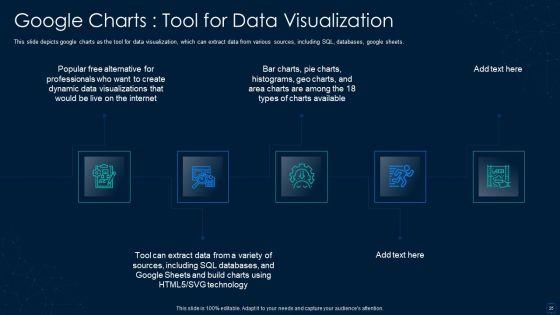
This slide depicts google charts as the tool for data visualization, which can extract data from various sources, including SQL, databases, google sheets. This is a graphical representation of research it google charts tool for data visualization introduction pdf template with various stages. Focus and dispense information on five stages using this creative set, that comes with editable features. It contains large content boxes to add your information on topics like dynamic, databases, sources, technology. You can also showcase facts, figures, and other relevant content using this PPT layout. Grab it now.


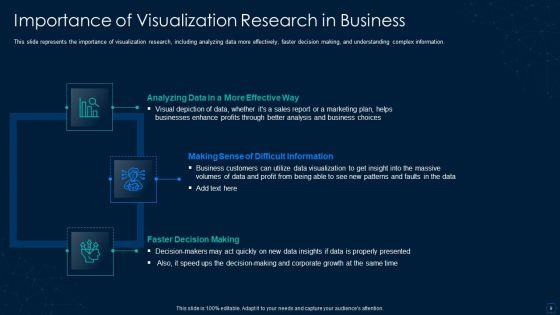
This slide describes that using visualization in academic areas caters to easy detection of trendy data sets and helps understand the data. Presenting graphical representation of research it data visualization helps in academic research microsoft pdf to provide visual cues and insights. Share and navigate important information on six stages that need your due attention. This template can be used to pitch topics like data visualization helps in academic research. In addtion, this PPT design contains high resolution images, graphics, etc, that are easily editable and available for immediate download.
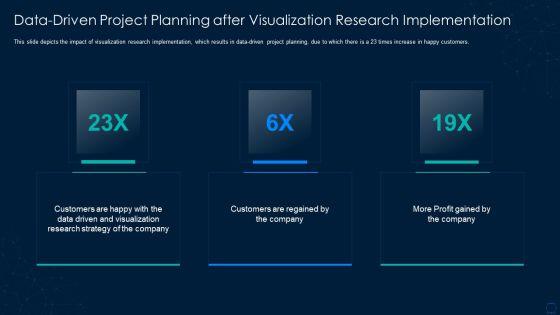
This slide depicts the impact of visualization research implementation, which results in data driven project planning, due to which there is a 23 times increase in happy customers. This is a graphical representation of research it data driven project planning structure pdf template with various stages. Focus and dispense information on three stages using this creative set, that comes with editable features. It contains large content boxes to add your information on topics like profit, customers, strategy. You can also showcase facts, figures, and other relevant content using this PPT layout. Grab it now.
DISPLAYING: 60 of 128 Item(s)
Page