- Sign up
- Sign In
 AI PPT Maker
 Templates
 PPT Bundles
 Design Services
 Business PPTs
 Business Plan
 Management
 Strategy
 Introduction PPT
 Roadmap
 Self Introduction
 Timelines
 Process
 Marketing
 Agenda
 Technology
 Medical
 Startup Business Plan
 Cyber Security
 Dashboards
 SWOT
SWOT Proposals
 Education
 Pitch Deck
 Digital Marketing
 KPIs
KPIs Project Management
 Product Management
 Artificial Intelligence
 Target Market
 Communication
 Supply Chain
 Google Slides
 Research Services
 One Pagers
 All Categories
Kpis for business PowerPoint Presentation Templates and Google Slides
DISPLAYING: 60 of 159 Item(s)
Page


Improve your presentation delivery using this Success Kpis For Business Analytics Transformation Ppt PowerPoint Presentation Complete With Slides. Support your business vision and objectives using this well-structured PPT deck. This template offers a great starting point for delivering beautifully designed presentations on the topic of your choice. Comprising fifteen this professionally designed template is all you need to host discussion and meetings with collaborators. Each slide is self-explanatory and equipped with high-quality graphics that can be adjusted to your needs. Therefore, you will face no difficulty in portraying your desired content using this PPT slideshow. This PowerPoint slideshow contains every important element that you need for a great pitch. It is not only editable but also available for immediate download and utilization. The color, font size, background, shapes everything can be modified to create your unique presentation layout. Therefore, download it now.
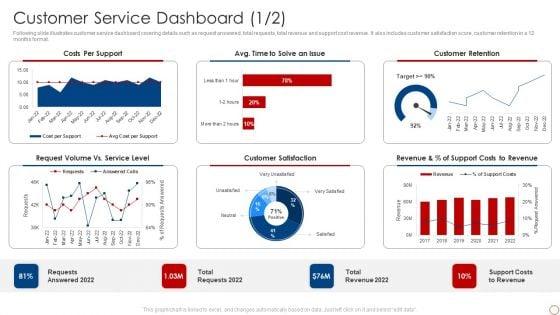
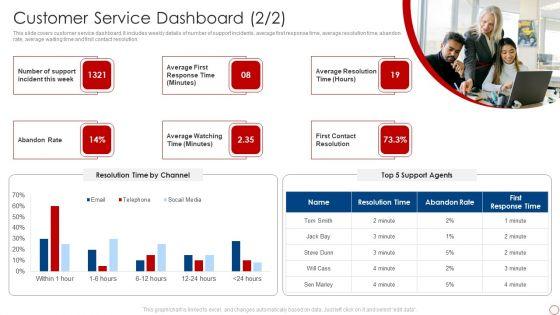
Following slide illustrates customer service dashboard covering details such as request answered, total requests, total revenue and support cost revenue. It also includes customer satisfaction score, customer retention in a 12 months format. Deliver and pitch your topic in the best possible manner with this Kpis For Evaluating Business Sustainability Customer Service Dashboard Designs PDF. Use them to share invaluable insights on Costs Per Support, Customer Retention, Customer Satisfaction and impress your audience. This template can be altered and modified as per your expectations. So, grab it now.
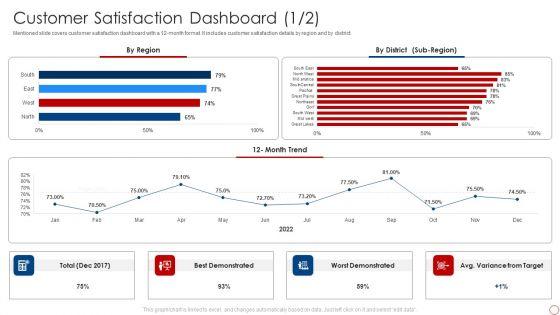


Mentioned slide covers customer satisfaction dashboard with a 12-month format. It includes customer satisfaction details by region and by district. Deliver an awe inspiring pitch with this creative Kpis For Evaluating Business Sustainability Customer Satisfaction Dashboard Clipart PDF bundle. Topics like Best Demonstrated, Worst Demonstrated, 12 Month Trend can be discussed with this completely editable template. It is available for immediate download depending on the needs and requirements of the user.


Following slide covers cash flow dashboard covering details like beginning cash on hand, cash going in, cash going out, profit or loss and ending cash on hand. It also includes detail of accounts receivable and payable. Deliver an awe inspiring pitch with this creative Kpis For Evaluating Business Sustainability Cash Flow Dashboard Background PDF bundle. Topics like Accounts Receivable, Accounts Payable, Cash Flow can be discussed with this completely editable template. It is available for immediate download depending on the needs and requirements of the user.


This slide portrays key performance dashboard for measuring retail business performance. KPIs covered in the dashboards are average shopping time, shop visitors, average basket spend and customer retention. If you are looking for a format to display your unique thoughts, then the professionally designed Enhancing Retail Process By Effective Inventory Management KPI Dashboard For Retail Business Inspiration PDF is the one for you. You can use it as a Google Slides template or a PowerPoint template. Incorporate impressive visuals, symbols, images, and other charts. Modify or reorganize the text boxes as you desire. Experiment with shade schemes and font pairings. Alter, share or cooperate with other people on your work. Download Enhancing Retail Process By Effective Inventory Management KPI Dashboard For Retail Business Inspiration PDF and find out how to give a successful presentation. Present a perfect display to your team and make your presentation unforgettable.
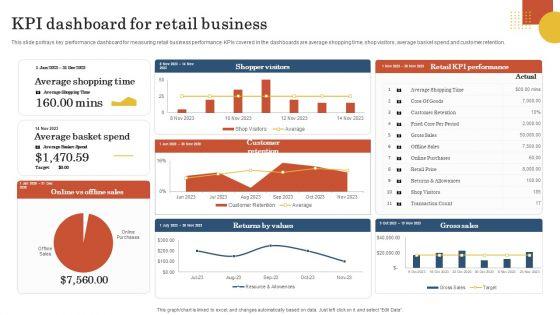

This slide portrays key performance dashboard for measuring retail business performance. KPIs covered in the dashboards are average shopping time, shop visitors, average basket spend and customer retention. Are you in need of a template that can accommodate all of your creative concepts This one is crafted professionally and can be altered to fit any style. Use it with Google Slides or PowerPoint. Include striking photographs, symbols, depictions, and other visuals. Fill, move around, or remove text boxes as desired. Test out color palettes and font mixtures. Edit and save your work, or work with colleagues. Download Retail Business Operation Management To Optimize Customer Experience KPI Dashboard For Retail Business Download PDF and observe how to make your presentation outstanding. Give an impeccable presentation to your group and make your presentation unforgettable.

Following slide showcases KPI dashboard to determine best market for launching new business. It includes key components such as growth rate by different industries, best states to launch startup, sales forecast, market growth forecast, projected sales by different states. Showcasing this set of slides titled KPI Dashboard To Track Best Market Opportunities For New Established Business Pictures PDF. The topics addressed in these templates are Forecasted Sales, Growth Rate, Startup Industries. All the content presented in this PPT design is completely editable. Download it and make adjustments in color, background, font etc. as per your unique business setting.


Following slide demonstrate KPI dashboard to determine target audience which can be used by businesses for startup growth. It includes key components such as target audience age, target audience gender, target audience interest, target audience social media interest, target audience location, etc. Showcasing this set of slides titled KPI Dashboard To Identify Target Market For New Established Business Formats PDF. The topics addressed in these templates are Target Audience Age, Target Audience Interest, Target Audience Location. All the content presented in this PPT design is completely editable. Download it and make adjustments in color, background, font etc. as per your unique business setting.


This slide portrays key performance dashboard for measuring retail business performance. KPIs covered in the dashboards are average shopping time, shop visitors, average basket spend and customer retention. Boost your pitch with our creative Retail Business Optimization Through Operational Excellence Strategy KPI Dashboard For Retail Business Mockup PDF. Deliver an awe-inspiring pitch that will mesmerize everyone. Using these presentation templates you will surely catch everyones attention. You can browse the ppts collection on our website. We have researchers who are experts at creating the right content for the templates. So you do not have to invest time in any additional work. Just grab the template now and use them.
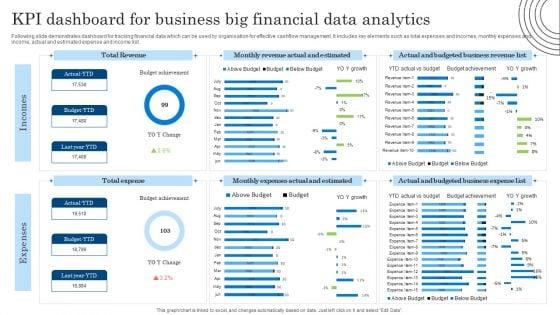
Following slide demonstrates dashboard for tracking financial data which can be used by organisation for effective cashflow management. It includes key elements such as total expenses and incomes, monthly expenses and income, actual and estimated expense and income list. Showcasing this set of slides titled KPI Dashboard For Business Big Financial Data Analytics Diagrams PDF. The topics addressed in these templates are KPI Dashboard, Business Big Financial, Data Analytics. All the content presented in this PPT design is completely editable. Download it and make adjustments in color, background, font etc. as per your unique business setting.
This slide covers the dashboard for analyzing blogging KPIs such as performance, published posts, views, new blog subscribers, top blog posts by pageviews, top blog posts by CTR, etc. Coming up with a presentation necessitates that the majority of the effort goes into the content and the message you intend to convey. The visuals of a PowerPoint presentation can only be effective if it supplements and supports the story that is being told. Keeping this in mind our experts created Marketers Guide To Data Analysis Optimization Dashboard For Tracking Business Blog Kpis Infographics PDF to reduce the time that goes into designing the presentation. This way, you can concentrate on the message while our designers take care of providing you with the right template for the situation.


This slide represents the dashboard representing key metrics to analyze the performance of overall workforce. It includes details related to absence rate, benefits satisfaction, engagement index etc. Here you can discover an assortment of the finest PowerPoint and Google Slides templates. With these templates, you can create presentations for a variety of purposes while simultaneously providing your audience with an eye-catching visual experience. Download Tools For HR Business Analytics Workforce Performance Analysis KPI Dashboard Pictures PDF to deliver an impeccable presentation. These templates will make your job of preparing presentations much quicker, yet still, maintain a high level of quality. Slidegeeks has experienced researchers who prepare these templates and write high-quality content for you. Later on, you can personalize the content by editing the Tools For HR Business Analytics Workforce Performance Analysis KPI Dashboard Pictures PDF.
This slide covers the dashboard for analyzing blogging KPIs such as performance, published posts, views, new blog subscribers, top blog posts by pageviews, top blog posts by CTR, etc. Retrieve professionally designed Marketing Success Metrics Dashboard For Tracking Business Blog Kpis Brochure PDF to effectively convey your message and captivate your listeners. Save time by selecting pre-made slideshows that are appropriate for various topics, from business to educational purposes. These themes come in many different styles, from creative to corporate, and all of them are easily adjustable and can be edited quickly. Access them as PowerPoint templates or as Google Slides themes. You dont have to go on a hunt for the perfect presentation because Slidegeeks got you covered from everywhere.


This slide portrays key performance dashboard for measuring retail business performance. Kpis covered in the dashboards are average shopping time, shop visitors, average basket spend and customer retention. Explore a selection of the finest Optimizing And Managing Retail Kpi Dashboard For Retail Business Clipart PDF here. With a plethora of professionally designed and pre-made slide templates, you can quickly and easily find the right one for your upcoming presentation. You can use our Optimizing And Managing Retail Kpi Dashboard For Retail Business Clipart PDF to effectively convey your message to a wider audience. Slidegeeks has done a lot of research before preparing these presentation templates. The content can be personalized and the slides are highly editable. Grab templates today from Slidegeeks.


This slide covers the dashboard that depicts metrics to track company sales performance that focuses on number of sales, cost breakdown, accumulated revenues, incremental sales, etc. Are you in need of a template that can accommodate all of your creative concepts This one is crafted professionally and can be altered to fit any style. Use it with Google Slides or PowerPoint. Include striking photographs, symbols, depictions, and other visuals. Fill, move around, or remove text boxes as desired. Test out color palettes and font mixtures. Edit and save your work, or work with colleagues. Download Digital Transition Plan For Managing Business Dashboard Depicting Kpis To Track Sales Performance Guidelines PDF and observe how to make your presentation outstanding. Give an impeccable presentation to your group and make your presentation unforgettable.
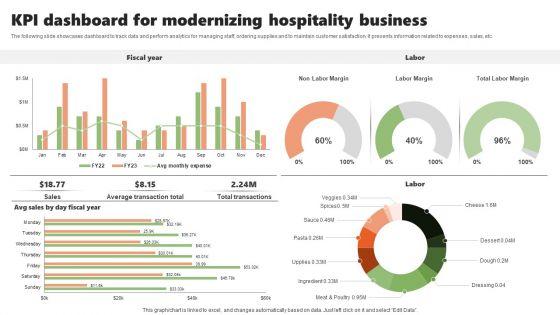
The following slide showcases dashboard to track data and perform analytics for managing staff, ordering supplies and to maintain customer satisfaction. It presents information related to expenses, sales, etc. Pitch your topic with ease and precision using this KPI Dashboard For Modernizing Hospitality Business Inspiration PDF. This layout presents information on Fiscal Year, Labor, Modernizing Hospitality. It is also available for immediate download and adjustment. So, changes can be made in the color, design, graphics or any other component to create a unique layout.


The following slide depicts the key outcomes of SMS promotion strategy to track its effectiveness. It includes elements such as sales graph, metrics, order, marketing subscribers, average order value, SMS sent, revenue per click, conversion rate, return on investment etc. Slidegeeks is here to make your presentations a breeze with Mobile Promotion Strategic Guide For Micro Businesses Sms Marketing Result Assessment With Kpi Dashboard Slides PDF With our easy to use and customizable templates, you can focus on delivering your ideas rather than worrying about formatting. With a variety of designs to choose from, you are sure to find one that suits your needs. And with animations and unique photos, illustrations, and fonts, you can make your presentation pop. So whether you are giving a sales pitch or presenting to the board, make sure to check out Slidegeeks first.
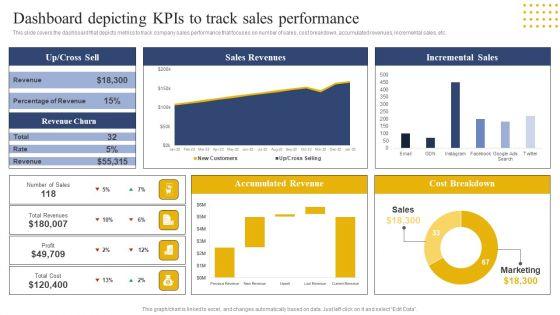

This slide covers the dashboard that depicts metrics to track company sales performance that focuses on number of sales, cost breakdown, accumulated revenues, incremental sales, etc. From laying roadmaps to briefing everything in detail, our templates are perfect for you. You can set the stage with your presentation slides. All you have to do is download these easy-to-edit and customizable templates. Transition Plan For Business Management Dashboard Depicting Kpis To Track Sales Performance Template PDF will help you deliver an outstanding performance that everyone would remember and praise you for. Do download this presentation today.
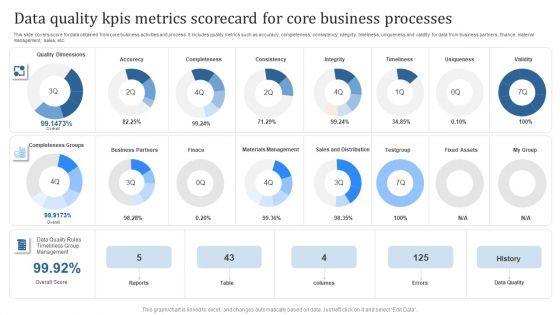

This slide covers score for data obtained from core business activities and process. It includes quality metrics such as accuracy, completeness, consistency, integrity, timeliness, uniqueness and validity for data from business partners, finance, material management, sales, etc. Showcasing this set of slides titled Data Quality Kpis Metrics Scorecard For Core Business Processes Topics PDF. The topics addressed in these templates are Data Quality, Errors, Reports. All the content presented in this PPT design is completely editable. Download it and make adjustments in color, background, font etc. as per your unique business setting.
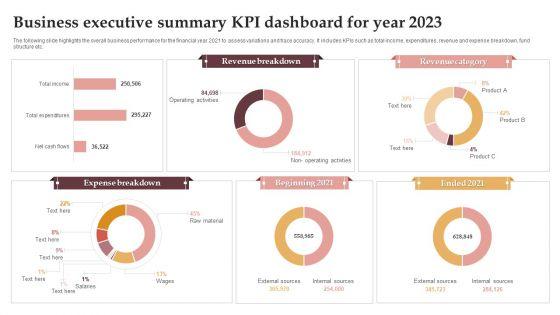

The following slide highlights the overall business performance for the financial year 2021 to assess variations and trace accuracy. It includes KPIs such as total income, expenditures, revenue and expense breakdown, fund structure etc. Pitch your topic with ease and precision using this Business Executive Summary KPI Dashboard For Year 2023 Graphics PDF. This layout presents information on Revenue Breakdown, Revenue Category, Expense Breakdown. It is also available for immediate download and adjustment. So, changes can be made in the color, design, graphics or any other component to create a unique layout.


This slide showcases dashboard that can help organization to evaluate key changes in financial kpis post fundraising. Its key components are net profit margin, revenue, gross profit margin, debt to equity and return on equity. This Assessing Debt And Equity Fundraising Alternatives For Business Growth Financial KPI Dashboard To Evaluate Infographics PDF is perfect for any presentation, be it in front of clients or colleagues. It is a versatile and stylish solution for organizing your meetings. TheAssessing Debt And Equity Fundraising Alternatives For Business Growth Financial KPI Dashboard To Evaluate Infographics PDF features a modern design for your presentation meetings. The adjustable and customizable slides provide unlimited possibilities for acing up your presentation. Slidegeeks has done all the homework before launching the product for you. So, do not wait, grab the presentation templates today
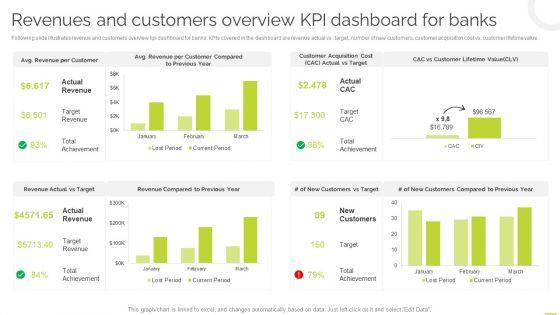

Following slide illustrates revenue and customers overview kpi dashboard for banks. KPIs covered in the dashboard are revenue actual vs target, number of new customers, customer acquisition cost vs. customer lifetime value. This Effective BPM Tool For Business Process Management Revenues And Customers Overview KPI Dashboard For Banks Elements PDF is perfect for any presentation, be it in front of clients or colleagues. It is a versatile and stylish solution for organizing your meetings. The Effective BPM Tool For Business Process Management Revenues And Customers Overview KPI Dashboard For Banks Elements PDF features a modern design for your presentation meetings. The adjustable and customizable slides provide unlimited possibilities for acing up your presentation. Slidegeeks has done all the homework before launching the product for you. So, do not wait, grab the presentation templates today.


This slide showcases dashboard that can help organization to evaluate key changes in financial KPIs post fundraising. Its key components are net profit margin, revenue, gross profit margin, debt to equity and return on equity. There are so many reasons you need a Strategic Fund Acquisition Plan For Business Opertions Expansion Financial KPI Dashboard To Evaluate Fundraising Impact Guidelines PDF. The first reason is you can not spend time making everything from scratch, Thus, Slidegeeks has made presentation templates for you too. You can easily download these templates from our website easily.
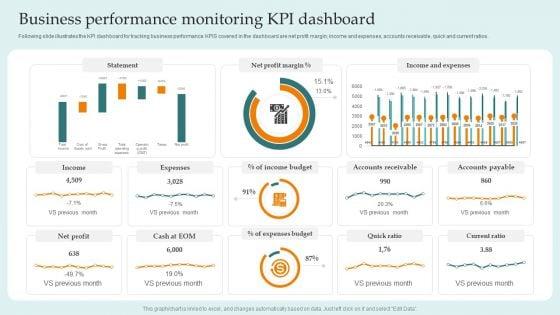
Business Performance Monitoring Kpi Dashboard Guide For Successful Merger And Acquisition Mockup PDF
Coming up with a presentation necessitates that the majority of the effort goes into the content and the message you intend to convey. The visuals of a PowerPoint presentation can only be effective if it supplements and supports the story that is being told. Keeping this in mind our experts created Business Performance Monitoring Kpi Dashboard Guide For Successful Merger And Acquisition Mockup PDF to reduce the time that goes into designing the presentation. This way, you can concentrate on the message while our designers take care of providing you with the right template for the situation.

This slide signifies the product marketing key performance indicator dashboard for international business expansion. It covers information about sales, target, target achievement, gross profit margin, sales by region, growth and inventory outstanding.Pitch your topic with ease and precision using this Commodity Marketing KPI Dashboard For International Business Expansion Formats PDF. This layout presents information on Target Achievement, Receivale Days, Gross Profit. It is also available for immediate download and adjustment. So, changes can be made in the color, design, graphics or any other component to create a unique layout.
Mentioned slide portrays KPI dashboard that can be used by organizations to measure their business performance post AI introduction. KPIS covered here are progress, before versus after AI implementation, risks and issues. Deliver and pitch your topic in the best possible manner with this AI Playbook For Business KPI Dashboard For Tracking Business Performance Demonstration PDF. Use them to share invaluable insights on Performance KPIs, Progress, Risk And Issues and impress your audience. This template can be altered and modified as per your expectations. So, grab it now.


Following slide portrays performance measurement dashboard for FinTech companies with KPIs namely available cash, cash flow, ROA, working capital ratio, days sales outstanding and days payable outstanding. Deliver an awe inspiring pitch with this creative Technology Investment To Enhance Business Growth Performance Measurement KPI Dashboard For Fintech Firm Slides PDF bundle. Topics like Available Cash, Cash Flow, Return On Assets, Working Capital Ratio can be discussed with this completely editable template. It is available for immediate download depending on the needs and requirements of the user.
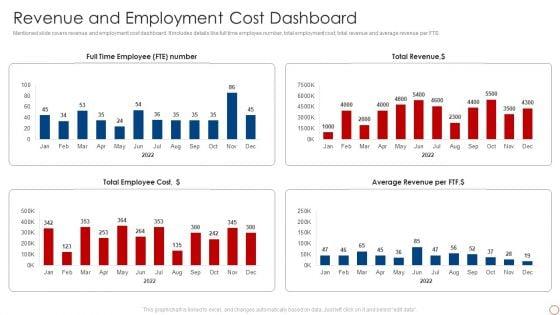

Mentioned slide covers revenue and employment cost dashboard. It includes details like full time employee number, total employment cost, total revenue and average revenue per FTE. Deliver and pitch your topic in the best possible manner with this Kpis For Evaluating Business Sustainability Revenue And Employment Cost Themes PDF. Use them to share invaluable insights on Total Revenue, Average Revenue, Per FTF, Total Employee Cost and impress your audience. This template can be altered and modified as per your expectations. So, grab it now.


This slide covers real time utilization dashboard covering logged time such as billable, non-billable, estimated time and scheduled. It also include details of allotted hours to each employee and weekly hours for the assignment. Deliver an awe inspiring pitch with this creative Kpis For Evaluating Business Sustainability Real Time Utilization Dashboard Portrait PDF bundle. Topics like Logged Time, Employee, Albert Rudolf can be discussed with this completely editable template. It is available for immediate download depending on the needs and requirements of the user.
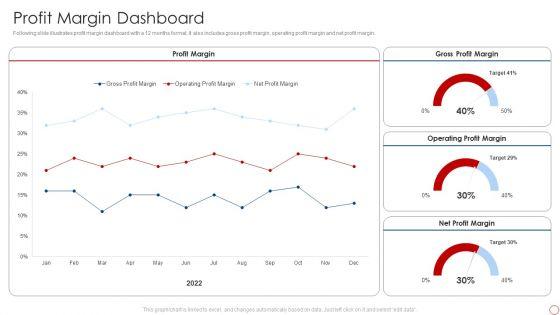

Following slide illustrates profit margin dashboard with a 12 months format. It also includes gross profit margin, operating profit margin and net profit margin. Deliver and pitch your topic in the best possible manner with this Kpis For Evaluating Business Sustainability Profit Margin Dashboard Pictures PDF. Use them to share invaluable insights on Profit Margin, Gross Profit Margin, Operating Profit Margin and impress your audience. This template can be altered and modified as per your expectations. So, grab it now.
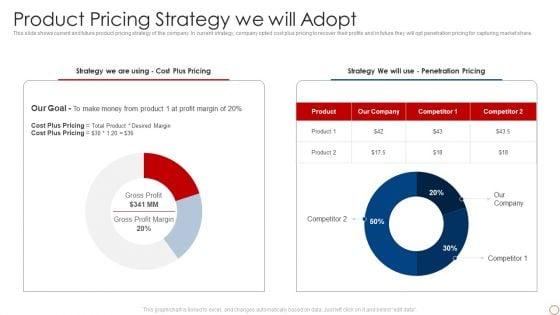
This slide shows current and future product pricing strategy of the company. In current strategy, company opted cost plus pricing to recover their profits and in future they will opt penetration pricing for capturing market share. Deliver an awe inspiring pitch with this creative Kpis For Evaluating Business Sustainability Product Pricing Strategy We Will Adopt Slides PDF bundle. Topics like Strategy, Cost Plus Pricing, Penetration Pricing can be discussed with this completely editable template. It is available for immediate download depending on the needs and requirements of the user.


Following slide provides financial details of company including revenue and operating profit. Revenue recorded in FY22 was dollar 518,932 while operating profit recorded was dollar 481,932. Deliver and pitch your topic in the best possible manner with this Kpis For Evaluating Business Sustainability Financial Performance Indicator Dashboard Demonstration PDF. Use them to share invaluable insights on Revenue, Operating Profit and impress your audience. This template can be altered and modified as per your expectations. So, grab it now.
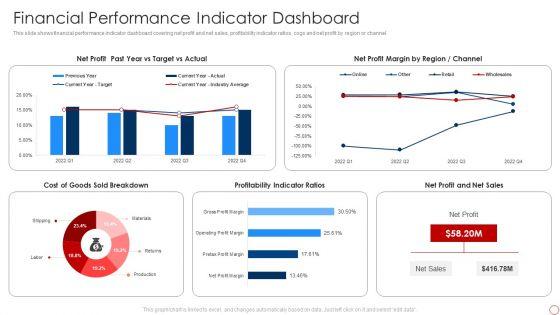

This slide shows financial performance indicator dashboard covering net profit and net sales, profitability indicator ratios, cogs and net profit by region or channel. Deliver and pitch your topic in the best possible manner with this Kpis For Evaluating Business Sustainability Financial Performance Indicator Dashboard Demonstration PDF. Use them to share invaluable insights on Net Profit, Net Profit Margin, Profitability Indicator Ratios and impress your audience. This template can be altered and modified as per your expectations. So, grab it now.


Following slide shows employee engagement and company culture dashboard. It includes employee details, engagement score, total given recognition, previous seven days performance and radar chart to measure employee performance. Deliver an awe inspiring pitch with this creative Kpis For Evaluating Business Sustainability Employee Engagement And Company Graphics PDF bundle. Topics like 80 Engagement Score, 195 Total Submission, Employee Details can be discussed with this completely editable template. It is available for immediate download depending on the needs and requirements of the user.
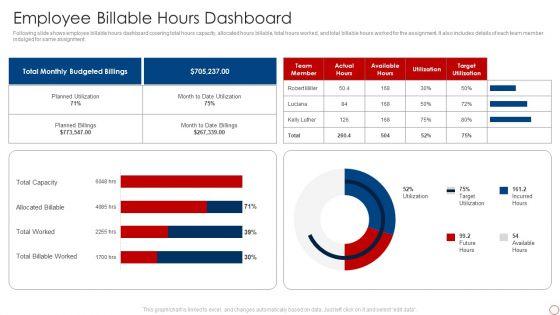

Following slide shows employee billable hours dashboard covering total hours capacity, allocated hours billable, total hours worked, and total billable hours worked for the assignment. It also includes details of each team member indulged for same assignment. Deliver and pitch your topic in the best possible manner with this Kpis For Evaluating Business Sustainability Employee Billable Hours Dashboard Professional PDF. Use them to share invaluable insights on Total Billable Worked, Total Worked, Allocated Billable, Total Capacity and impress your audience. This template can be altered and modified as per your expectations. So, grab it now.

This slide covers effective rate metrics. It shows over year over comparison of effective rate per customer as well as effective rate per offering. Deliver an awe inspiring pitch with this creative Kpis For Evaluating Business Sustainability Effective Rate Metrics By Customer Ideas PDF bundle. Topics like Effective Rate, Per Customer, Effective Rate, Per Offering can be discussed with this completely editable template. It is available for immediate download depending on the needs and requirements of the user.
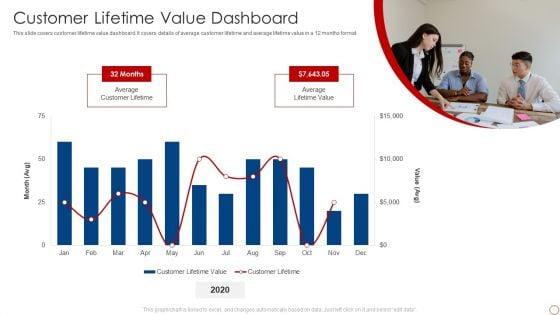

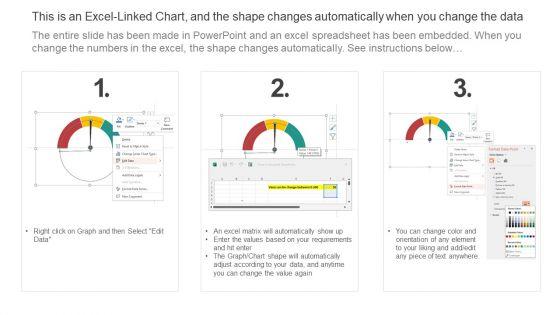
This slide covers customer lifetime value dashboard. It covers details of average customer lifetime and average lifetime value in a 12 months format. Deliver and pitch your topic in the best possible manner with this Kpis For Evaluating Business Sustainability Customer Lifetime Value Dashboard Clipart PDF. Use them to share invaluable insights on Average Customer Lifetime, Average Lifetime Value and impress your audience. This template can be altered and modified as per your expectations. So, grab it now.
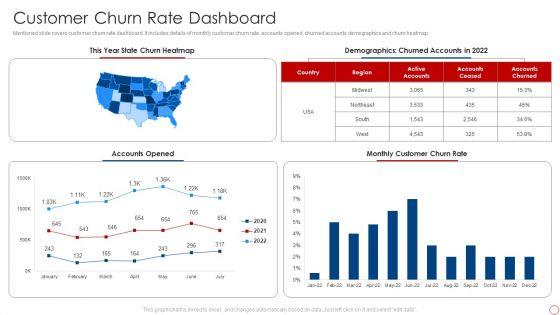

Mentioned slide covers customer churn rate dashboard. It includes details of monthly customer churn rate, accounts opened, churned accounts demographics and churn heatmap. Deliver an awe inspiring pitch with this creative Kpis For Evaluating Business Sustainability Customer Churn Rate Dashboard Guidelines PDF bundle. Topics like Accounts Opened, Monthly Customer, Churn Rate, Demographics can be discussed with this completely editable template. It is available for immediate download depending on the needs and requirements of the user.


Following slide shows detailed competitive landscape analysis based on different criteria such as founded year, number of employees, investor funding, operating profit and net profit margin. Presenting Kpis For Evaluating Business Sustainability Competitive Landscape Analysis Company Infographics PDF to provide visual cues and insights. Share and navigate important information on four stages that need your due attention. This template can be used to pitch topics like Number Employees, Investor Funding, Operating Profit, Net Profit Margin. In addtion, this PPT design contains high resolution images, graphics, etc, that are easily editable and available for immediate download.
This slide provides information regarding essential KPIs for ecommerce performance dashboard tracking average bounce rate, new vs. old customers, channel revenue vs. channel acquisitions costs, channel revenue vs. sales, average conversion rate, etc. Deliver an awe inspiring pitch with this creative Strategy Playbook For Ecommerce Business Dashboard Tracking Essential Kpis For Ecommerce Performance Rules PDF bundle. Topics like Returning Customers, Acquisition Cost, Channel Revenue can be discussed with this completely editable template. It is available for immediate download depending on the needs and requirements of the user.

Ensure that gamification activity helps improve your business performance.Deliver an awe inspiring pitch with this creative Gamification Strategy For Business Promotion Gamification Activity Vs KPI Performance Themes PDF bundle. Topics like Activity, Gamification, Started can be discussed with this completely editable template. It is available for immediate download depending on the needs and requirements of the user.


The following slide displays the key KPIs that can be utilized by the sales development representative to measure their performance. It displays the various KPIs such as Meetings done, Calls made, mails sent, connection made etc.This is a Playbook For Sales Development Executives Kpis For Business Development Representative Mockup PDF template with various stages. Focus and dispense information on five stages using this creative set, that comes with editable features. It contains large content boxes to add your information on topics like Conversion Rate, Connects Made, Required Minimum You can also showcase facts, figures, and other relevant content using this PPT layout. Grab it now.
Mentioned slide portrays KPI dashboard that can be used by organizations to measure their business performance post AI introduction. KPIS covered here are progress, Before versus After AI Implementation, risks issues.Deliver an awe inspiring pitch with this creative Artificial Intelligence For IT Operations Playbook KPI Dashboard For Tracking Business Performance Slides PDF bundle. Topics like Kpi Dashboard, Tracking Business, Performance can be discussed with this completely editable template. It is available for immediate download depending on the needs and requirements of the user.
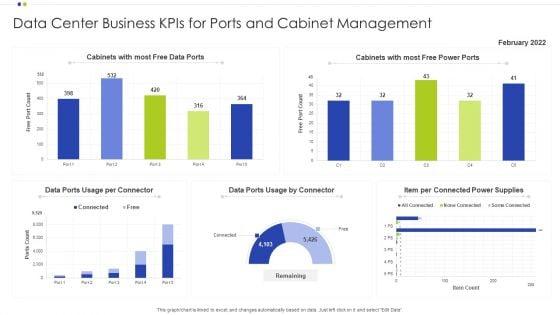
Showcasing this set of slides titled Data Center Business Kpis For Ports And Cabinet Management Ppt Diagram Ppt PDF. The topics addressed in these templates are Cabinet Management, Data Center Business, Power Supplies. All the content presented in this PPT design is completely editable. Download it and make adjustments in color, background, font etc. as per your unique business setting.


This slide shows KPI dashboard for measuring information technology business performance which can be referred by technical organizations to analyze their annual performance. It includes information about monthly recurring revenue, customer acquisition cost, signups and paying customers, visitors and signups, runway, etc. Showcasing this set of slides titled KPI Dashboard For Measuring Information Technology Business Performance Designs PDF. The topics addressed in these templates are Signups And Paying, Customers Monthly Growth, Visitors And Signups, Monthly Average Revenue. All the content presented in this PPT design is completely editable. Download it and make adjustments in color, background, font etc. as per your unique business setting.

The following slide displays the key KPIs that can be utilized by the sales development representative to measure their performance. It displays the various KPIs such as Meetings done, Calls made, mails sent, connection made etc. Presenting Sales Representative Onboarding Playbook Kpis For Business Development Representative Topics PDF to provide visual cues and insights. Share and navigate important information on five stages that need your due attention. This template can be used to pitch topics like Connects Made, Conversion Rate, Meetings Done, Mails Sent, Calls Made. In addtion, this PPT design contains high resolution images, graphics, etc, that are easily editable and available for immediate download.
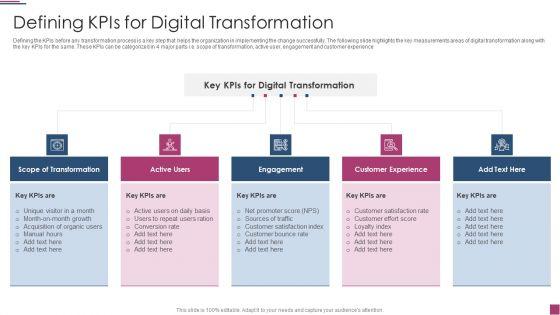
Defining the KPIs before any transformation process is a key step that helps the organization in implementing the change successfully. The following slide highlights the key measurements areas of digital transformation along with the key KPIs for the same. These KPIs can be categorized in 4 major parts i.e. scope of transformation, active user, engagement and customer experience This is a Innovation Procedure For Online Business Defining Kpis For Digital Transformation Summary PDF template with various stages. Focus and dispense information on five stages using this creative set, that comes with editable features. It contains large content boxes to add your information on topics like Scope Of Transformation, Customer Experience, Digital Transformation You can also showcase facts, figures, and other relevant content using this PPT layout. Grab it now.

Deliver and pitch your topic in the best possible manner with this playbook for application developers kpi dashboard to measure overall business performance graphics pdf Use them to share invaluable insights on kpi dashboard to measure overall business performance and impress your audience. This template can be altered and modified as per your expectations. So, grab it now.

Pitch your topic with ease and precision using this customer support kpi dashboard for evaluating sales business process outsourcing performance slides pdf. This layout presents information on customer support kpi dashboard for evaluating sales business process outsourcing performance. It is also available for immediate download and adjustment. So, changes can be made in the color, design, graphics or any other component to create a unique layout.


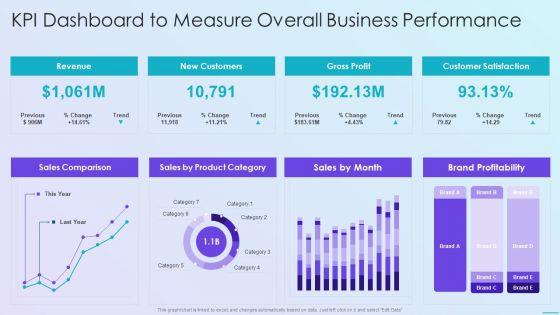
This graph or chart is linked to excel, and changes automatically based on data. Just left click on it and select Edit Data. Deliver an awe inspiring pitch with this creative guide for software developers kpi dashboard to measure overall business performance elements pdf bundle. Topics like revenue new customers, gross profit, customer satisfaction, sales comparison, brand profitability can be discussed with this completely editable template. It is available for immediate download depending on the needs and requirements of the user.
Mentioned slide portrays KPI dashboard that can be used by organizations to measure their business performance post AI introduction. KPIS covered here are progress, Before versus After AI Implementation, risks and issues. Deliver an awe inspiring pitch with this creative artificial intelligence playbook kpi dashboard for tracking business performance formats pdf bundle. Topics like performance kpis, progress, risk and issues can be discussed with this completely editable template. It is available for immediate download depending on the needs and requirements of the user.

The following slide displays the key KPIs that can be utilized by the sales development representative to measure their performance. It displays the various KPIs such as Meetings done, Calls made, mails sent, connection made etc. This is a kpis for business development representative infographics pdf template with various stages. Focus and dispense information on five stages using this creative set, that comes with editable features. It contains large content boxes to add your information on topics like meetings done, mails sent, connects made, conversion rate, calls made. You can also showcase facts, figures, and other relevant content using this PPT layout. Grab it now.
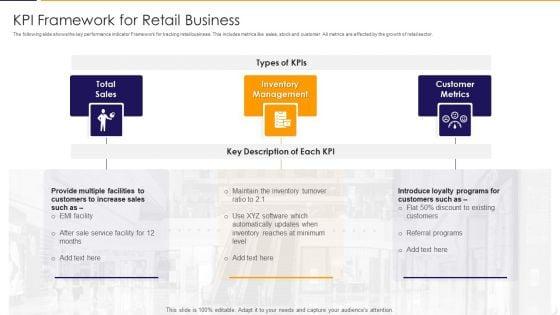

The following slide shows the key performance indicator Framework for tracking retail business. This includes metrics like sales, stock and customer. All metrics are affected by the growth of retail sector. Presenting kpi framework for retail business elements pdf to dispense important information. This template comprises three stages. It also presents valuable insights into the topics including total sales, inventory management, customer metrics. This is a completely customizable PowerPoint theme that can be put to use immediately. So, download it and address the topic impactfully.
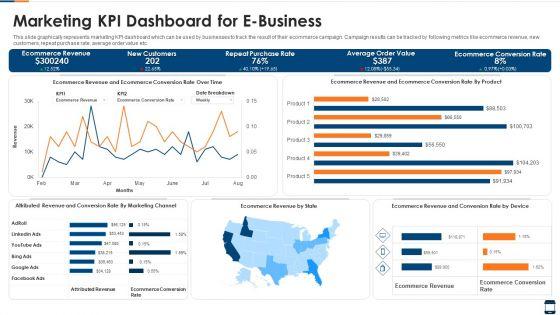
This slide graphically represents marketing KPI dashboard which can be used by businesses to track the result of their ecommerce campaign. Campaign results can be tracked by following metrics like ecommerce revenue, new customers, repeat purchase rate, average order value etc. Showcasing this set of slides titled marketing kpi dashboard for e business brochure pdf. The topics addressed in these templates are marketing kpi dashboard for e business. All the content presented in this PPT design is completely editable. Download it and make adjustments in color, background, font etc. as per your unique business setting.
Mentioned slide portrays KPI dashboard that can be used by organizations to measure their business performance post AI introduction. KPIS covered here are progress, Before versus After AI Implementation, risks and issues. Deliver an awe inspiring pitch with this creative artificial intelligence transformation playbook kpi dashboard for tracking business performance designs pdf bundle. Topics like risk and issues, progress, performance kpis, before versus after all implementation can be discussed with this completely editable template. It is available for immediate download depending on the needs and requirements of the user.
This is a sales development representative playbook kpis for business development representative icons pdf template with various stages. Focus and dispense information on five stages using this creative set, that comes with editable features. It contains large content boxes to add your information on topics like calls made, mails sent, connects made, conversion rate, meetings done. You can also showcase facts, figures, and other relevant content using this PPT layout. Grab it now.
This slide provides information regarding essential KPIs for ecommerce performance dashboard tracking average bounce rate, new vs. old customers, channel revenue vs. channel acquisitions costs, channel revenue vs. sales, average conversion rate, etc. Deliver an awe inspiring pitch with this creative online business strategy playbook dashboard tracking essential kpis for ecommerce performance graphics pdf bundle. Topics like Dashboard Tracking Essential KPIs for Ecommerce Performance can be discussed with this completely editable template. It is available for immediate download depending on the needs and requirements of the user.


Defining the KPIs before any transformation process is a key step that helps the organization in implementing the change successfully. The following slide highlights the key measurements areas of digital transformation along with the key KPIs for the same. These KPIs can be categorized in 4 major parts i.e. scope of transformation, active user, engagement and customer experience. This is a digitalization plan for business modernization defining kpis for digital transformation sample pdf template with various stages. Focus and dispense information on five stages using this creative set, that comes with editable features. It contains large content boxes to add your information on topics like scope of transformation, active users, engagement, customer experience. You can also showcase facts, figures, and other relevant content using this PPT layout. Grab it now.
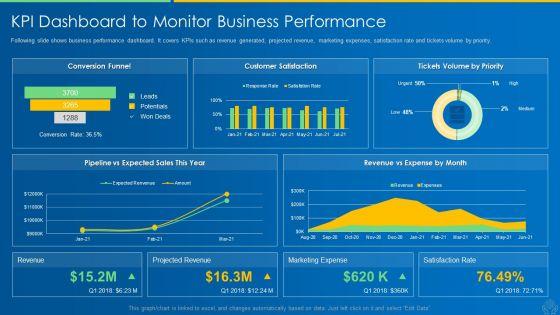
Following slide shows business performance dashboard. It covers KPIs such as revenue generated, projected revenue, marketing expenses, satisfaction rate and tickets volume by priority. Deliver and pitch your topic in the best possible manner with this ai and ml driving monetary value for organization kpi dashboard to monitor business performance graphics pdf. Use them to share invaluable insights on business offerings, current impact, product innovations, customer service and impress your audience. This template can be altered and modified as per your expectations. So, grab it now.
DISPLAYING: 60 of 159 Item(s)
Page