- Sign up
- Sign In
 AI PPT Maker
 Templates
 PPT Bundles
 Design Services
 Business PPTs
 Business Plan
 Management
 Strategy
 Introduction PPT
 Roadmap
 Self Introduction
 Timelines
 Process
 Marketing
 Agenda
 Technology
 Medical
 Startup Business Plan
 Cyber Security
 Dashboards
 SWOT
SWOT Proposals
 Education
 Pitch Deck
 Digital Marketing
 KPIs
KPIs Project Management
 Product Management
 Artificial Intelligence
 Target Market
 Communication
 Supply Chain
 Google Slides
 Research Services
 One Pagers
 All Categories
Kpi dashboard to analyze PowerPoint Presentation Templates and Google Slides
DISPLAYING: 60 of 73 Item(s)
Page


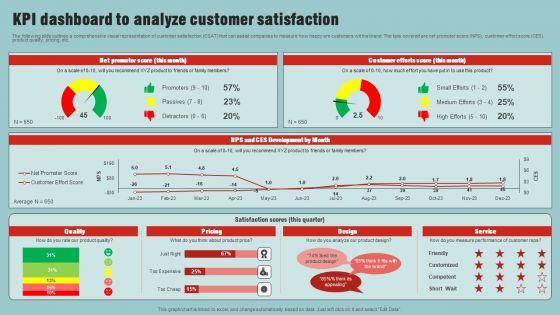
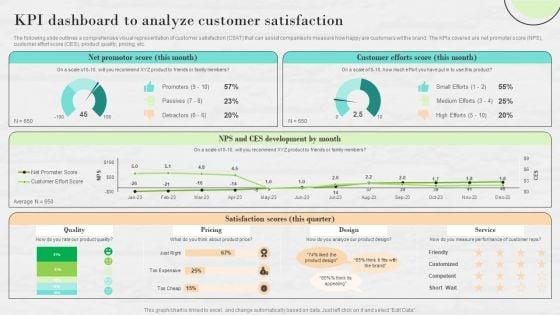
The following slide outlines a comprehensive visual representation of customer satisfaction CSAT that can assist companies to measure how happy are customers wit the brand. The KPIs covered are net promoter score NPS, customer effort score CES, product quality, pricing, etc. Coming up with a presentation necessitates that the majority of the effort goes into the content and the message you intend to convey. The visuals of a PowerPoint presentation can only be effective if it supplements and supports the story that is being told. Keeping this in mind our experts created KPI Dashboard To Analyze Customer Satisfaction Ppt PowerPoint Presentation File Infographic Template PDF to reduce the time that goes into designing the presentation. This way, you can concentrate on the message while our designers take care of providing you with the right template for the situation.


The following slide highlights personal selling efforts of region wise sales representatives to attract new and retain previous customers. It includes elements such as total team sales, weekly, monthly and annual individual outcomes etc. Coming up with a presentation necessitates that the majority of the effort goes into the content and the message you intend to convey. The visuals of a PowerPoint presentation can only be effective if it supplements and supports the story that is being told. Keeping this in mind our experts created Adopting IMC Technique To Boost Brand Recognition Kpi Dashboard To Analyze Personal Selling Results Formats PDF to reduce the time that goes into designing the presentation. This way, you can concentrate on the message while our designers take care of providing you with the right template for the situation.
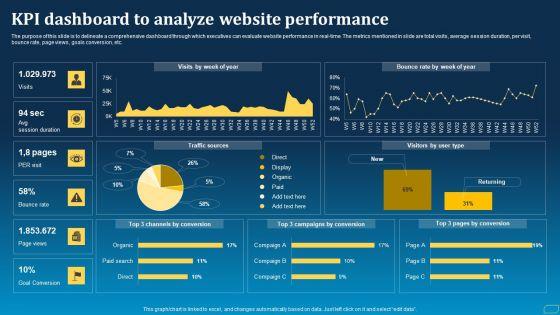

The purpose of this slide is to delineate a comprehensive dashboard through which executives can evaluate website performance in real-time. The metrics mentioned in slide are total visits, average session duration, per visit, bounce rate, page views, goals conversion, etc. Crafting an eye catching presentation has never been more straightforward. Let your presentation shine with this tasteful yet straightforward Direct Marketing Techniques To Enhance Business Presence KPI Dashboard To Analyze Website Performance Background PDF template. It offers a minimalistic and classy look that is great for making a statement. The colors have been employed intelligently to add a bit of playfulness while still remaining professional. Construct the ideal Direct Marketing Techniques To Enhance Business Presence KPI Dashboard To Analyze Website Performance Background PDF that effortlessly grabs the attention of your audience. Begin now and be certain to wow your customers.


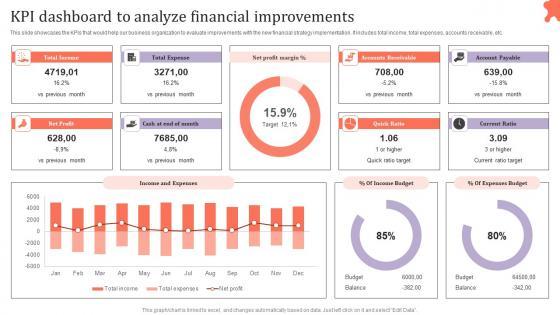
This slide showcases the KPIs that would help our business organization to evaluate improvements with the new financial strategy implementation. It includes total income, total expenses, accounts receivable, etc. The best PPT templates are a great way to save time, energy, and resources. Slidegeeks have 100 percent editable powerpoint slides making them incredibly versatile. With these quality presentation templates, you can create a captivating and memorable presentation by combining visually appealing slides and effectively communicating your message. Download Adjusting Financial Strategies And Planning KPI Dashboard To Analyze Financial Improvements Inspiration PDF from Slidegeeks and deliver a wonderful presentation.

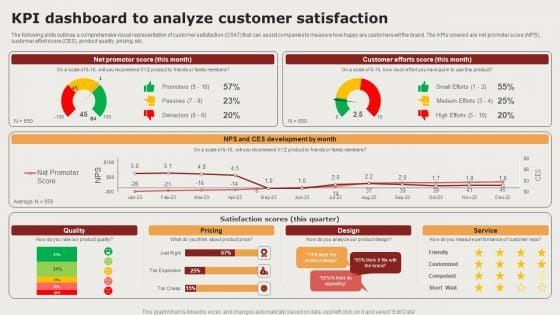
The following slide outlines a comprehensive visual representation of customer satisfaction CSAT that can assist companies to measure how happy are customers wit the brand. The kpis covered are net promoter score NPS, customer effort score CES, product quality, pricing, etc. Retrieve professionally designed Market Analysis Overview And Different Categories KPI Dashboard To Analyze Customer Satisfaction Elements PDF to effectively convey your message and captivate your listeners. Save time by selecting pre made slideshows that are appropriate for various topics, from business to educational purposes. These themes come in many different styles, from creative to corporate, and all of them are easily adjustable and can be edited quickly. Access them as PowerPoint templates or as Google Slides themes. You do not have to go on a hunt for the perfect presentation because Slidegeeks got you covered from everywhere.
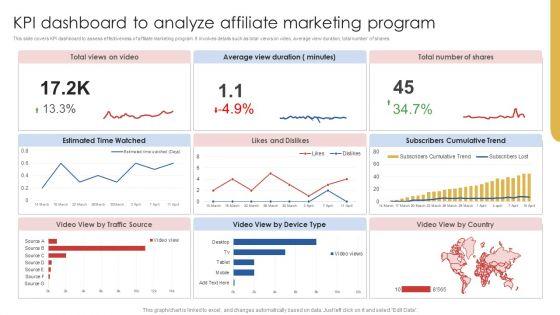

This slide covers KPI dashboard to assess effectiveness of affiliate marketing program. It involves details such as total views on video, average view duration, total number of shares. Create an editable KPI Dashboard To Analyze Affiliate Marketing Program Rules PDF that communicates your idea and engages your audience. Whether you are presenting a business or an educational presentation, pre-designed presentation templates help save time. KPI Dashboard To Analyze Affiliate Marketing Program Rules PDF is highly customizable and very easy to edit, covering many different styles from creative to business presentations. Slidegeeks has creative team members who have crafted amazing templates. So, go and get them without any delay.

The following slide outlines a comprehensive visual representation of customer satisfaction CSAT that can assist companies to measure how happy are customers wit the brand. The KPIs covered are net promoter score NPS, customer effort score CES, product quality, pricing, etc. Want to ace your presentation in front of a live audience Our Creating Positioning Techniques For Market Research Kpi Dashboard To Analyze Customer Satisfaction Mockup PDF can help you do that by engaging all the users towards you. Slidegeeks experts have put their efforts and expertise into creating these impeccable powerpoint presentations so that you can communicate your ideas clearly. Moreover, all the templates are customizable, and easy to edit and downloadable. Use these for both personal and commercial use.


The following slide outlines a comprehensive visual representation of customer satisfaction CSAT that can assist companies to measure how happy are customers wit the brand. The KPIs covered are net promoter score NPS, customer effort score CES, product quality, pricing, etc. Presenting this PowerPoint presentation, titled Market Research Assessment Of Target Market Requirements Kpi Dashboard To Analyze Customer Satisfaction Pictures PDF, with topics curated by our researchers after extensive research. This editable presentation is available for immediate download and provides attractive features when used. Download now and captivate your audience. Presenting this Market Research Assessment Of Target Market Requirements Kpi Dashboard To Analyze Customer Satisfaction Pictures PDF. Our researchers have carefully researched and created these slides with all aspects taken into consideration. This is a completely customizable Market Research Assessment Of Target Market Requirements Kpi Dashboard To Analyze Customer Satisfaction Pictures PDF that is available for immediate downloading. Download now and make an impact on your audience. Highlight the attractive features available with our PPTs.


This slide showcases the parameters that would help the business organization to evaluate Pay Per Click PPC marketing performance. It includes ad cost, clicks, impression, conversions, ad impressions, conversion rate, Cost Per Click CPC, etc. Presenting this PowerPoint presentation, titled KPI Dashboard To Analyze PPC Marketing Campaigns Performance Information PDF, with topics curated by our researchers after extensive research. This editable presentation is available for immediate download and provides attractive features when used. Download now and captivate your audience. Presenting this KPI Dashboard To Analyze PPC Marketing Campaigns Performance Information PDF. Our researchers have carefully researched and created these slides with all aspects taken into consideration. This is a completely customizable KPI Dashboard To Analyze PPC Marketing Campaigns Performance Information PDF that is available for immediate downloading. Download now and make an impact on your audience. Highlight the attractive features available with our PPTs.
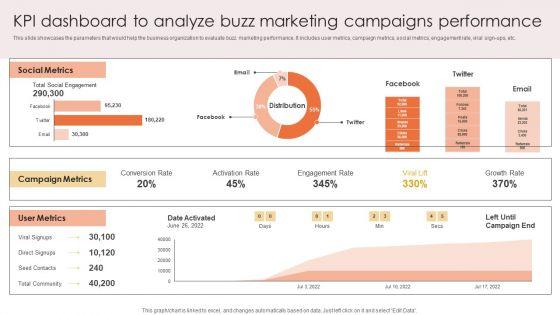

This slide showcases the parameters that would help the business organization to evaluate buzz marketing performance. It includes user metrics, campaign metrics, social metrics, engagement rate, viral sign-ups, etc. Take your projects to the next level with our ultimate collection of Kpi Dashboard To Analyze Buzz Marketing Campaigns Performance Download PDF. Slidegeeks has designed a range of layouts that are perfect for representing task or activity duration, keeping track of all your deadlines at a glance. Tailor these designs to your exact needs and give them a truly corporate look with your own brand colors they will make your projects stand out from the rest.
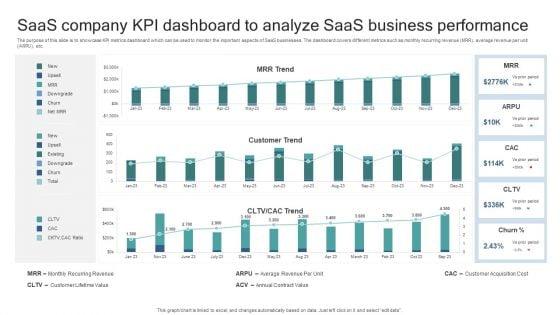

The purpose of this slide is to showcase KPI metrics dashboard which can be used to monitor the important aspects of SaaS businesses. The dashboard covers different metrics such as monthly recurring revenue MRR, average revenue per unit ARPU, etc. Pitch your topic with ease and precision using this Saas Company KPI Dashboard To Analyze Saas Business Performance Elements PDF. This layout presents information on Monthly Recurring Revenue, Customer Lifetime Value, Average Revenue Per Unit, Annual Contract Value, Customer Acquisition Cost. It is also available for immediate download and adjustment. So, changes can be made in the color, design, graphics or any other component to create a unique layout.
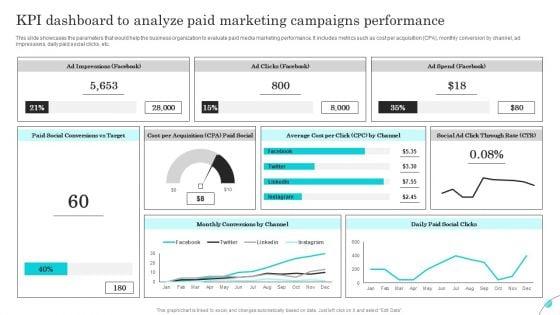

This slide showcases the parameters that would help the business organization to evaluate paid media marketing performance. It includes metrics such as cost per acquisition CPA, monthly conversion by channel, ad impressions, daily paid social clicks, etc. Present like a pro with KPI Dashboard To Analyze Paid Marketing Campaigns Performance Background PDF Create beautiful presentations together with your team, using our easy to use presentation slides. Share your ideas in real time and make changes on the fly by downloading our templates. So whether you are in the office, on the go, or in a remote location, you can stay in sync with your team and present your ideas with confidence. With Slidegeeks presentation got a whole lot easier. Grab these presentations today.


Following slide outlines a KPI dashboard which can be used by companies to evaluate the performance of stocks in various sectors. The KPIs mentioned in the slide are total investment in various countries, total portfolio value, yield cost ratio etc. Pitch your topic with ease and precision using this KPI Dashboard To Analyze Share Market Sector Wise Performance Summary PDF. This layout presents information on Sector Sheets, Dividends Vs Unrealized, Investment Style. It is also available for immediate download and adjustment. So, changes can be made in the color, design, graphics or any other component to create a unique layout.
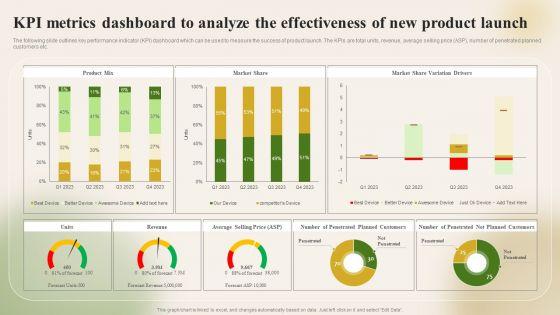

The following slide outlines key performance indicator KPI dashboard which can be used to measure the success of product launch. The KPIs are total units, revenue, average selling price ASP, number of penetrated planned customers etc. Make sure to capture your audiences attention in your business displays with our gratis customizable KPI Metrics Dashboard To Analyze The Effectiveness Of New Introducing New Food Pictures PDF. These are great for business strategies, office conferences, capital raising or task suggestions. If you desire to acquire more customers for your tech business and ensure they stay satisfied, create your own sales presentation with these plain slides.
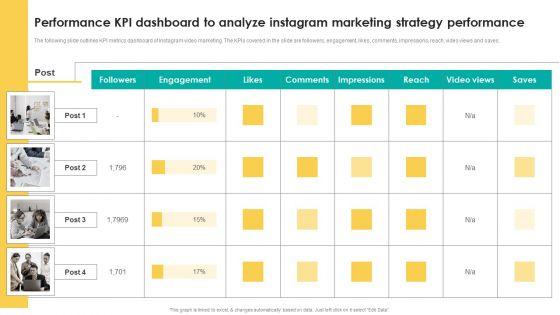
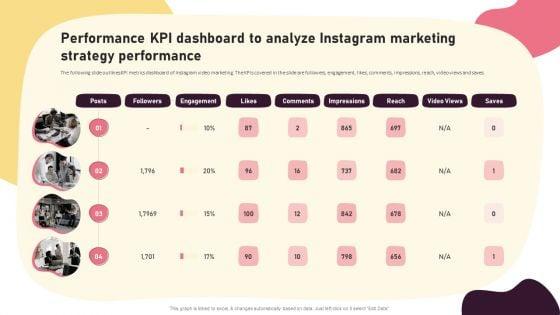
The following slide outlines KPI metrics dashboard of Instagram video marketing. The KPIs covered in the slide are followers, engagement, likes, comments, impressions, reach, video views and saves. This modern and well arranged Performance KPI Dashboard To Analyze Instagram Marketing Strategy Performance Information PDF provides lots of creative possibilities. It is very simple to customize and edit with the Powerpoint Software. Just drag and drop your pictures into the shapes. All facets of this template can be edited with Powerpoint no extra software is necessary. Add your own material, put your images in the places assigned for them, adjust the colors, and then you can show your slides to the world, with an animated slide included.
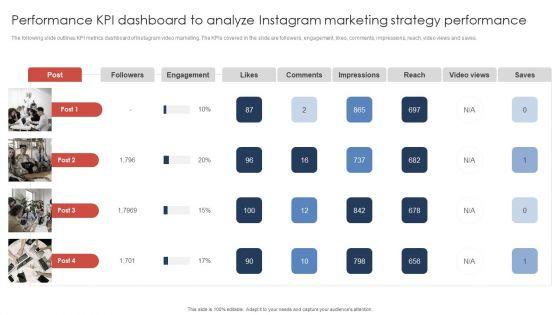

The following slide outlines KPI metrics dashboard of Instagram video marketing. The KPIs covered in the slide are followers, engagement, likes, comments, impressions, reach, video views and saves. Find highly impressive Performance Kpi Dashboard To Analyze Instagram Marketing Strategy Performance Microsoft PDF on Slidegeeks to deliver a meaningful presentation. You can save an ample amount of time using these presentation templates. No need to worry to prepare everything from scratch because Slidegeeks experts have already done a huge research and work for you. You need to download Performance Kpi Dashboard To Analyze Instagram Marketing Strategy Performance Microsoft PDF for your upcoming presentation. All the presentation templates are 100 percent editable and you can change the color and personalize the content accordingly. Download now.

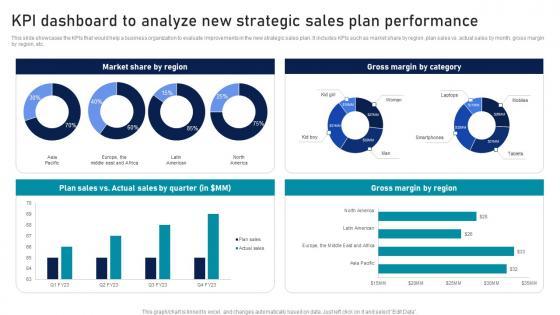
Planning Sales Campaign To Improve KPI Dashboard To Analyze New Strategic Sales Plan Information PDF
This slide showcases the KPIs that would help a business organization to evaluate improvements in the new strategic sales plan. It includes KPIs such as market share by region, plan sales vs. actual sales by month, gross margin by region, etc. Welcome to our selection of the Planning Sales Campaign To Improve KPI Dashboard To Analyze New Strategic Sales Plan Information PDF. These are designed to help you showcase your creativity and bring your sphere to life. Planning and Innovation are essential for any business that is just starting out. This collection contains the designs that you need for your everyday presentations. All of our PowerPoints are 100 percent editable, so you can customize them to suit your needs. This multi-purpose template can be used in various situations. Grab these presentation templates today.
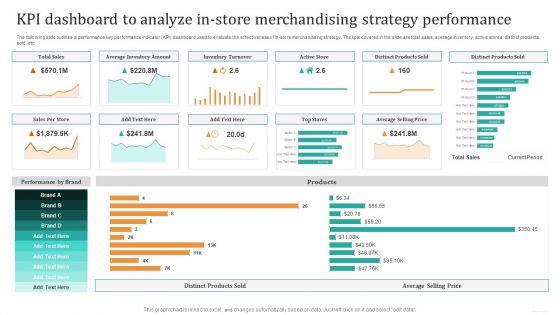

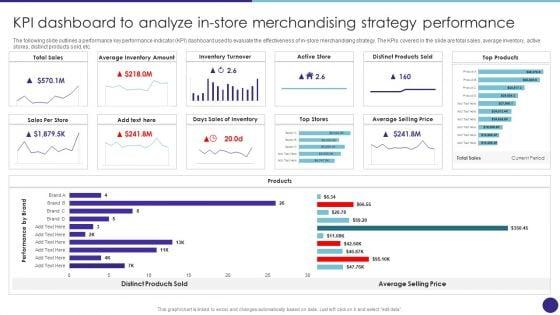
The following slide outlines a performance key performance indicator KPI dashboard used to evaluate the effectiveness of in-store merchandising strategy. The KPIs covered in the slide are total sales, average inventory, active stores, distinct products sold, etc. Formulating a presentation can take up a lot of effort and time, so the content and message should always be the primary focus. The visuals of the PowerPoint can enhance the presenters message, so our KPI Dashboard To Analyze In Store Merchandising Strategy Performance Pictures PDF was created to help save time. Instead of worrying about the design, the presenter can concentrate on the message while our designers work on creating the ideal templates for whatever situation is needed. Slidegeeks has experts for everything from amazing designs to valuable content, we have put everything into KPI Dashboard To Analyze In Store Merchandising Strategy Performance Pictures PDF.


The following slide outlines a performance key performance indicator KPI dashboard used to evaluate the effectiveness of in-store merchandising strategy. The KPIs covered in the slide are total sales, average inventory, active stores, distinct products sold, etc. Formulating a presentation can take up a lot of effort and time, so the content and message should always be the primary focus. The visuals of the PowerPoint can enhance the presenters message, so our KPI Dashboard To Analyze In Store Merchandising Strategy Performance Introduction PDF was created to help save time. Instead of worrying about the design, the presenter can concentrate on the message while our designers work on creating the ideal templates for whatever situation is needed. Slidegeeks has experts for everything from amazing designs to valuable content, we have put everything into KPI Dashboard To Analyze In Store Merchandising Strategy Performance Introduction PDF.
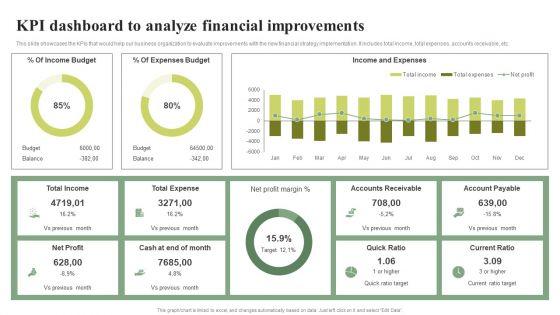

This slide showcases the KPIs that would help our business organization to evaluate improvements with the new financial strategy implementation. It includes total income, total expenses, accounts receivable, etc.Find highly impressive KPI Dashboard To Analyze Financial Improvements Effective Planning For Monetary Portrait PDF on Slidegeeks to deliver a meaningful presentation. You can save an ample amount of time using these presentation templates. No need to worry to prepare everything from scratch because Slidegeeks experts have already done a huge research and work for you. You need to download KPI Dashboard To Analyze Financial Improvements Effective Planning For Monetary Portrait PDF for your upcoming presentation. All the presentation templates are 100precent editable and you can change the color and personalize the content accordingly. Download now,


The following slide outlines a comprehensive visual representation of customer satisfaction CSAT that can assist companies to measure how happy are customers wit the brand. The KPIs covered are net promoter score NPS, customer effort score CES, product quality, pricing, etc. Retrieve professionally designed Comprehensive Market Research Guide KPI Dashboard To Analyze Customer Satisfaction Structure PDF to effectively convey your message and captivate your listeners. Save time by selecting pre-made slideshows that are appropriate for various topics, from business to educational purposes. These themes come in many different styles, from creative to corporate, and all of them are easily adjustable and can be edited quickly. Access them as PowerPoint templates or as Google Slides themes. You dont have to go on a hunt for the perfect presentation because Slidegeeks got you covered from everywhere.
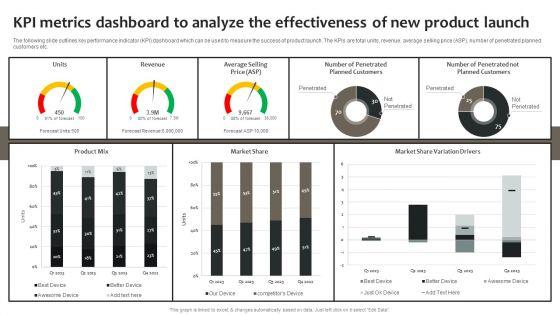

The following slide outlines key performance indicator KPI dashboard which can be used to measure the success of product launch. The KPIs are total units, revenue, average selling price ASP, number of penetrated planned customers etc. From laying roadmaps to briefing everything in detail, our templates are perfect for you. You can set the stage with your presentation slides. All you have to do is download these easy-to-edit and customizable templates. Effective Online And Offline Promotional Kpi Metrics Dashboard To Analyze The Effectiveness Of New Portrait PDF will help you deliver an outstanding performance that everyone would remember and praise you for. Do download this presentation today.
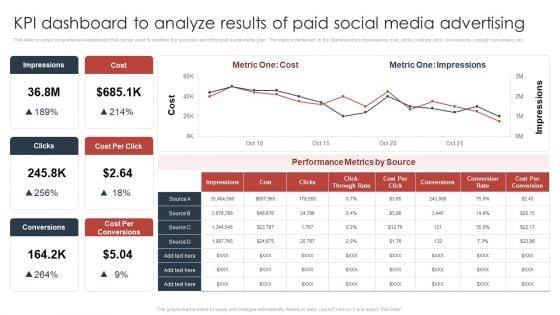
This slide covers a comprehensive dashboard that can be used to examine the success rate of the paid social media plan. The metrics mentioned in the dashboard are impressions, cost, clicks, cost per click, conversions, cost per conversion, etc. Presenting this PowerPoint presentation, titled KPI Dashboard To Analyze Results Of Paid Social Media Advertising Rules PDF, with topics curated by our researchers after extensive research. This editable presentation is available for immediate download and provides attractive features when used. Download now and captivate your audience. Presenting this KPI Dashboard To Analyze Results Of Paid Social Media Advertising Rules PDF. Our researchers have carefully researched and created these slides with all aspects taken into consideration. This is a completely customizable KPI Dashboard To Analyze Results Of Paid Social Media Advertising Rules PDF that is available for immediate downloading. Download now and make an impact on your audience. Highlight the attractive features available with our PPTs.
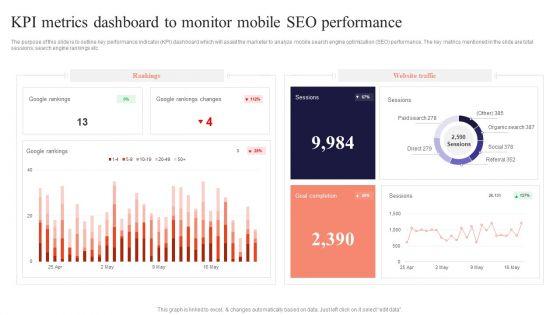

The purpose of this slide is to outline key performance indicator KPI dashboard which will assist the marketer to analyze mobile search engine optimization SEO performance. The key metrics mentioned in the slide are total sessions, search engine rankings etc.Find highly impressive KPI Metrics Dashboard To Monitor Mobile Performing Mobile SEO Audit To Analyze Web Traffic Graphics PDF on Slidegeeks to deliver a meaningful presentation. You can save an ample amount of time using these presentation templates. No need to worry to prepare everything from scratch because Slidegeeks experts have already done a huge research and work for you. You need to download KPI Metrics Dashboard To Monitor Mobile Performing Mobile SEO Audit To Analyze Web Traffic Graphics PDF for your upcoming presentation. All the presentation templates are 100 precent editable and you can change the color and personalize the content accordingly. Download now.
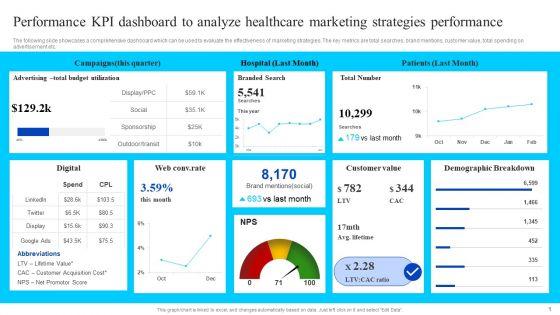
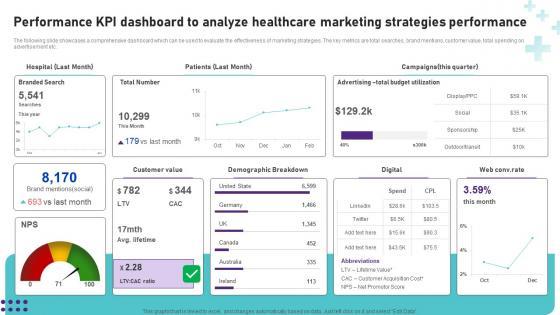
The following slide showcases a comprehensive dashboard which can be used to evaluate the effectiveness of marketing strategies. The key metrics are total searches, brand mentions, customer value, total spending on advertisement etc. If your project calls for a presentation, then Slidegeeks is your go to partner because we have professionally designed, easy to edit templates that are perfect for any presentation. After downloading, you can easily edit Performance KPI Dashboard To Analyze Healthcare Marketing Strategies Performance Elements PDF and make the changes accordingly. You can rearrange slides or fill them with different images. Check out all the handy templates.
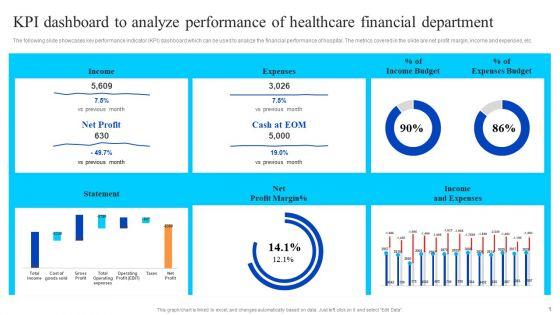

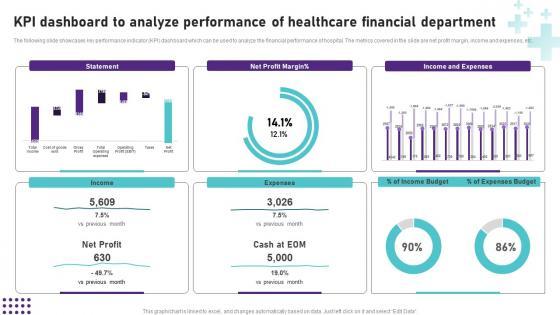
The following slide showcases key performance indicator KPI dashboard which can be used to analyze the financial performance of hospital. The metrics covered in the slide are net profit margin, income and expenses, etc. Do you have an important presentation coming up Are you looking for something that will make your presentation stand out from the rest Look no further than KPI Dashboard To Analyze Performance Of Healthcare Financial Department Summary PDF. With our professional designs, you can trust that your presentation will pop and make delivering it a smooth process. And with Slidegeeks, you can trust that your presentation will be unique and memorable. So why wait Grab KPI Dashboard To Analyze Performance Of Healthcare Financial Department Summary PDF today and make your presentation stand out from the rest.
The following slide outlines a performance key performance indicator KPI dashboard used to evaluate the effectiveness of in-store merchandising strategy. The KPIs covered in the slide are total sales, average inventory, active stores, distinct products sold, etc.The Kpi Dashboard To Analyze In Store Merchandising Strategy Performance Retail Merchandising Techniques Structure PDF is a compilation of the most recent design trends as a series of slides. It is suitable for any subject or industry presentation, containing attractive visuals and photo spots for businesses to clearly express their messages. This template contains a variety of slides for the user to input data, such as structures to contrast two elements, bullet points, and slides for written information. Slidegeeks is prepared to create an impression.
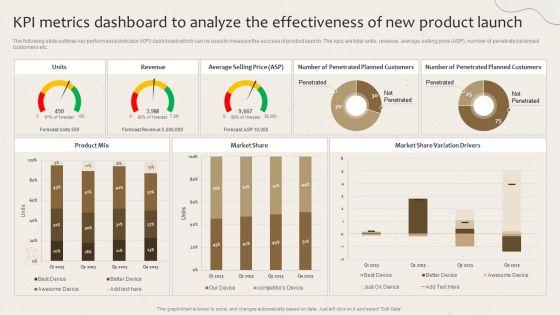
The following slide outlines key performance indicator KPI dashboard which can be used to measure the success of product launch. The kpis are total units, revenue, average selling price ASP, number of penetrated planned customers etc. Create an editable Kpi Metrics Dashboard To Analyze The Effectiveness Of New Product Launch Launching New Beverage Product Diagrams PDF that communicates your idea and engages your audience. Whether you are presenting a business or an educational presentation, pre-designed presentation templates help save time. Kpi Metrics Dashboard To Analyze The Effectiveness Of New Product Launch Launching New Beverage Product Diagrams PDF is highly customizable and very easy to edit, covering many different styles from creative to business presentations. Slidegeeks has creative team members who have crafted amazing templates. So, go and get them without any delay.

Mentioned slide illustrates a comprehensive KPI dashboard which can be used by the company to evaluate consumer intelligence data. This dashboard covers metrics such as total mentions, average time per replies, total replies, etc. Pitch your topic with ease and precision using this KPI Dashboard To Analyze Consumer Intelligence Data Ppt PowerPoint Presentation File Portfolio PDF. This layout presents information on Replay Activities, Total Replies, Mentions Replies. It is also available for immediate download and adjustment. So, changes can be made in the color, design, graphics or any other component to create a unique layout.

The following slide outlines KPI metrics dashboard of Instagram video marketing. The KPIs covered in the slide are followers, engagement, likes, comments, impressions, reach, video views and saves.Deliver an awe inspiring pitch with this creative Performance KPI Dashboard To Analyze Instagram Marketing Strategy Performance Infographics PDF bundle. Topics like Engagement, Impressions, Comments can be discussed with this completely editable template. It is available for immediate download depending on the needs and requirements of the user.

The following slide outlines a performance key performance indicator KPI dashboard used to evaluate the effectiveness of in store merchandising strategy. The kpis covered in the slide are total sales, average inventory, active stores, distinct products sold, etc.Deliver an awe inspiring pitch with this creative Developing Retail Marketing Strategies To Increase Revenue KPI Dashboard To Analyze Instore Information PDF bundle. Topics like Inventory Turnover, Distinct Products, Average Inventory can be discussed with this completely editable template. It is available for immediate download depending on the needs and requirements of the user.
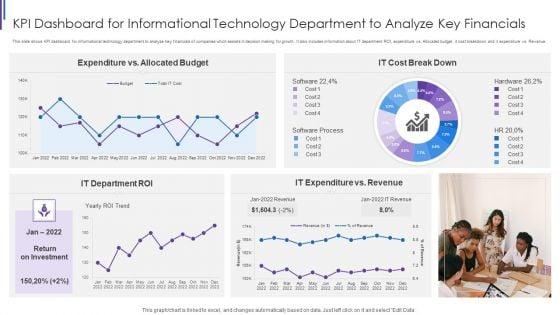

This slide shows KPI dashboard for informational technology department to analyze key financials of companies which assists in decision making for growth. It also includes information about IT department ROI, expenditure vs. Allocated budget, it cost breakdown and it expenditure vs. Revenue. Pitch your topic with ease and precision using this KPI Dashboard For Informational Technology Department To Analyze Key Financials Structure PDF. This layout presents information on Expenditure Vs Allocated, Budget IT Cost, Break Down IT, Expenditure Vs Revenue, IT Department ROI. It is also available for immediate download and adjustment. So, changes can be made in the color, design, graphics or any other component to create a unique layout.

The following slide showcases KPI dashboard which can be used by marketing manager to track social media performance. The metrics covered in the slide are YouTube channel views, LinkedIn clicks, likes and shares, Facebook daily reach etc. Pitch your topic with ease and precision using this KPI Dashboard To Analyze Social Media Marketing Campaign Performance Rules PDF. This layout presents information on Dashboard, Marketing, Analyze. It is also available for immediate download and adjustment. So, changes can be made in the color, design, graphics or any other component to create a unique layout.

The following slide outlines KPI metrics dashboard of Instagram video marketing. The KPIs covered in the slide are followers, engagement, likes, comments, impressions, reach, video views and saves. Are you searching for a Executing Video Promotional Performance KPI Dashboard To Analyze Instagram Marketing Download PDF that is uncluttered, straightforward, and original Its easy to edit, and you can change the colors to suit your personal or business branding. For a presentation that expresses how much effort youve put in, this template is ideal With all of its features, including tables, diagrams, statistics, and lists, its perfect for a business plan presentation. Make your ideas more appealing with these professional slides. Download Executing Video Promotional Performance KPI Dashboard To Analyze Instagram Marketing Download PDF from Slidegeeks today.


The following slide outlines KPI metrics dashboard of Instagram video marketing. The KPIs covered in the slide are followers, engagement, likes, comments, impressions, reach, video views and saves. Here you can discover an assortment of the finest PowerPoint and Google Slides templates. With these templates, you can create presentations for a variety of purposes while simultaneously providing your audience with an eye-catching visual experience. Download Video Promotion Techniques Performance KPI Dashboard To Analyze Instagram Marketing Portrait PDF to deliver an impeccable presentation. These templates will make your job of preparing presentations much quicker, yet still, maintain a high level of quality. Slidegeeks has experienced researchers who prepare these templates and write high-quality content for you. Later on, you can personalize the content by editing the Video Promotion Techniques Performance KPI Dashboard To Analyze Instagram Marketing Portrait PDF.
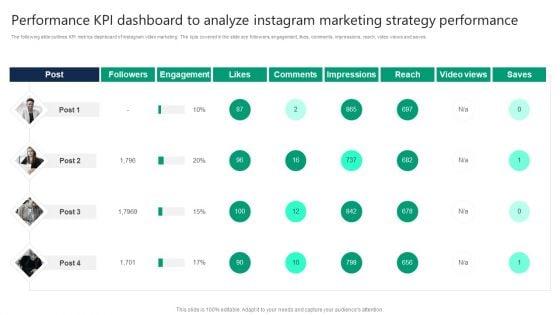
The following slide outlines KPI metrics dashboard of instagram video marketing. The kpis covered in the slide are followers, engagement, likes, comments, impressions, reach, video views and saves. The best PPT templates are a great way to save time, energy, and resources. Slidegeeks have 100 percent editable powerpoint slides making them incredibly versatile. With these quality presentation templates, you can create a captivating and memorable presentation by combining visually appealing slides and effectively communicating your message. Download Performance Kpi Dashboard To Analyze Instagram Marketing Strategy Performance Introduction PDF from Slidegeeks and deliver a wonderful presentation.


The following slide outlines a comprehensive visual representation of customer satisfaction CSAT that can assist companies to measure how happy are customers wit the brand. The KPIs covered are net promoter score NPS, customer effort score CES, product quality, pricing, etc. Presenting this PowerPoint presentation, titled Steps To Effectively Conduct Market Research KPI Dashboard To Analyze Customer Satisfaction Introduction PDF, with topics curated by our researchers after extensive research. This editable presentation is available for immediate download and provides attractive features when used. Download now and captivate your audience. Presenting this Steps To Effectively Conduct Market Research KPI Dashboard To Analyze Customer Satisfaction Introduction PDF. Our researchers have carefully researched and created these slides with all aspects taken into consideration. This is a completely customizable Steps To Effectively Conduct Market Research KPI Dashboard To Analyze Customer Satisfaction Introduction PDF that is available for immediate downloading. Download now and make an impact on your audience. Highlight the attractive features available with our PPTs.
The following slide outlines a comprehensive visual representation of customer satisfaction CSAT that can assist companies to measure how happy are customers wit the brand. The KPIs covered are net promoter score NPS, customer effort score CES, product quality, pricing, etc.Are you in need of a template that can accommodate all of your creative concepts This one is crafted professionally and can be altered to fit any style. Use it with Google Slides or PowerPoint. Include striking photographs, symbols, depictions, and other visuals. Fill, move around, or remove text boxes as desired. Test out color palettes and font mixtures. Edit and save your work, or work with colleagues. Download Market Research To Determine Business Opportunities KPI Dashboard To Analyze Customer Satisfaction Graphics PDF and observe how to make your presentation outstanding. Give an impeccable presentation to your group and make your presentation unforgettable.


This slide signifies the key performance indicator dashboard to evaluate project investment project. It covers information about portfolio activity summary, allocation and dividends vs unrealized gains. Showcasing this set of slides titled KPI Metrics Dashboard To Analyze Business Project Investment Graphics PDF. The topics addressed in these templates are Allocation Sector Sheets, Sector Summary, Investment Styles Shares. All the content presented in this PPT design is completely editable. Download it and make adjustments in color, background, font etc. as per your unique business setting.
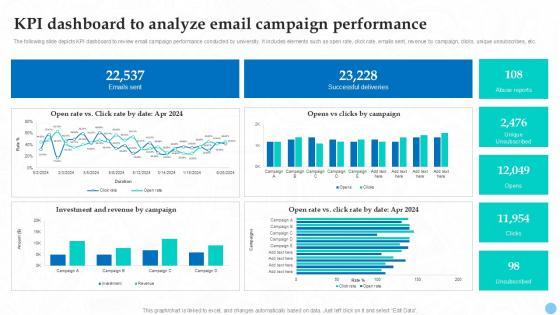
The following slide depicts KPI dashboard to review email campaign performance conducted by university. It includes elements such as open rate, click rate, emails sent, revenue by campaign, clicks, unique unsubscribes, etc. The KPI Dashboard To Analyze Email Campaign Higher Education Ppt Sample Strategy SS V is a compilation of the most recent design trends as a series of slides. It is suitable for any subject or industry presentation, containing attractive visuals and photo spots for businesses to clearly express their messages. This template contains a variety of slides for the user to input data, such as structures to contrast two elements, bullet points, and slides for written information. Slidegeeks is prepared to create an impression. The following slide depicts KPI dashboard to review email campaign performance conducted by university. It includes elements such as open rate, click rate, emails sent, revenue by campaign, clicks, unique unsubscribes, etc.
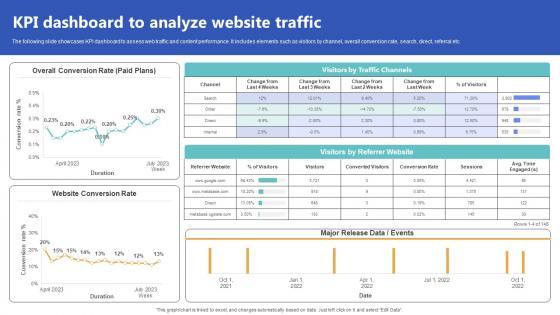
The following slide showcases KPI dashboard to assess web traffic and content performance. It includes elements such as visitors by channel, overall conversion rate, search, direct, referral etc. Explore a selection of the finest KPI Dashboard To Analyze Website Traffic Top Of The Funnel Digital Content Strategy SS V here. With a plethora of professionally designed and pre-made slide templates, you can quickly and easily find the right one for your upcoming presentation. You can use our KPI Dashboard To Analyze Website Traffic Top Of The Funnel Digital Content Strategy SS V to effectively convey your message to a wider audience. Slidegeeks has done a lot of research before preparing these presentation templates. The content can be personalized and the slides are highly editable. Grab templates today from Slidegeeks. The following slide showcases KPI dashboard to assess web traffic and content performance. It includes elements such as visitors by channel, overall conversion rate, search, direct, referral etc.
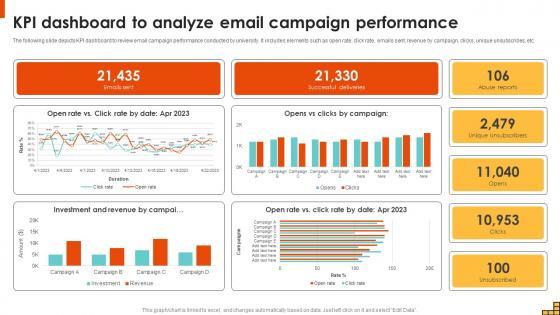

The following slide depicts KPI dashboard to review email campaign performance conducted by university. It includes elements such as open rate, click rate, emails sent, revenue by campaign, clicks, unique unsubscribes, etc. The best PPT templates are a great way to save time, energy, and resources. Slidegeeks have 100 percent editable powerpoint slides making them incredibly versatile. With these quality presentation templates, you can create a captivating and memorable presentation by combining visually appealing slides and effectively communicating your message. Download KPI Dashboard To Analyze Email Campaign Performance Running Marketing Campaigns Strategy SS V from Slidegeeks and deliver a wonderful presentation. The following slide depicts KPI dashboard to review email campaign performance conducted by university. It includes elements such as open rate, click rate, emails sent, revenue by campaign, clicks, unique unsubscribes, etc.


The best PPT templates are a great way to save time, energy, and resources. Slidegeeks have 100 percent editable powerpoint slides making them incredibly versatile. With these quality presentation templates, you can create a captivating and memorable presentation by combining visually appealing slides and effectively communicating your message. Download Kpi Dashboard To Analyze Website Traffic Comprehensive Guide To Implement Strategy SS V from Slidegeeks and deliver a wonderful presentation. The following slide showcases KPI dashboard to assess web traffic and content performance. It includes elements such as visitors by channel, overall conversion rate, search, direct, referral etc.

The following slide depicts KPI dashboard to review email campaign performance conducted by university. It includes elements such as open rate, click rate, emails sent, revenue by campaign, clicks, unique unsubscribes etc. Are you searching for a University Marketing Guide KPI Dashboard To Analyze Email Campaign Performance Strategy SS V that is uncluttered, straightforward, and original Its easy to edit, and you can change the colors to suit your personal or business branding. For a presentation that expresses how much effort you have put in, this template is ideal With all of its features, including tables, diagrams, statistics, and lists, its perfect for a business plan presentation. Make your ideas more appealing with these professional slides. Download University Marketing Guide KPI Dashboard To Analyze Email Campaign Performance Strategy SS V from Slidegeeks today. The following slide depicts KPI dashboard to review email campaign performance conducted by university. It includes elements such as open rate, click rate, emails sent, revenue by campaign, clicks, unique unsubscribes etc.
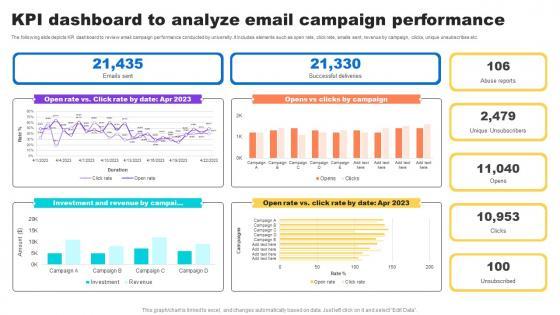
The following slide depicts KPI dashboard to review email campaign performance conducted by university. It includes elements such as open rate, click rate, emails sent, revenue by campaign, clicks, unique unsubscribes etc.The Kpi Dashboard To Analyze Email Campaign Key Step To Implementation University Strategy SS V is a compilation of the most recent design trends as a series of slides. It is suitable for any subject or industry presentation, containing attractive visuals and photo spots for businesses to clearly express their messages. This template contains a variety of slides for the user to input data, such as structures to contrast two elements, bullet points, and slides for written information. Slidegeeks is prepared to create an impression. The following slide depicts KPI dashboard to review email campaign performance conducted by university. It includes elements such as open rate, click rate, emails sent, revenue by campaign, clicks, unique unsubscribes etc.


The following slide showcases KPI dashboard to assess web traffic and content performance. It includes elements such as visitors by channel, overall conversion rate, search, direct, referral etc. The best PPT templates are a great way to save time, energy, and resources. Slidegeeks have 100 percent editable powerpoint slides making them incredibly versatile. With these quality presentation templates, you can create a captivating and memorable presentation by combining visually appealing slides and effectively communicating your message. Download KPI Dashboard To Analyze Website Traffic Developing And Creating Digital Content Strategy SS V from Slidegeeks and deliver a wonderful presentation. The following slide showcases KPI dashboard to assess web traffic and content performance. It includes elements such as visitors by channel, overall conversion rate, search, direct, referral etc.
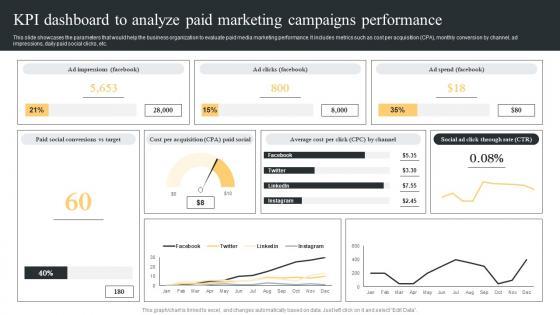

This slide showcases the parameters that would help the business organization to evaluate paid media marketing performance. It includes metrics such as cost per acquisition CPA, monthly conversion by channel, ad impressions, daily paid social clicks, etc. Coming up with a presentation necessitates that the majority of the effort goes into the content and the message you intend to convey. The visuals of a PowerPoint presentation can only be effective if it supplements and supports the story that is being told. Keeping this in mind our experts created KPI Dashboard To Analyze Paid Comprehensive Guide For Paid Media Marketing Strategies Sample Pdf to reduce the time that goes into designing the presentation. This way, you can concentrate on the message while our designers take care of providing you with the right template for the situation. This slide showcases the parameters that would help the business organization to evaluate paid media marketing performance. It includes metrics such as cost per acquisition CPA, monthly conversion by channel, ad impressions, daily paid social clicks, etc.
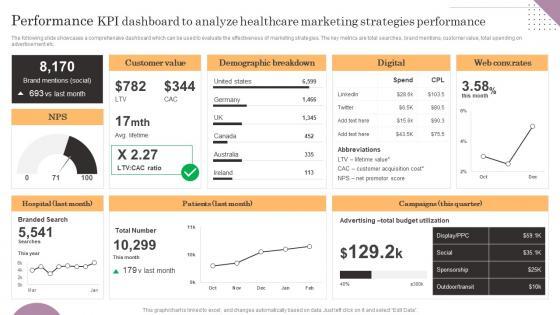

The following slide showcases a comprehensive dashboard which can be used to evaluate the effectiveness of marketing strategies. The key metrics are total searches, brand mentions, customer value, total spending on advertisement etc. Find a pre-designed and impeccable Performance KPI Dashboard To Analyze Healthcare Marketing General Management Brochure Pdf. The templates can ace your presentation without additional effort. You can download these easy-to-edit presentation templates to make your presentation stand out from others. So, what are you waiting for Download the template from Slidegeeks today and give a unique touch to your presentation. The following slide showcases a comprehensive dashboard which can be used to evaluate the effectiveness of marketing strategies. The key metrics are total searches, brand mentions, customer value, total spending on advertisement etc.
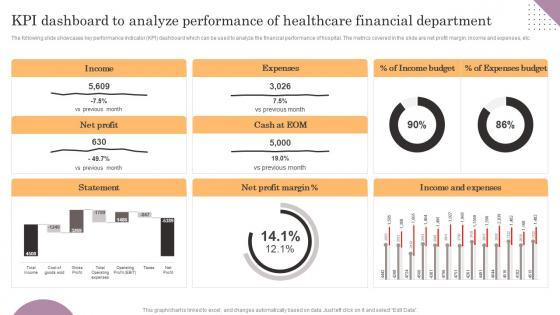

The following slide showcases key performance indicator KPI dashboard which can be used to analyze the financial performance of hospital. The metrics covered in the slide are net profit margin, income and expenses, etc. Slidegeeks has constructed KPI Dashboard To Analyze Performance Of Healthcare General Management Introduction Pdf after conducting extensive research and examination. These presentation templates are constantly being generated and modified based on user preferences and critiques from editors. Here, you will find the most attractive templates for a range of purposes while taking into account ratings and remarks from users regarding the content. This is an excellent jumping-off point to explore our content and will give new users an insight into our top-notch PowerPoint Templates. The following slide showcases key performance indicator KPI dashboard which can be used to analyze the financial performance of hospital. The metrics covered in the slide are net profit margin, income and expenses, etc.
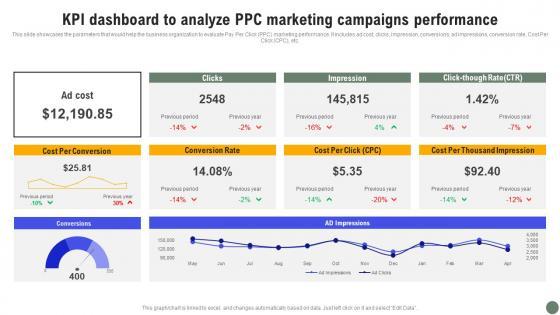

This slide showcases the parameters that would help the business organization to evaluate Pay Per Click PPC marketing performance. It includes ad cost, clicks, impression, conversions, ad impressions, conversion rate, Cost Per Click CPC, etc. Formulating a presentation can take up a lot of effort and time, so the content and message should always be the primary focus. The visuals of the PowerPoint can enhance the presenters message, so our KPI Dashboard To Analyze PPC Exhaustive Guide Of Pay Per Click Advertising Initiatives Inspiration Pdf was created to help save time. Instead of worrying about the design, the presenter can concentrate on the message while our designers work on creating the ideal templates for whatever situation is needed. Slidegeeks has experts for everything from amazing designs to valuable content, we have put everything into KPI Dashboard To Analyze PPC Exhaustive Guide Of Pay Per Click Advertising Initiatives Inspiration Pdf This slide showcases the parameters that would help the business organization to evaluate Pay Per Click PPC marketing performance. It includes ad cost, clicks, impression, conversions, ad impressions, conversion rate, Cost Per Click CPC, etc.
Do you know about Slidesgeeks Performance KPI Dashboard To Analyze Healthcare Operational Areas Healthcare Rules PDF These are perfect for delivering any kind od presentation. Using it, create PowerPoint presentations that communicate your ideas and engage audiences. Save time and effort by using our pre-designed presentation templates that are perfect for a wide range of topic. Our vast selection of designs covers a range of styles, from creative to business, and are all highly customizable and easy to edit. Download as a PowerPoint template or use them as Google Slides themes. The following slide showcases a comprehensive dashboard which can be used to evaluate the effectiveness of marketing strategies. The key metrics are total searches, brand mentions, customer value, total spending on advertisement etc.

Are you searching for a KPI Dashboard To Analyze Performance Of Healthcare Operational Areas Healthcare Clipart PDF that is uncluttered, straightforward, and original Its easy to edit, and you can change the colors to suit your personal or business branding. For a presentation that expresses how much effort you have put in, this template is ideal With all of its features, including tables, diagrams, statistics, and lists, its perfect for a business plan presentation. Make your ideas more appealing with these professional slides. Download Kpi Dashboard To Analyze Performance Of Healthcare Operational Areas Healthcare Clipart PDF from Slidegeeks today. The following slide showcases key performance indicator KPI dashboard which can be used to analyze the financial performance of hospital. The metrics covered in the slide are net profit margin, income and expenses, etc.
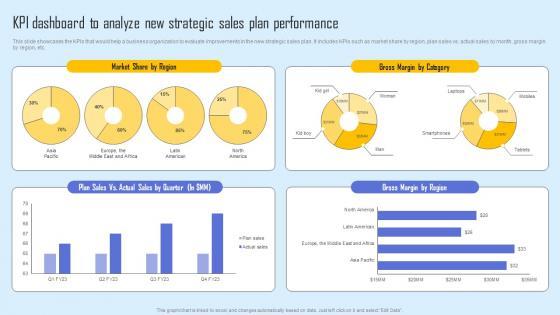
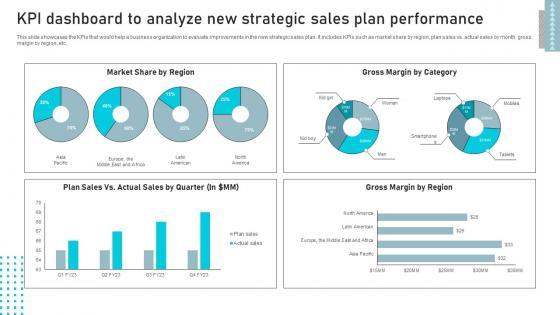
This slide showcases the KPIs that would help a business organization to evaluate improvements in the new strategic sales plan. It includes KPIs such as market share by region, plan sales vs. actual sales by month, gross margin by region, etc. Explore a selection of the finest KPI Dashboard Analyze New Effective Sales Strategy To Enhance Customer Retention Background Pdf here. With a plethora of professionally designed and pre made slide templates, you can quickly and easily find the right one for your upcoming presentation. You can use our KPI Dashboard Analyze New Effective Sales Strategy To Enhance Customer Retention Background Pdf to effectively convey your message to a wider audience. Slidegeeks has done a lot of research before preparing these presentation templates. The content can be personalized and the slides are highly editable. Grab templates today from Slidegeeks. This slide showcases the KPIs that would help a business organization to evaluate improvements in the new strategic sales plan. It includes KPIs such as market share by region, plan sales vs. actual sales by month, gross margin by region, etc.


This slide showcases the kpis that would help a business organization to evaluate improvements in the new strategic sales plan. It includes kpis such as market share by region, plan sales vs. Actual sales by month, gross margin by region, etc. Explore a selection of the finest KPI Dashboard To Analyze Developing Extensive Sales And Operations Strategy Slides Pdf here. With a plethora of professionally designed and pre made slide templates, you can quickly and easily find the right one for your upcoming presentation. You can use our KPI Dashboard To Analyze Developing Extensive Sales And Operations Strategy Slides Pdf to effectively convey your message to a wider audience. Slidegeeks has done a lot of research before preparing these presentation templates. The content can be personalized and the slides are highly editable. Grab templates today from Slidegeeks. This slide showcases the kpis that would help a business organization to evaluate improvements in the new strategic sales plan. It includes kpis such as market share by region, plan sales vs. Actual sales by month, gross margin by region, etc.

This slide showcases the KPIs that would help our business organization to evaluate improvements with the new financial strategy implementation. It includes total income, total expenses, accounts receivable, etc. Retrieve professionally designed KPI Dashboard To Analyze Financial Assessing Corporate Financial Techniques Clipart Pdf to effectively convey your message and captivate your listeners. Save time by selecting pre made slideshows that are appropriate for various topics, from business to educational purposes. These themes come in many different styles, from creative to corporate, and all of them are easily adjustable and can be edited quickly. Access them as PowerPoint templates or as Google Slides themes. You do not have to go on a hunt for the perfect presentation because Slidegeeks got you covered from everywhere. This slide showcases the KPIs that would help our business organization to evaluate improvements with the new financial strategy implementation. It includes total income, total expenses, accounts receivable, etc.
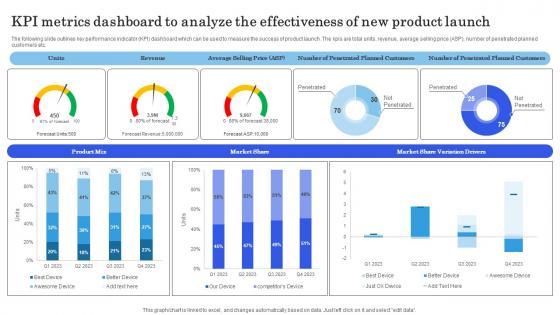

The following slide outlines key performance indicator KPI dashboard which can be used to measure the success of product launch. The kpis are total units, revenue, average selling price ASP, number of penetrated planned customers etc. Explore a selection of the finest Launching New Commodity Kpi Metrics Dashboard To Analyze The Effectiveness Demonstration Pdf here. With a plethora of professionally designed and pre-made slide templates, you can quickly and easily find the right one for your upcoming presentation. You can use our Launching New Commodity Kpi Metrics Dashboard To Analyze The Effectiveness Demonstration Pdf to effectively convey your message to a wider audience. Slidegeeks has done a lot of research before preparing these presentation templates. The content can be personalized and the slides are highly editable. Grab templates today from Slidegeeks. The following slide outlines key performance indicator KPI dashboard which can be used to measure the success of product launch. The kpis are total units, revenue, average selling price ASP, number of penetrated planned customers etc.

This slide showcases the KPIs that would help a business organization to evaluate improvements in the new strategic sales plan. It includes KPIs such as market share by region, plan sales vs. actual sales by month, gross margin by region, etc. Explore a selection of the finest KPI Dashboard To Analyze New Strategic Sales Plan Strategic Sales Plan To Enhance Ideas Pdf here. With a plethora of professionally designed and pre-made slide templates, you can quickly and easily find the right one for your upcoming presentation. You can use our KPI Dashboard To Analyze New Strategic Sales Plan Strategic Sales Plan To Enhance Ideas Pdf to effectively convey your message to a wider audience. Slidegeeks has done a lot of research before preparing these presentation templates. The content can be personalized and the slides are highly editable. Grab templates today from Slidegeeks. This slide showcases the KPIs that would help a business organization to evaluate improvements in the new strategic sales plan. It includes KPIs such as market share by region, plan sales vs. actual sales by month, gross margin by region, etc.


This slide showcases the KPIs that would help a business organization to evaluate improvements in the new strategic sales plan. It includes KPIs such as market share by region, plan sales vs. actual sales by month, gross margin by region, etc. Welcome to our selection of the Enhance Customer Retention Kpi Dashboard To Analyze New Strategic Sales Plan Elements Pdf. These are designed to help you showcase your creativity and bring your sphere to life. Planning and Innovation are essential for any business that is just starting out. This collection contains the designs that you need for your everyday presentations. All of our PowerPoints are 100 percent editable, so you can customize them to suit your needs. This multi-purpose template can be used in various situations. Grab these presentation templates today. This slide showcases the KPIs that would help a business organization to evaluate improvements in the new strategic sales plan. It includes KPIs such as market share by region, plan sales vs. actual sales by month, gross margin by region, etc.


This slide showcases the parameters that would help the business organization to evaluate buzz marketing performance. It includes user metrics, campaign metrics, social metrics, engagement rate, viral sign ups, etc. Slidegeeks is here to make your presentations a breeze with KPI Dashboard To Analyze Buzz Marketing Techniques For Engaging Summary Pdf With our easy to use and customizable templates, you can focus on delivering your ideas rather than worrying about formatting. With a variety of designs to choose from, you are sure to find one that suits your needs. And with animations and unique photos, illustrations, and fonts, you can make your presentation pop. So whether you are giving a sales pitch or presenting to the board, make sure to check out Slidegeeks first. This slide showcases the parameters that would help the business organization to evaluate buzz marketing performance. It includes user metrics, campaign metrics, social metrics, engagement rate, viral sign ups, etc.

This slide showcases the KPIs that would help a business organization to evaluate improvements in the new strategic sales plan. It includes KPIs such as market share by region, plan sales vs. actual sales by month, gross margin by region, etc. The best PPT templates are a great way to save time, energy, and resources. Slidegeeks have 100 percent editable powerpoint slides making them incredibly versatile. With these quality presentation templates, you can create a captivating and memorable presentation by combining visually appealing slides and effectively communicating your message. Download KPI Dashboard To Analyze New Business Sales Enhancement Campaign Portrait Pdf from Slidegeeks and deliver a wonderful presentation. This slide showcases the KPIs that would help a business organization to evaluate improvements in the new strategic sales plan. It includes KPIs such as market share by region, plan sales vs. actual sales by month, gross margin by region, etc.
DISPLAYING: 60 of 73 Item(s)
Page