- Sign up
- Sign In
 AI PPT Maker
 Templates
 PPT Bundles
 Design Services
 Business PPTs
 Business Plan
 Management
 Strategy
 Introduction PPT
 Roadmap
 Self Introduction
 Timelines
 Process
 Marketing
 Agenda
 Technology
 Medical
 Startup Business Plan
 Cyber Security
 Dashboards
 SWOT
SWOT Proposals
 Education
 Pitch Deck
 Digital Marketing
 KPIs
KPIs Project Management
 Product Management
 Artificial Intelligence
 Target Market
 Communication
 Supply Chain
 Google Slides
 Research Services
 One Pagers
 All Categories
Key financial chart PowerPoint Presentation Templates and Google Slides
5 Item(s)
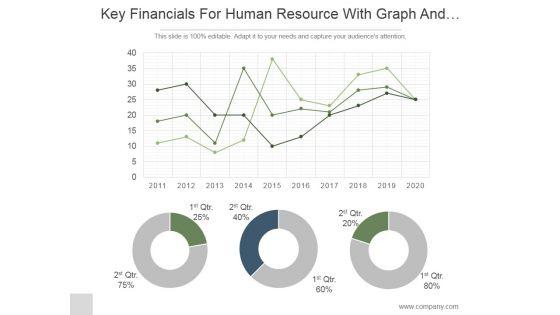

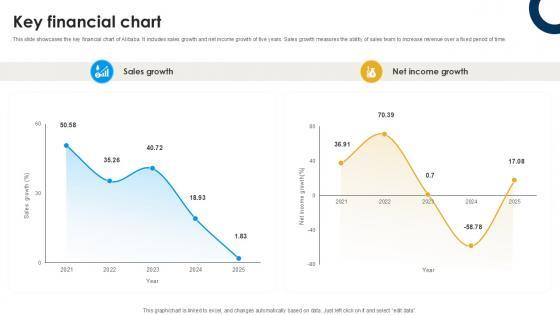


This slide showcases the key financial chart of Alibaba. It includes sales growth and net income growth of five years. Sales growth measures the ability of sales team to increase revenue over a fixed period of time. This modern and well-arranged Key Financial Chart International Trade Of Products And Services PPT Template CP SS V provides lots of creative possibilities. It is very simple to customize and edit with the Powerpoint Software. Just drag and drop your pictures into the shapes. All facets of this template can be edited with Powerpoint, no extra software is necessary. Add your own material, put your images in the places assigned for them, adjust the colors, and then you can show your slides to the world, with an animated slide included. This slide showcases the key financial chart of Alibaba. It includes sales growth and net income growth of five years. Sales growth measures the ability of sales team to increase revenue over a fixed period of time.

This slide showcases the sales of General electric. It includes sales growth of five years. Sales growth measures the ability of sales team to increase revenue over a fixed period of time and also depicts net income growth. Explore a selection of the finest Key Financial Chart Global Energy Company Profile PPT Example CP SS V here. With a plethora of professionally designed and pre-made slide templates, you can quickly and easily find the right one for your upcoming presentation. You can use our Key Financial Chart Global Energy Company Profile PPT Example CP SS V to effectively convey your message to a wider audience. Slidegeeks has done a lot of research before preparing these presentation templates. The content can be personalized and the slides are highly editable. Grab templates today from Slidegeeks. This slide showcases the sales of General electric. It includes sales growth of five years. Sales growth measures the ability of sales team to increase revenue over a fixed period of time and also depicts net income growth.


This slide showcases the sales of General electric. It includes sales growth of five years. Sales growth measures the ability of sales team to increase revenue over a fixed period of time and also depicts net income growth. Explore a selection of the finest Key Financial Chart Military Aircraft Engine Manufacturing PPT Presentation CP SS V here. With a plethora of professionally designed and pre-made slide templates, you can quickly and easily find the right one for your upcoming presentation. You can use our Key Financial Chart Military Aircraft Engine Manufacturing PPT Presentation CP SS V to effectively convey your message to a wider audience. Slidegeeks has done a lot of research before preparing these presentation templates. The content can be personalized and the slides are highly editable. Grab templates today from Slidegeeks. This slide showcases the sales of General electric. It includes sales growth of five years. Sales growth measures the ability of sales team to increase revenue over a fixed period of time and also depicts net income growth.


This slide showcases the sales of Aerospace company. It includes sales growth and net income growth of five years. Sales growth measures the ability of sales team to increase revenue over a fixed period of time. Coming up with a presentation necessitates that the majority of the effort goes into the content and the message you intend to convey. The visuals of a PowerPoint presentation can only be effective if it supplements and supports the story that is being told. Keeping this in mind our experts created Key Financial Chart Digital Marketings Strategies PPT PowerPoint CP SS V to reduce the time that goes into designing the presentation. This way, you can concentrate on the message while our designers take care of providing you with the right template for the situation. This slide showcases the sales of Aerospace company. It includes sales growth and net income growth of five years. Sales growth measures the ability of sales team to increase revenue over a fixed period of time.
5 Item(s)