- Sign up
- Sign In
 AI PPT Maker
 Templates
 PPT Bundles
 Design Services
 Business PPTs
 Business Plan
 Management
 Strategy
 Introduction PPT
 Roadmap
 Self Introduction
 Timelines
 Process
 Marketing
 Agenda
 Technology
 Medical
 Startup Business Plan
 Cyber Security
 Dashboards
 SWOT
SWOT Proposals
 Education
 Pitch Deck
 Digital Marketing
 KPIs
KPIs Project Management
 Product Management
 Artificial Intelligence
 Target Market
 Communication
 Supply Chain
 Google Slides
 Research Services
 One Pagers
 All Categories
Indicates business PowerPoint Presentation Templates and Google Slides
DISPLAYING: 60 of 134 Item(s)
Page
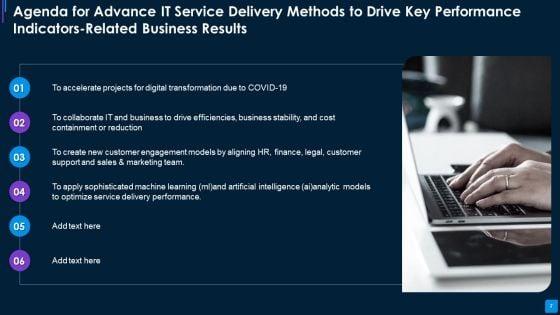
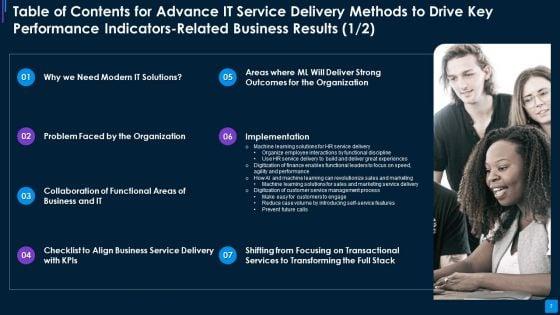
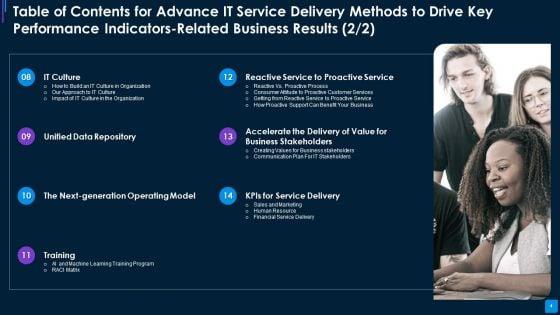
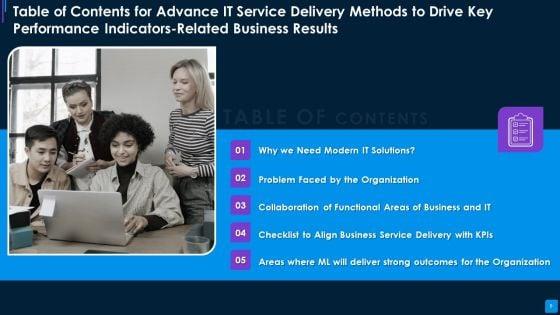


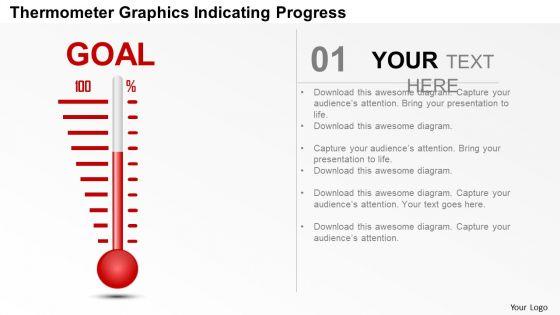
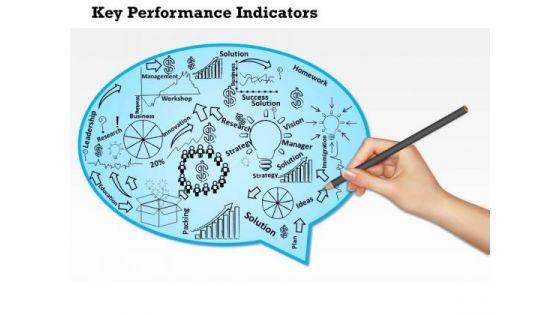
This complete deck acts as a great communication tool. It helps you in conveying your business message with personalized sets of graphics, icons etc. Comprising a set of fifty six slides, this complete deck can help you persuade your audience. It also induces strategic thinking as it has been thoroughly researched and put together by our experts. Not only is it easily downloadable but also editable. The color, graphics, theme any component can be altered to fit your individual needs. So grab it now.


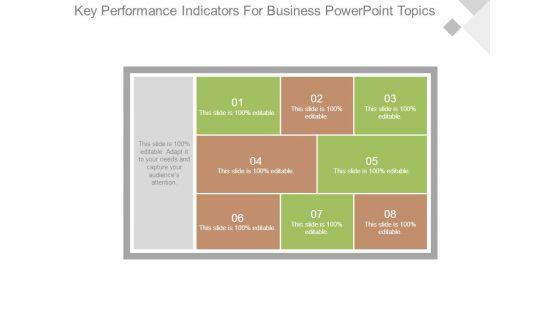
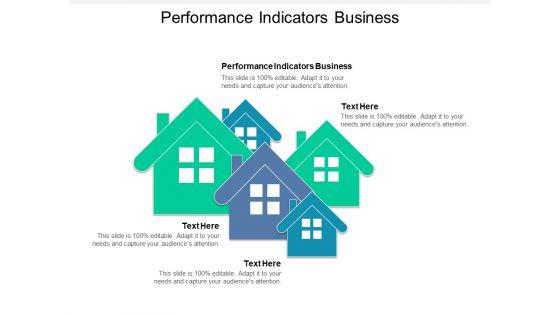
Share a great deal of information on the topic by deploying this business strategic development performance indicators ppt powerpoint presentation complete deck with slides. Support your ideas and thought process with this prefabricated set. It includes a set of twelve slides, all fully modifiable and editable. Each slide can be restructured and induced with the information and content of your choice. You can add or remove large content boxes as well, to make this PPT slideshow more personalized. Its high-quality graphics and visuals help in presenting a well-coordinated pitch. This PPT template is also a resourceful tool to take visual cues from and implement the best ideas to help your business grow and expand. The main attraction of this well-formulated deck is that everything is editable, giving you the freedom to adjust it to your liking and choice. Changes can be made in the background and theme as well to deliver an outstanding pitch. Therefore, click on the download button now to gain full access to this multifunctional set.


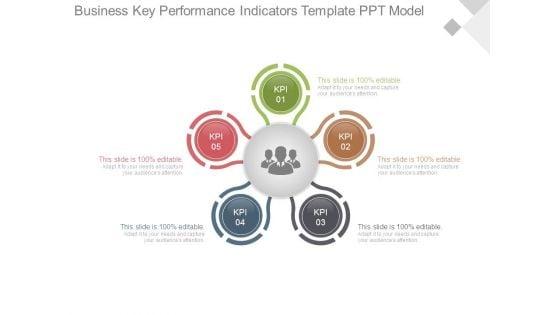


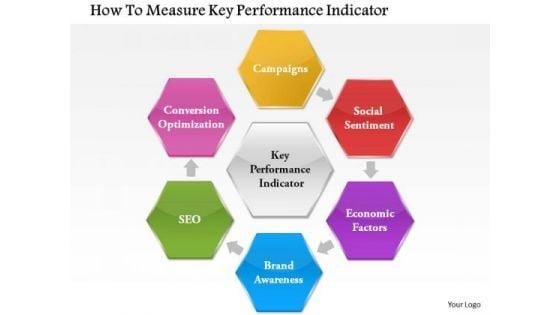


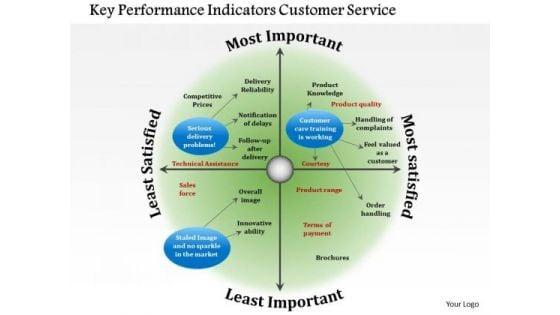
Our above diagram provides framework of key performance indicators for project management. It contains four interconnected text boxes. Download this diagram to make professional presentations on project management. This diagram enables the users to create their own display of the required processes in an easy way.


The following slide showcases ecommerce accounts management dashboard. It provides information about income, expenses, cash collected, cash spent, tax collected, tax claim, stock sold, invoice, etc. There are so many reasons you need a Managing E Commerce Business Accounting Dashboard Indicating Online Store Accounts Overview Inspiration PDF. The first reason is you can not spend time making everything from scratch, Thus, Slidegeeks has made presentation templates for you too. You can easily download these templates from our website easily.
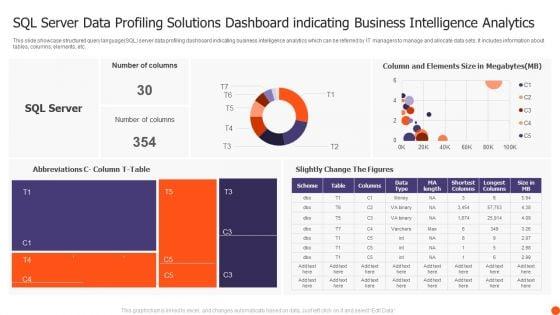
This slide showcase structured query language SQL server data profiling dashboard indicating business intelligence analytics which can be referred by IT managers to manage and allocate data sets. It includes information about tables, columns, elements, etc. Showcasing this set of slides titled SQL Server Data Profiling Solutions Dashboard Indicating Business Intelligence Analytics Structure PDF. The topics addressed in these templates are Number Columns, Slightly Change Figures, SQL Server. All the content presented in this PPT design is completely editable. Download it and make adjustments in color, background, font etc. as per your unique business setting.
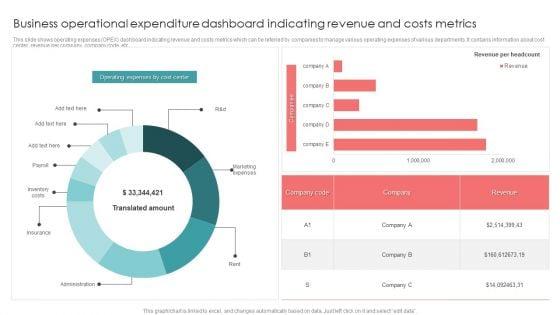
This slide shows operating expenses OPEX dashboard indicating revenue and costs metrics which can be referred by companies to manage various operating expenses of various departments. It contains information about cost center, revenue per company, company code, etc. Pitch your topic with ease and precision using this Business Operational Expenditure Dashboard Indicating Revenue And Costs Metrics Pictures PDF. This layout presents information on Business Operational, Costs Metrics, Revenue. It is also available for immediate download and adjustment. So, changes can be made in the color, design, graphics or any other component to create a unique layout.
This slide shows statistics indicating recurring operating expenditure OPEX in telecom operations which can benefit their executives in evaluating the current expenses and make cost effective amendments for future operations. It includes information about maintenance, repair, network charging and billing, customer support, marketing and operational planning costs. Pitch your topic with ease and precision using this Statistics Indicating Recurring Business Operational Expenditure In Telecom Operations Icons PDF. This layout presents information on Company, Costs, Marketing Costs. It is also available for immediate download and adjustment. So, changes can be made in the color, design, graphics or any other component to create a unique layout.
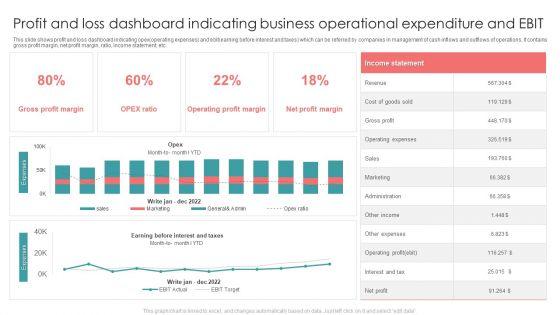
This slide shows profit and loss dashboard indicating opex operating expenses and ebit earning before interest and taxes which can be referred by companies in management of cash inflows and outflows of operations. It contains gross profit margin, net profit margin, ratio, income statement, etc. Showcasing this set of slides titled Profit And Loss Dashboard Indicating Business Operational Expenditure And EBIT Formats PDF. The topics addressed in these templates are Revenue, Gross Profit, Sales. All the content presented in this PPT design is completely editable. Download it and make adjustments in color, background, font etc. as per your unique business setting.


Showcasing this set of slides titled Business Sales Highlights With Profitability Indicator Ratios Download PDF. The topics addressed in these templates are Net Profit, Net Sales, Profitability Indicator Ratios. All the content presented in this PPT design is completely editable. Download it and make adjustments in color, background, font etc. as per your unique business setting.

This slide shows opportunity analysis dashboard indicating market performance which contains opportunity count by size, sales stage, region, revenue and average revenue. Pitch your topic with ease and precision using this Opportunity Analysis Dashboard Indicating Business Performance Information Rules PDF. This layout presents information on Opportunity Count, Revenue, Sales. It is also available for immediate download and adjustment. So, changes can be made in the color, design, graphics or any other component to create a unique layout.
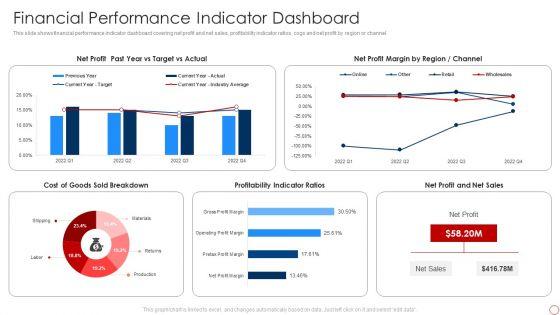

This slide shows financial performance indicator dashboard covering net profit and net sales, profitability indicator ratios, cogs and net profit by region or channel. Deliver and pitch your topic in the best possible manner with this Kpis For Evaluating Business Sustainability Financial Performance Indicator Dashboard Demonstration PDF. Use them to share invaluable insights on Net Profit, Net Profit Margin, Profitability Indicator Ratios and impress your audience. This template can be altered and modified as per your expectations. So, grab it now.


This slide shows financial performance indicator dashboard covering net profit and net sales, profitability indicator ratios, cogs and net profit by region or channel. Deliver an awe inspiring pitch with this creative Metrics To Measure Business Performance Financial Performance Indicator Dashboard Pictures PDF bundle. Topics like Net Profit, Net Sales, Cost Goods, Sold Breakdown can be discussed with this completely editable template. It is available for immediate download depending on the needs and requirements of the user.
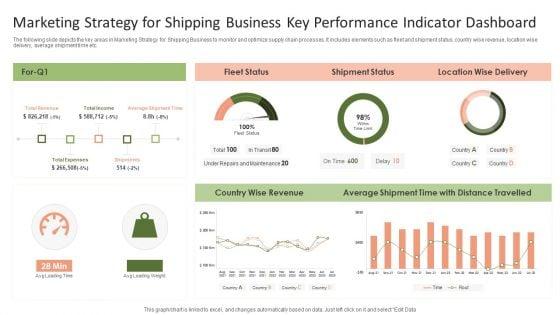
The following slide depicts the key areas in Marketing Strategy for Shipping Business to monitor and optimize supply chain processes. It includes elements such as fleet and shipment status, country wise revenue, location wise delivery, average shipment time etc.Pitch your topic with ease and precision using this Marketing Strategy For Shipping Business Key Performance Indicator Dashboard Graphics PDF. This layout presents information on Shipment Status, Average Shipment, Wise Revenue. It is also available for immediate download and adjustment. So, changes can be made in the color, design, graphics or any other component to create a unique layout.
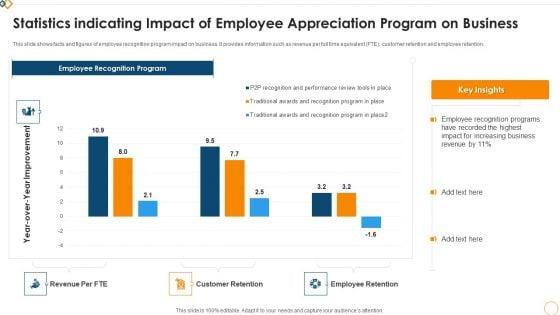

This slide shows facts and figures of employee recognition program impact on business. It provides information such as revenue per full time equivalent FTE, customer retention and employee retention. Showcasing this set of slides titled Statistics Indicating Impact Of Employee Appreciation Program On Business Graphics PDF. The topics addressed in these templates are Employee Recognition Program, Revenue Per FTE, Customer Retention. All the content presented in this PPT design is completely editable. Download it and make adjustments in color, background, font etc. as per your unique business setting.
Presenting Corporate Identity Icon Indicating Business Card And Letterhead Diagrams PDF to dispense important information. This template comprises four stages. It also presents valuable insights into the topics including Business, Letterhead, Corporate. This is a completely customizable PowerPoint theme that can be put to use immediately. So, download it and address the topic impactfully.
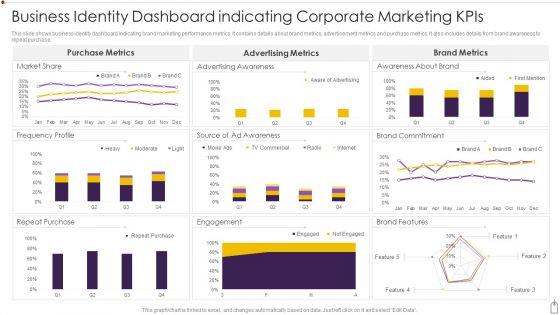

This slide shows business identity dashboard indicating brand marketing performance metrics. It contains details about brand metrics, advertisement metrics and purchase metrics. It also includes details from brand awareness to repeat purchase. Showcasing this set of slides titled Business Identity Dashboard Indicating Corporate Marketing Kpis Diagrams PDF. The topics addressed in these templates are Purchase, Engagement, Market Share. All the content presented in this PPT design is completely editable. Download it and make adjustments in color, background, font etc. as per your unique business setting.
Presenting Cooperative Competition Business Agreement Icon Indicating Partnership Clipart PDF to dispense important information. This template comprises four stages. It also presents valuable insights into the topics including Cooperative Competition Business Agreement Icon Indicating Partnership. This is a completely customizable PowerPoint theme that can be put to use immediately. So, download it and address the topic impactfully.

This slide represents facts stating affect of sales force automation on business performance. It contains information about chatbot, data analysis, email, data collection, sales projection, etc. Pitch your topic with ease and precision using this statistics indicating impact of sfa on business performance ppt powerpoint presentation gallery outfit pdf. This layout presents information on automatic email and chatbot service, data analysis automation, robotic personal assistants. It is also available for immediate download and adjustment. So, changes can be made in the color, design, graphics or any other component to create a unique layout.
Pitch your topic with ease and precision using this business meeting plan icon indicating manager presenting objectives diagrams pdf This layout presents information on business meeting plan icon indicating manager presenting objectives It is also available for immediate download and adjustment. So, changes can be made in the color, design, graphics or any other component to create a unique layout.
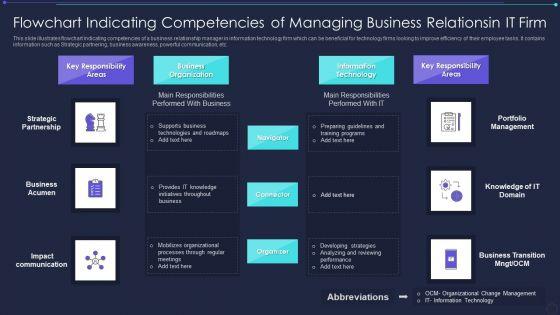
Showcasing this set of slides titled flowchart indicating competencies of managing business relationsin it firm designs pdf. The topics addressed in these templates are strategic partnership, business acumen, impact communication. All the content presented in this PPT design is completely editable. Download it and make adjustments in color, background, font etc. as per your unique business setting.

This slide showcases circular chart depicting funding ask for key business areas. It provides information about capital expenditure, marketing and sales, product development, personnel, etc. Pitch your topic with ease and precision using this pie chart indicating funding request for key business areas ppt show topics pdf. This layout presents information on product development, capex, marketing and sales, personnel. It is also available for immediate download and adjustment. So, changes can be made in the color, design, graphics or any other component to create a unique layout.


This slide shows the QA Quality Assurance Key Performance Indicators before Strategy Implementation. These stats are related to Active Defect Rate, Automated Testing Rate, Product Quality, Overall Team Effectiveness, Average Product Delivery Time etc. from the years 2020 to 2022 along with key takeaways. Deliver an awe inspiring pitch with this creative quality assurance transformation strategies to improve business performance efficiency qa key performance indicators information pdf bundle. Topics like automated testing rate, defects fixed per day rate, overall team effectiveness can be discussed with this completely editable template. It is available for immediate download depending on the needs and requirements of the user.

Pitch your topic with ease and precision using this progress indicator ring slide for small business marketing ideas guidelines pdf. This layout presents information on progress indicator ring slide for small business marketing ideas. It is also available for immediate download and adjustment. So, changes can be made in the color, design, graphics or any other component to create a unique layout.


Pitch your topic with ease and precision using this progress indicator ring graphics for business customer satisfaction background pdf. This layout presents information on progress indicator ring graphics for business customer satisfaction. It is also available for immediate download and adjustment. So, changes can be made in the color, design, graphics or any other component to create a unique layout.


Showcasing this set of slides titled progress indicator ring diagram for exit strategy business plan information pdf. The topics addressed in these templates are progress indicator ring diagram for exit strategy business plan. All the content presented in this PPT design is completely editable. Download it and make adjustments in color, background, font etc. as per your unique business setting.


Pitch your topic with ease and precision using this progress indicator ring diagram for business to business trading graphics pdf. This layout presents information on progress indicator ring diagram for business to business trading. It is also available for immediate download and adjustment. So, changes can be made in the color, design, graphics or any other component to create a unique layout.
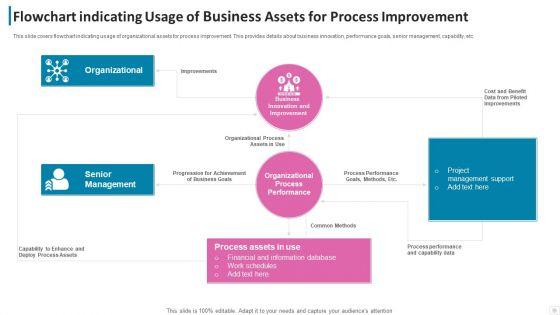
This slide covers flowchart indicating usage of organizational assets for process improvement. This provides details about business innovation, performance goals, senior management, capability, etc. Pitch your topic with ease and precision using this flowchart indicating usage of business assets for process improvement formats pdf. This layout presents information on organizational, senior management, organizational process. It is also available for immediate download and adjustment. So, changes can be made in the color, design, graphics or any other component to create a unique layout.
DISPLAYING: 60 of 134 Item(s)
Page