- Sign up
- Sign In
 AI PPT Maker
 Templates
 PPT Bundles
 Design Services
 Business PPTs
 Business Plan
 Management
 Strategy
 Introduction PPT
 Roadmap
 Self Introduction
 Timelines
 Process
 Marketing
 Agenda
 Technology
 Medical
 Startup Business Plan
 Cyber Security
 Dashboards
 SWOT
SWOT Proposals
 Education
 Pitch Deck
 Digital Marketing
 KPIs
KPIs Project Management
 Product Management
 Artificial Intelligence
 Target Market
 Communication
 Supply Chain
 Google Slides
 Research Services
 One Pagers
 All Categories
Improvement kpi dashboard PowerPoint Presentation Templates and Google Slides
60 Item(s)
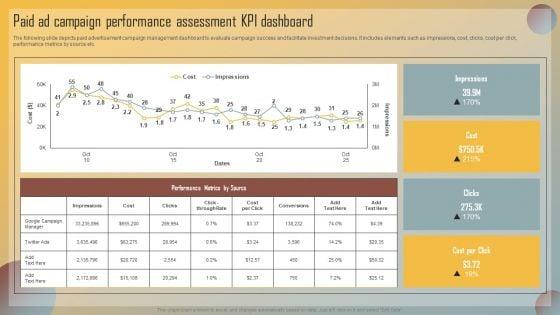

The following slide depicts paid advertisement campaign management dashboard to evaluate campaign success and facilitate investment decisions. It includes elements such as impressions, cost, clicks, cost per click, performance metrics by source etc. There are so many reasons you need a Guide For Marketing Analytics To Improve Decisions Paid Ad Campaign Performance Assessment KPI Dashboard Microsoft PDF. The first reason is you cannot spend time making everything from scratch, Thus, Slidegeeks has made presentation templates for you too. You can easily download these templates from our website easily.
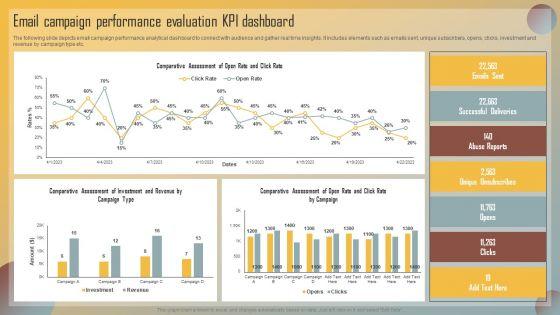
The following slide depicts email campaign performance analytical dashboard to connect with audience and gather real time insights. It includes elements such as emails sent, unique subscribers, opens, clicks, investment and revenue by campaign type etc. Create an editable Guide For Marketing Analytics To Improve Decisions Email Campaign Performance Evaluation KPI Dashboard Summary PDF that communicates your idea and engages your audience. Whether youre presenting a business or an educational presentation, pre designed presentation templates help save time. Guide For Marketing Analytics To Improve Decisions Email Campaign Performance Evaluation KPI Dashboard Summary PDF is highly customizable and very easy to edit, covering many different styles from creative to business presentations. Slidegeeks has creative team members who have crafted amazing templates. So, go and get them without any delay.


This slide showcases the KPIs that would help our business organization to evaluate improvements with the new financial strategy implementation. It includes total income, total expenses, accounts receivable, etc. The best PPT templates are a great way to save time, energy, and resources. Slidegeeks have 100 percent editable powerpoint slides making them incredibly versatile. With these quality presentation templates, you can create a captivating and memorable presentation by combining visually appealing slides and effectively communicating your message. Download Adjusting Financial Strategies And Planning KPI Dashboard To Analyze Financial Improvements Inspiration PDF from Slidegeeks and deliver a wonderful presentation.
This slide showcases the KPIs that would help a business organization to track the improvements in the new recruitment process. It includes technical hiring, non-technical hiring, current hiring pipeline, etc. This Tracking The Improvements In HR Recruitment Process With KPI Dashboard Introduction PDF from Slidegeeks makes it easy to present information on your topic with precision. It provides customization options, so you can make changes to the colors, design, graphics, or any other component to create a unique layout. It is also available for immediate download, so you can begin using it right away. Slidegeeks has done good research to ensure that you have everything you need to make your presentation stand out. Make a name out there for a brilliant performance.
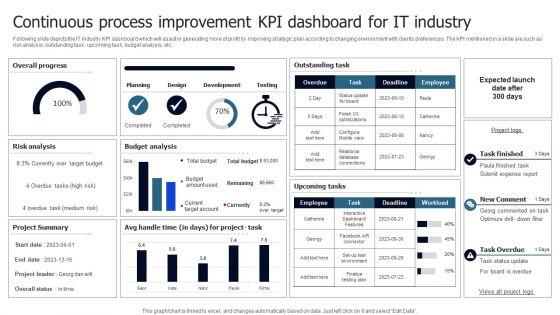
Following slide depicts the IT industry KPI dashboard which will assist in generating more of profit by improving strategic plan according to changing environment with clients preferences .The KPI mentioned in a slide are such as risk analysis, outstanding task , upcoming task, budget analysis, etc. Pitch your topic with ease and precision using this Continuous Process Improvement KPI Dashboard For IT Industry Clipart PDF. This layout presents information on Overall Progress, Risk Analysis, Budget Analysis. It is also available for immediate download and adjustment. So, changes can be made in the color, design, graphics or any other component to create a unique layout.
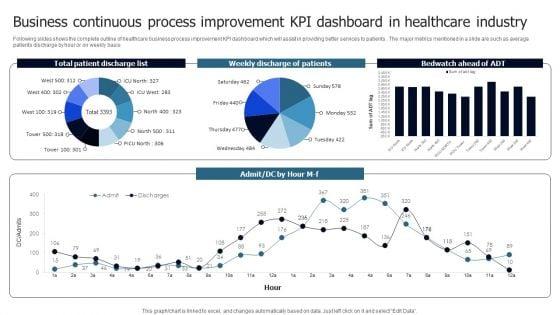

Following slides shows the complete outline of healthcare business process improvement KPI dashboard which will assist in providing better services to patients . The major metrics mentioned in a slide are such as average patients discharge by hour or on weekly basis Showcasing this set of slides titled Business Continuous Process Improvement KPI Dashboard In Healthcare Industry Guidelines PDF. The topics addressed in these templates are Patients, Discharge List, Healthcare Industry. All the content presented in this PPT design is completely editable. Download it and make adjustments in color, background, font etc. as per your unique business setting.
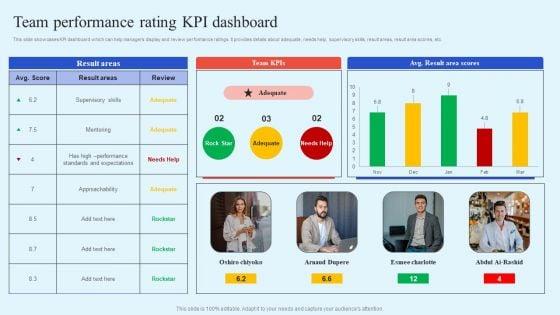

This slide showcases KPI dashboard which can help managers display and review performance ratings. It provides details about adequate, needs help, supervisory skills, result areas, result area scores, etc. Unleash your creativity with our How Leaders Can Improve Team Effectiveness Team Performance Rating KPI Dashboard Rules PDF single-slide PPT template. Whether you are a seasoned presenter or a newbie, our editable and visually-stunning template will make your presentations shine. This template is versatile and easy to use. Make your presentations unforgettable with our premium template and leave a lasting impression on your audience.


This slide showcases KPI dashboard which can help sales team managers display and review performance rankings. It provides details about weekly sales score, target percentage, total target, sales team members, etc. Unleash your creativity with our How Leaders Can Improve Team Effectiveness Sales Team Performance Management KPI Dashboard Infographics PDF single-slide PPT template. Whether you are a seasoned presenter or a newbie, our editable and visually-stunning template will make your presentations shine. This template is versatile and easy to use. Make your presentations unforgettable with our premium template and leave a lasting impression on your audience.
This slide covers the dashboard for analyzing customer loyalty with metrics such as NPS, loyal customer rate, premium users, CLV, customer churn, revenue churn, net retention, MRR growth, etc. Welcome to our selection of the Ultimate Guide To Improve Customer Support And Services Kpi Dashboard For Tracking Customer Retention Guidelines PDF. These are designed to help you showcase your creativity and bring your sphere to life. Planning and Innovation are essential for any business that is just starting out. This collection contains the designs that you need for your everyday presentations. All of our PowerPoints are 100 percent editable, so you can customize them to suit your needs. This multi purpose template can be used in various situations. Grab these presentation templates today.
Google Keyword Assessment KPI Dashboard For Tracking Improvement In Website Traffic Infographics PDF
Following slide demonstrates keyword analysis dashboard which can be used by business to track website traffic performance. It includes metrics such as average keyword position, keyword ranking distribution, keyword ranking, keyword in top 3, top 10, top 20 and top 100. Showcasing this set of slides titled Google Keyword Assessment KPI Dashboard For Tracking Improvement In Website Traffic Infographics PDF. The topics addressed in these templates are Keyword Ranking, Keyword Ranking Distribution, Average Keyword Position. All the content presented in this PPT design is completely editable. Download it and make adjustments in color, background, font etc. as per your unique business setting.
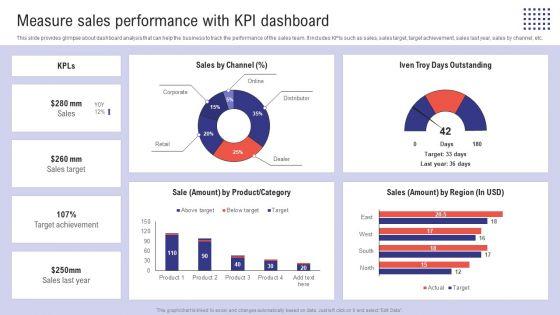
This slide provides glimpse about dashboard analysis that can help the business to track the performance of the sales team. It includes KPIs such as sales, sales target, target achievement, sales last year, sales by channel, etc. Explore a selection of the finest Planning Sales Campaign To Improve Measure Sales Performance With Kpi Dashboard Topics PDF here. With a plethora of professionally designed and pre-made slide templates, you can quickly and easily find the right one for your upcoming presentation. You can use our Planning Sales Campaign To Improve Measure Sales Performance With Kpi Dashboard Topics PDF to effectively convey your message to a wider audience. Slidegeeks has done a lot of research before preparing these presentation templates. The content can be personalized and the slides are highly editable. Grab templates today from Slidegeeks.


Planning Sales Campaign To Improve KPI Dashboard To Analyze New Strategic Sales Plan Information PDF
This slide showcases the KPIs that would help a business organization to evaluate improvements in the new strategic sales plan. It includes KPIs such as market share by region, plan sales vs. actual sales by month, gross margin by region, etc. Welcome to our selection of the Planning Sales Campaign To Improve KPI Dashboard To Analyze New Strategic Sales Plan Information PDF. These are designed to help you showcase your creativity and bring your sphere to life. Planning and Innovation are essential for any business that is just starting out. This collection contains the designs that you need for your everyday presentations. All of our PowerPoints are 100 percent editable, so you can customize them to suit your needs. This multi-purpose template can be used in various situations. Grab these presentation templates today.
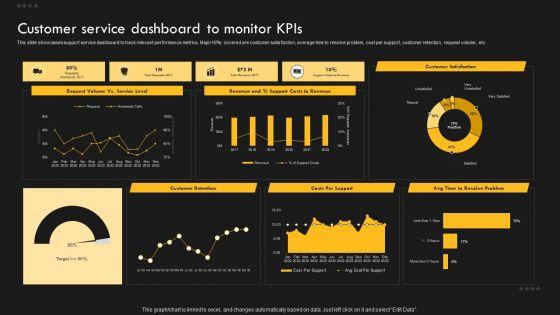

This slide showcases support service dashboard to track relevant performance metrics. Major KPIs covered are customer satisfaction, average time to resolve problem, cost per support, customer retention, request volume, etc. Do you have an important presentation coming up. Are you looking for something that will make your presentation stand out from the rest. Look no further than Service Improvement Techniques For Client Retention Customer Service Dashboard To Monitor Kpis Clipart PDF. With our professional designs, you can trust that your presentation will pop and make delivering it a smooth process. And with Slidegeeks, you can trust that your presentation will be unique and memorable. So why wait. Grab Service Improvement Techniques For Client Retention Customer Service Dashboard To Monitor Kpis Clipart PDF today and make your presentation stand out from the rest.
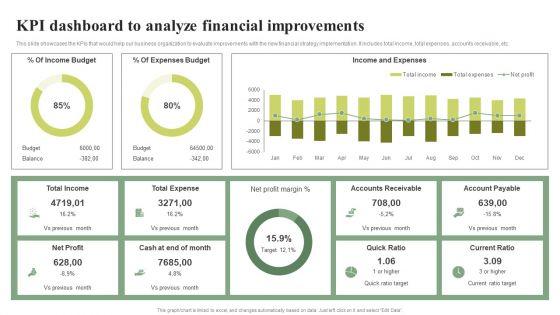

This slide showcases the KPIs that would help our business organization to evaluate improvements with the new financial strategy implementation. It includes total income, total expenses, accounts receivable, etc.Find highly impressive KPI Dashboard To Analyze Financial Improvements Effective Planning For Monetary Portrait PDF on Slidegeeks to deliver a meaningful presentation. You can save an ample amount of time using these presentation templates. No need to worry to prepare everything from scratch because Slidegeeks experts have already done a huge research and work for you. You need to download KPI Dashboard To Analyze Financial Improvements Effective Planning For Monetary Portrait PDF for your upcoming presentation. All the presentation templates are 100precent editable and you can change the color and personalize the content accordingly. Download now,
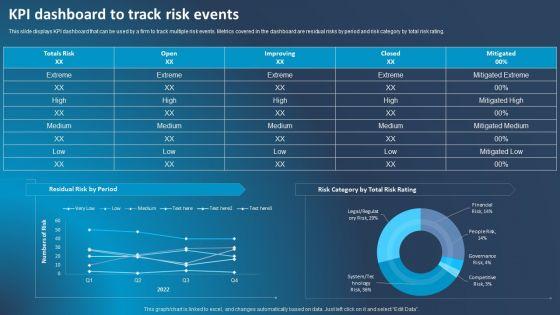

This slide displays KPI dashboard that can be used by a firm to track multiple risk events. Metrics covered in the dashboard are residual risks by period and risk category by total risk rating. Are you in need of a template that can accommodate all of your creative concepts This one is crafted professionally and can be altered to fit any style. Use it with Google Slides or PowerPoint. Include striking photographs, symbols, depictions, and other visuals. Fill, move around, or remove text boxes as desired. Test out color palettes and font mixtures. Edit and save your work, or work with colleagues. Download Improving Corporate Performance KPI Dashboard To Track Risk Events Sample PDF and observe how to make your presentation outstanding. Give an impeccable presentation to your group and make your presentation unforgettable.

Mentioned slide portrays customer service measurement KPI dashboard that includes metrics namely request volume vs. service level, customer satisfaction, customer retention, costs per support and average time to solve issue. Do you have to make sure that everyone on your team knows about any specific topic I yes, then you should give Improving Corporate Performance Customer Service Measurement Kpi Dashboard Microsoft PDF a try. Our experts have put a lot of knowledge and effort into creating this impeccable Improving Corporate Performance Customer Service Measurement Kpi Dashboard Microsoft PDF. You can use this template for your upcoming presentations, as the slides are perfect to represent even the tiniest detail. You can download these templates from the Slidegeeks website and these are easy to edit. So grab these today.
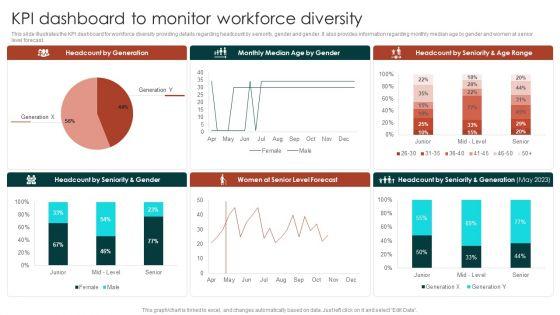

This slide illustrates the KPI dashboard for workforce diversity providing details regarding headcount by seniority, gender and gender. It also provides information regarding monthly median age by gender and women at senior level forecast.Find a pre-designed and impeccable Diversity Management Plan To Improve Workplace Culture KPI Dashboard To Monitor Workforce Microsoft PDF. The templates can ace your presentation without additional effort. You can download these easy-to-edit presentation templates to make your presentation stand out from others. So, what are you waiting for. Download the template from Slidegeeks today and give a unique touch to your presentation.


Mentioned slide portrays KPI dashboard that can be used to monitor department wise security incidents. KPIs covered are new cases, total cases, resolved and pending cases.This Kpi Dashboard To Track Department Wise Improving Cybersecurity With Incident Guidelines PDF is perfect for any presentation, be it in front of clients or colleagues. It is a versatile and stylish solution for organizing your meetings. The Kpi Dashboard To Track Department Wise Improving Cybersecurity With Incident Guidelines PDF features a modern design for your presentation meetings. The adjustable and customizable slides provide unlimited possibilities for acing up your presentation. Slidegeeks has done all the homework before launching the product for you. So, do not wait, grab the presentation templates today


This slide reflects the key performance indicator dashboard to track the performance of safety program. It includes information regarding the total manpower, manhours, unsafe conditions, lost time injuries frequency, injuries severity rate, along with the training hours. Make sure to capture your audiences attention in your business displays with our gratis customizable Improvement Of Safety Performance At Construction Site Kpi Dashboard To Track Safety Program Microsoft PDF. These are great for business strategies, office conferences, capital raising or task suggestions. If you desire to acquire more customers for your tech business and ensure they stay satisfied, create your own sales presentation with these plain slides.
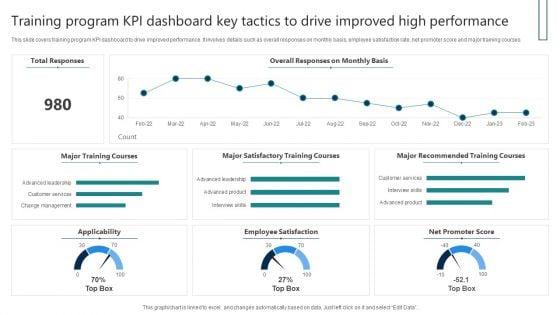
This slide covers training program KPI dashboard to drive improved performance. It involves details such as overall responses on monthly basis, employee satisfaction rate, net promoter score and major training courses. Showcasing this set of slides titled Training Program KPI Dashboard Key Tactics To Drive Improved High Performance Download PDF. The topics addressed in these templates are Total Responses, Major Training Courses, Employee Satisfaction. All the content presented in this PPT design is completely editable. Download it and make adjustments in color, background, font etc. as per your unique business setting.
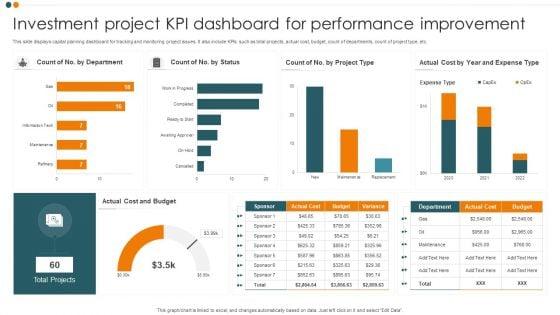
This slide displays capital planning dashboard for tracking and monitoring project issues. It also include KPIs such as total projects, actual cost, budget, count of departments, count of project type, etc. Pitch your topic with ease and precision using this Investment Project KPI Dashboard For Performance Improvement Guidelines PDF. This layout presents information on Cost And Budget, Total Projects, Expense Type. It is also available for immediate download and adjustment. So, changes can be made in the color, design, graphics or any other component to create a unique layout.
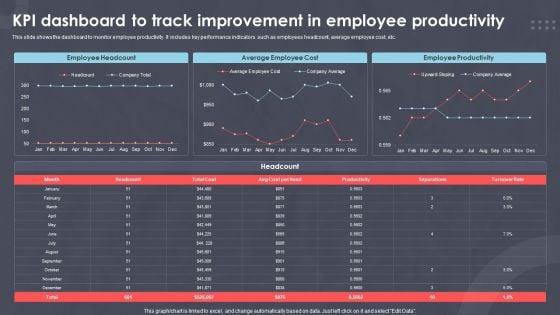
This slide shows the dashboard to monitor employee productivity. It includes key performance indicators such as employees headcount, average employee cost, etc.Showcasing this set of slides titled XXXXXXXXX. The topics addressed in these templates are Employee Headcount, Average Employee, Employee Productivity. All the content presented in this PPT design is completely editable. Download it and make adjustments in color, background, font etc. as per your unique business setting.
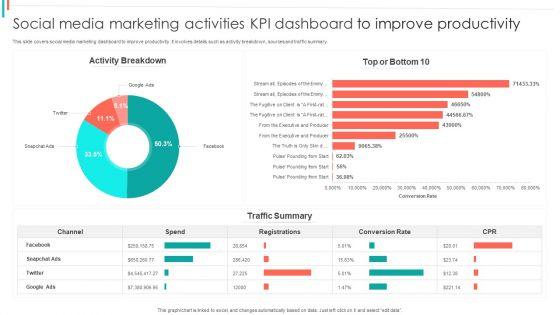
This slide covers social media marketing dashboard to improve productivity. It involves details such as activity breakdown, sources and traffic summary.Pitch your topic with ease and precision using this Social Media Marketing Activities KPI Dashboard To Improve Productivity Summary PDF. This layout presents information on Activity Breakdown, Conversion Rate, Traffic Summary. It is also available for immediate download and adjustment. So, changes can be made in the color, design, graphics or any other component to create a unique layout.
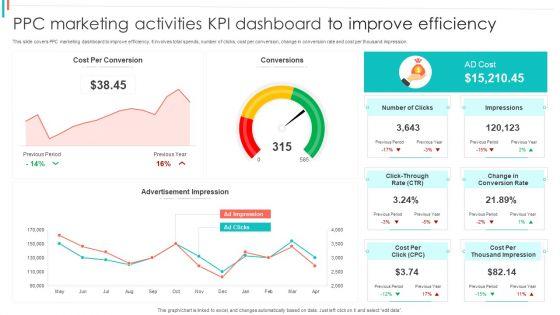
This slide covers PPC marketing dashboard to improve efficiency. It involves total spends, number of clicks, cost per conversion, change in conversion rate and cost per thousand impression.Showcasing this set of slides titled PPC Marketing Activities KPI Dashboard To Improve Efficiency Diagrams PDF. The topics addressed in these templates are Per Conversion, Advertisement Impression, Impressions. All the content presented in this PPT design is completely editable. Download it and make adjustments in color, background, font etc. as per your unique business setting.
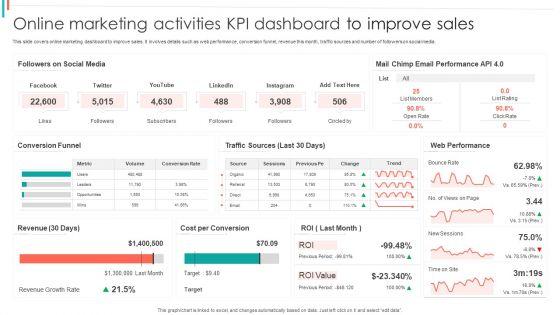

This slide covers online marketing dashboard to improve sales. It involves details such as web performance, conversion funnel, revenue this month, traffic sources and number of followers on social media.Pitch your topic with ease and precision using this Online Marketing Activities KPI Dashboard To Improve Sales Ideas PDF. This layout presents information on Email Performance, Web Performance, Cost Conversion. It is also available for immediate download and adjustment. So, changes can be made in the color, design, graphics or any other component to create a unique layout.
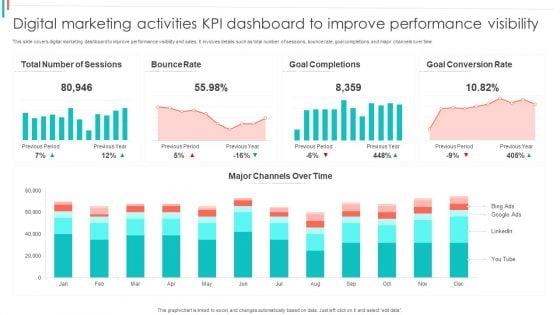

This slide covers digital marketing dashboard to improve performance visibility and sales. It involves details such as total number of sessions, bounce rate, goal completions and major channels over time.Showcasing this set of slides titled Digital Marketing Activities KPI Dashboard To Improve Performance Visibility Summary PDF. The topics addressed in these templates are Bounce Rate, Goal Completions, Goal Conversion. All the content presented in this PPT design is completely editable. Download it and make adjustments in color, background, font etc. as per your unique business setting.
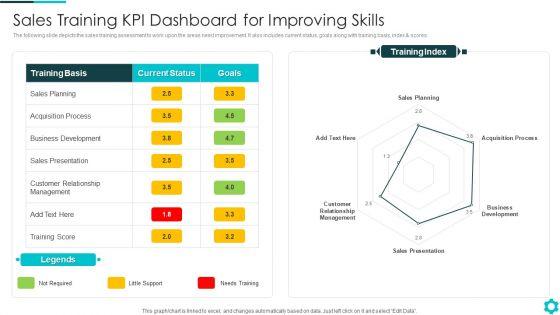
The following slide depicts the sales training assessment to work upon the areas need improvement. It also includes current status, goals along with training basis, index and scores.Showcasing this set of slides titled Sales Training KPI Dashboard For Improving Skills Portrait PDF The topics addressed in these templates are Acquisition Process, Sales Presentation, Customer Relationship Management All the content presented in this PPT design is completely editable. Download it and make adjustments in color, background, font etc. as per your unique business setting.


The below slide illustrates the key performing areas of HR personal development. It consists of training track record, mode of training, no. of trainees, annual training budget etc. Showcasing this set of slides titled Human Resource Personal Improvement Plan Kpi Dashboard Topics PDF. The topics addressed in these templates are Sales, Marketing, Accounting. All the content presented in this PPT design is completely editable. Download it and make adjustments in color, background, font etc. as per your unique business setting.
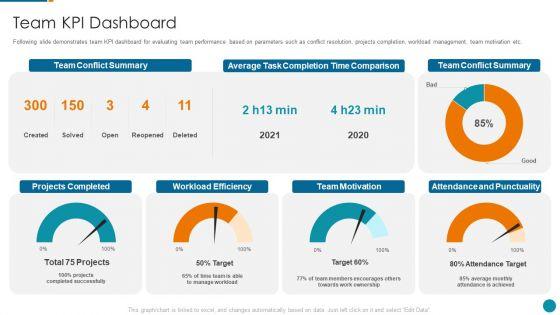
Following slide demonstrates team KPI dashboard for evaluating team performance based on parameters such as conflict resolution, projects completion, workload management, team motivation etc. Deliver and pitch your topic in the best possible manner with this strategic procedure to improve employee efficiency team kpi dashboard topics pdf Use them to share invaluable insights on team conflict summary, workload efficiency, team motivation and impress your audience. This template can be altered and modified as per your expectations. So, grab it now.

Following slide demonstrates team KPI dashboard for evaluating team performance based on parameters such as conflict resolution, projects completion, workload management, team motivation etc. Deliver and pitch your topic in the best possible manner with this organizational program to improve team productivity and efficiency team kpi dashboard clipart pdf Use them to share invaluable insights on projects completed, workload efficiency, attendance and punctualityand impress your audience. This template can be altered and modified as per your expectations. So, grab it now.


Following slide demonstrates team KPI dashboard for evaluating team performance based on parameters such as conflict resolution, projects completion, workload management, team motivation etc. Deliver and pitch your topic in the best possible manner with this strategy to improve team proficiency team kpi dashboard sample pdf. Use them to share invaluable insights on motivation, team, projects, efficiency and impress your audience. This template can be altered and modified as per your expectations. So, grab it now.
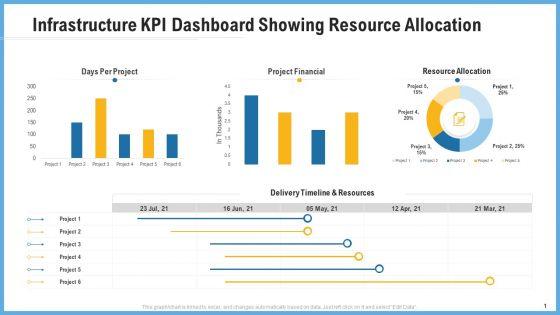
Deliver and pitch your topic in the best possible manner with this improving operational activities enterprise infrastructure kpi dashboard showing resource allocation ideas pdf. Use them to share invaluable insights on days per project, project financial, resource allocation and impress your audience. This template can be altered and modified as per your expectations. So, grab it now.
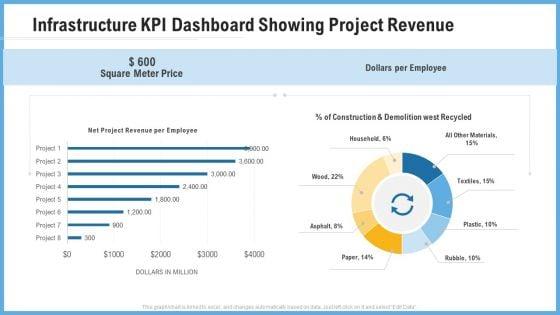
Deliver an awe inspiring pitch with this creative improving operational activities enterprise infrastructure kpi dashboard showing project revenue professional pdf bundle. Topics like square meter price, dollars per employee can be discussed with this completely editable template. It is available for immediate download depending on the needs and requirements of the user.
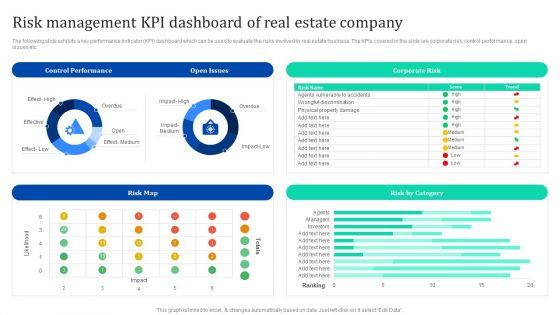


The following slide exhibits a key performance indicator KPI dashboard which can be used to evaluate the risks involved in real estate business. The KPIs covered in the slide are corporate risk, control performance, open issues etc. This Risk Management Kpi Dashboard Of Real Estate Company Enhancing Process Improvement By Regularly Inspiration PDF from Slidegeeks makes it easy to present information on your topic with precision. It provides customization options, so you can make changes to the colors, design, graphics, or any other component to create a unique layout. It is also available for immediate download, so you can begin using it right away. Slidegeeks has done good research to ensure that you have everything you need to make your presentation stand out. Make a name out there for a brilliant performance.

The following slide showcases monthly and half-yearly order summary. It includes elements such as revenue days, refund, transaction status, paid, unpaid, subscriptions, current and previous details, etc. Do you know about Slidesgeeks Sales Order Summary KPI Dashboard How To Improve Company PPT Sample Strategy SS V These are perfect for delivering any kind od presentation. Using it, create PowerPoint presentations that communicate your ideas and engage audiences. Save time and effort by using our pre-designed presentation templates that are perfect for a wide range of topic. Our vast selection of designs covers a range of styles, from creative to business, and are all highly customizable and easy to edit. Download as a PowerPoint template or use them as Google Slides themes. The following slide showcases monthly and half-yearly order summary. It includes elements such as revenue days, refund, transaction status, paid, unpaid, subscriptions, current and previous details, etc.

This slide shows key performance indicators dashboard which can be used by content marketing managers to measure content performance. It includes metrics such as page views, social shares, content first touch, pipeline generated, etc. Welcome to our selection of the SEO Strategy To Improve ROI KPI Dashboard To Evaluate Content Strategy SS V. These are designed to help you showcase your creativity and bring your sphere to life. Planning and Innovation are essential for any business that is just starting out. This collection contains the designs that you need for your everyday presentations. All of our PowerPoints are 100Percent editable, so you can customize them to suit your needs. This multi-purpose template can be used in various situations. Grab these presentation templates today. This slide shows key performance indicators dashboard which can be used by content marketing managers to measure content performance. It includes metrics such as page views, social shares, content first touch, pipeline generated, etc.
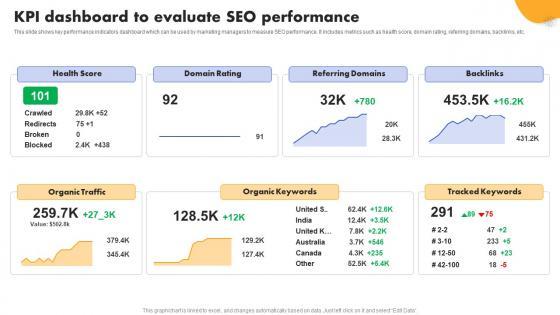

This slide shows key performance indicators dashboard which can be used by marketing managers to measure SEO performance. It includes metrics such as health score, domain rating, referring domains, backlinks, etc. Want to ace your presentation in front of a live audience Our SEO Strategy To Improve KPI Dashboard To Evaluate SEO Performance Strategy SS V can help you do that by engaging all the users towards you. Slidegeeks experts have put their efforts and expertise into creating these impeccable powerpoint presentations so that you can communicate your ideas clearly. Moreover, all the templates are customizable, and easy-to-edit and downloadable. Use these for both personal and commercial use. This slide shows key performance indicators dashboard which can be used by marketing managers to measure SEO performance. It includes metrics such as health score, domain rating, referring domains, backlinks, etc.
This slide shows dashboard which can be used by individuals to track monthly expenses in order to get better understanding of his or her finances. It includes metrics such as users spending, savings, debt, etc. Slidegeeks is one of the best resources for PowerPoint templates. You can download easily and regulate Wireless Banking To Improve KPI Dashboard For Tracking Monthly Personal Fin SS V for your personal presentations from our wonderful collection. A few clicks is all it takes to discover and get the most relevant and appropriate templates. Use our Templates to add a unique zing and appeal to your presentation and meetings. All the slides are easy to edit and you can use them even for advertisement purposes. This slide shows dashboard which can be used by individuals to track monthly expenses in order to get better understanding of his or her finances. It includes metrics such as users spending, savings, debt, etc.


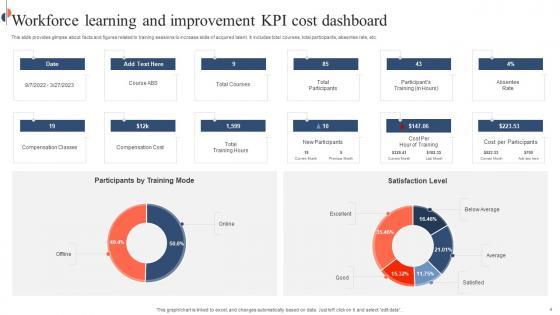
This slide provides glimpse about facts and figures related to training sessions to increase skills of acquired talent. It includes total courses, total participants, absentee rate, etc. Pitch your topic with ease and precision using this Workforce Learning And Improvement KPI Cost Dashboard Rules Pdf. This layout presents information on Workforce Learning, Improvement KPI, Cost Dashboard. It is also available for immediate download and adjustment. So, changes can be made in the color, design, graphics or any other component to create a unique layout. This slide provides glimpse about facts and figures related to training sessions to increase skills of acquired talent. It includes total courses, total participants, absentee rate, etc.
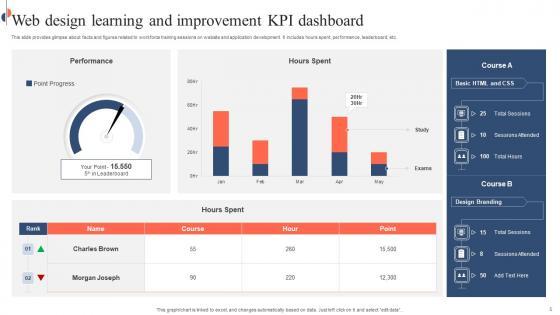
This slide provides glimpse about facts and figures related to workforce training sessions on website and application development. It includes hours spent, performance, leaderboard, etc. Showcasing this set of slides titled Web Design Learning And Improvement KPI Dashboard Icons Pdf. The topics addressed in these templates are Web Design Learning, Improvement KPI Dashboard, Performance, Leaderboard. All the content presented in this PPT design is completely editable. Download it and make adjustments in color, background, font etc. as per your unique business setting. This slide provides glimpse about facts and figures related to workforce training sessions on website and application development. It includes hours spent, performance, leaderboard, etc.
Pitch your topic with ease and precision using this Online Learning And Improvement KPI Training Sessions Dashboard Icon Graphics Pdf. This layout presents information on Online Learning, Improvement KPI, Training Sessions, Dashboard Icon. It is also available for immediate download and adjustment. So, changes can be made in the color, design, graphics or any other component to create a unique layout. Our Online Learning And Improvement KPI Training Sessions Dashboard Icon Graphics Pdf are topically designed to provide an attractive backdrop to any subject. Use them to look like a presentation pro.


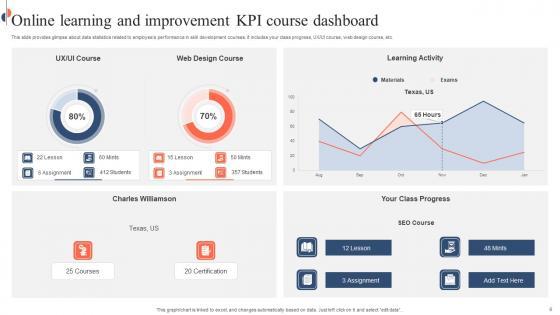
This slide provides glimpse about data statistics related to employee performance in skill development courses. It includes your class progress, UX or UI course, web design course, etc. Showcasing this set of slides titled Online Learning And Improvement KPI Course Dashboard Mockup Pdf. The topics addressed in these templates are Online Learning, KPI Course Dashboard, Skill Development Courses. All the content presented in this PPT design is completely editable. Download it and make adjustments in color, background, font etc. as per your unique business setting. This slide provides glimpse about data statistics related to employee performance in skill development courses. It includes your class progress, UX or UI course, web design course, etc.
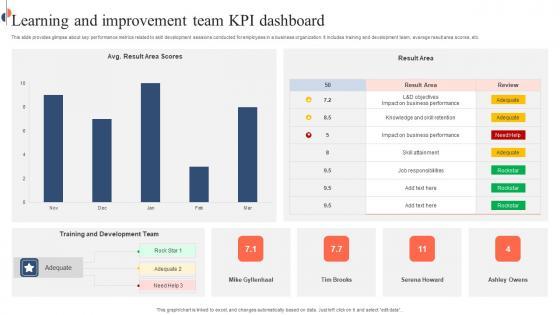
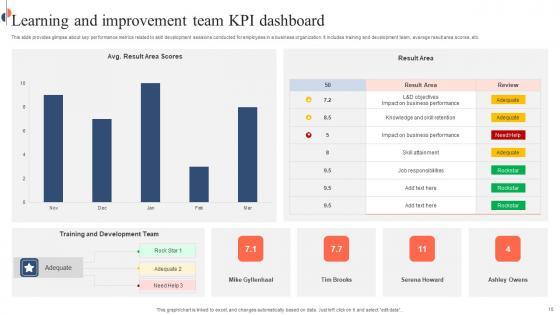
This slide provides glimpse about key performance metrics related to skill development sessions conducted for employees in a business organization. It includes training and development team, average result area scores, etc. Pitch your topic with ease and precision using this Learning And Improvement Team KPI Dashboard Slides Pdf. This layout presents information on Learning And Improvement Team, KPI Dashboard, Development Team. It is also available for immediate download and adjustment. So, changes can be made in the color, design, graphics or any other component to create a unique layout. This slide provides glimpse about key performance metrics related to skill development sessions conducted for employees in a business organization. It includes training and development team, average result area scores, etc.


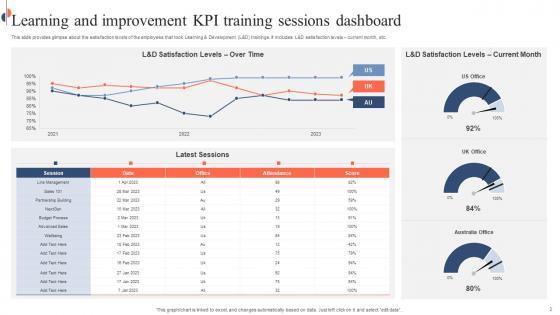
This slide provides glimpse about the satisfaction levels of the employees that took Learning and Development L and D trainings. It includes L and D satisfaction levels current month, etc. Showcasing this set of slides titled Learning And Improvement KPI Training Sessions Dashboard Mockup Pdf. The topics addressed in these templates are Learning And Improvement KPI, Training Sessions Dashboard, Learning And Development. All the content presented in this PPT design is completely editable. Download it and make adjustments in color, background, font etc. as per your unique business setting. This slide provides glimpse about the satisfaction levels of the employees that took Learning and Development L and D trainings. It includes L and D satisfaction levels current month, etc.
Pitch your topic with ease and precision using this Learning And Improvement KPI Training Dashboard Icon Graphics Pdf. This layout presents information on Learning And Improvement KPI, Training Dashboard Icon. It is also available for immediate download and adjustment. So, changes can be made in the color, design, graphics or any other component to create a unique layout. Our Learning And Improvement KPI Training Dashboard Icon Graphics Pdf are topically designed to provide an attractive backdrop to any subject. Use them to look like a presentation pro.
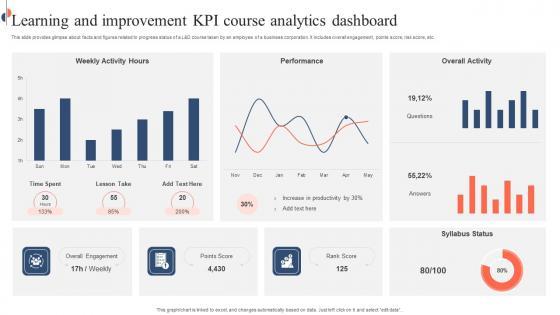

This slide provides glimpse about facts and figures related to progress status of a L and D course taken by an employee of a business corporation. It includes overall engagement, points score, risk score, etc. Showcasing this set of slides titled Learning And Improvement KPI Course Analytics Dashboard Inspiration Pdf. The topics addressed in these templates are Learning And Improvement KPI, Course Analytics Dashboard, Risk Score. All the content presented in this PPT design is completely editable. Download it and make adjustments in color, background, font etc. as per your unique business setting. This slide provides glimpse about facts and figures related to progress status of a L and D course taken by an employee of a business corporation. It includes overall engagement, points score, risk score, etc.


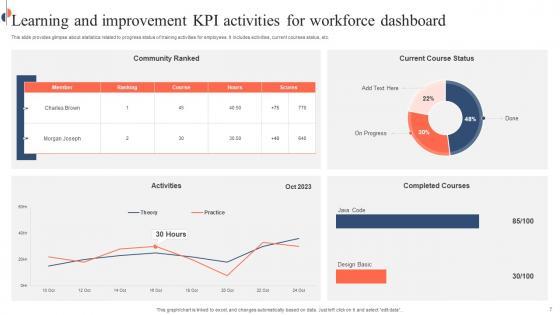
This slide provides glimpse about statistics related to progress status of training activities for employees. It includes activities, current courses status, etc. Pitch your topic with ease and precision using this Learning And Improvement KPI Activities For Workforce Dashboard Formats Pdf. This layout presents information on Learning And Improvement KPI, Workforce Dashboard, Current Courses Status. It is also available for immediate download and adjustment. So, changes can be made in the color, design, graphics or any other component to create a unique layout. This slide provides glimpse about statistics related to progress status of training activities for employees. It includes activities, current courses status, etc.
Showcasing this set of slides titled Employees Learning And Improvement KPI Courses Dashboard Icon Introduction Pdf. The topics addressed in these templates are Employees Learning, Improvement KPI, Courses Dashboard Icon. All the content presented in this PPT design is completely editable. Download it and make adjustments in color, background, font etc. as per your unique business setting. Our Employees Learning And Improvement KPI Courses Dashboard Icon Introduction Pdf are topically designed to provide an attractive backdrop to any subject. Use them to look like a presentation pro.


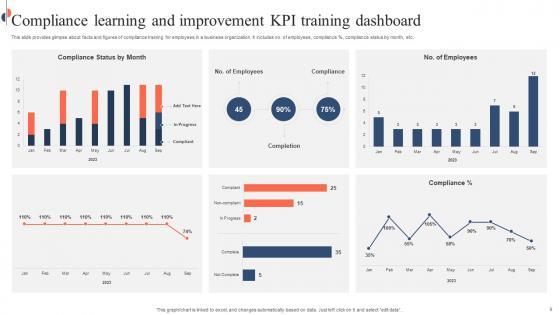
This slide provides glimpse about facts and figures of compliance training for employees in a business organization. It includes no. of employees, compliance percent, compliance status by month, etc. Pitch your topic with ease and precision using this Compliance Learning And Improvement KPI Training Dashboard Sample Pdf. This layout presents information on Compliance Learning, Improvement KPI, Training Dashboard, Compliance Training. It is also available for immediate download and adjustment. So, changes can be made in the color, design, graphics or any other component to create a unique layout. This slide provides glimpse about facts and figures of compliance training for employees in a business organization. It includes no. of employees, compliance percent, compliance status by month, etc.


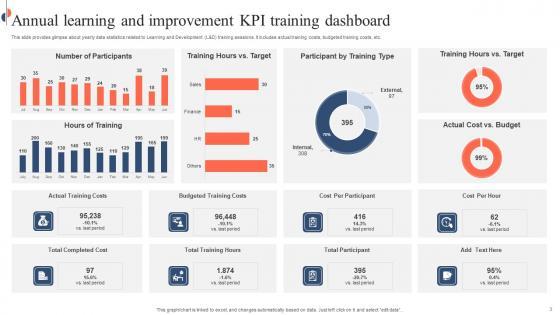
This slide provides glimpse about yearly data statistics related to Learning and Development L and D training sessions. It includes actual training costs, budgeted training costs, etc. Showcasing this set of slides titled Annual Learning And Improvement KPI Training Dashboard Formats Pdf. The topics addressed in these templates are Annual Learning, Improvement KPI, Training Dashboard, Budgeted Training Costs. All the content presented in this PPT design is completely editable. Download it and make adjustments in color, background, font etc. as per your unique business setting. This slide provides glimpse about yearly data statistics related to Learning and Development L and D training sessions. It includes actual training costs, budgeted training costs, etc.


This Learning And Improvement KPI Dashboard Ppt Powerpoint Presentation Complete Deck With Slides acts as backup support for your ideas, vision, thoughts, etc. Use it to present a thorough understanding of the topic. This PPT slideshow can be utilized for both in-house and outside presentations depending upon your needs and business demands. Entailing fourteen slides with a consistent design and theme, this template will make a solid use case. As it is intuitively designed, it suits every business vertical and industry. All you have to do is make a few tweaks in the content or any other component to design unique presentations. The biggest advantage of this complete deck is that it can be personalized multiple times once downloaded. The color, design, shapes, and other elements are free to modify to add personal touches. You can also insert your logo design in this PPT layout. Therefore a well-thought and crafted presentation can be delivered with ease and precision by downloading this Learning And Improvement KPI Dashboard Ppt Powerpoint Presentation Complete Deck With Slides PPT slideshow. Our Learning And Improvement KPI Dashboard Ppt Powerpoint Presentation Complete Deck With Slides are topically designed to provide an attractive backdrop to any subject. Use them to look like a presentation pro.
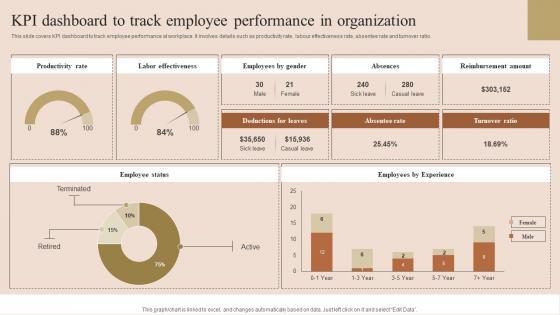

This slide covers KPI dashboard to track employee performance at workplace. It involves details such as productivity rate, labour effectiveness rate, absentee rate and turnover ratio. Explore a selection of the finest KPI Dashboard To Track Employee Performance Improvement Techniques Rules Pdf here. With a plethora of professionally designed and pre made slide templates, you can quickly and easily find the right one for your upcoming presentation. You can use our KPI Dashboard To Track Employee Performance Improvement Techniques Rules Pdf to effectively convey your message to a wider audience. Slidegeeks has done a lot of research before preparing these presentation templates. The content can be personalized and the slides are highly editable. Grab templates today from Slidegeeks. This slide covers KPI dashboard to track employee performance at workplace. It involves details such as productivity rate, labour effectiveness rate, absentee rate and turnover ratio.
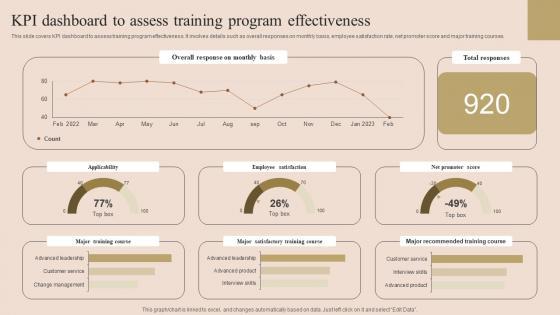

This slide covers KPI dashboard to assess training program effectiveness. It involves details such as overall responses on monthly basis, employee satisfaction rate, net promoter score and major training courses. Welcome to our selection of the KPI Dashboard To Assess Employee Performance Improvement Techniques Ideas Pdf. These are designed to help you showcase your creativity and bring your sphere to life. Planning and Innovation are essential for any business that is just starting out. This collection contains the designs that you need for your everyday presentations. All of our PowerPoints are 100 percent editable, so you can customize them to suit your needs. This multi purpose template can be used in various situations. Grab these presentation templates today This slide covers KPI dashboard to assess training program effectiveness. It involves details such as overall responses on monthly basis, employee satisfaction rate, net promoter score and major training courses.
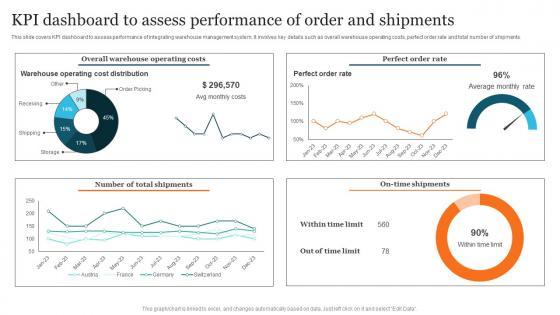

This slide covers KPI dashboard to assess performance of integrating warehouse management system. It involves key details such as overall warehouse operating costs, perfect order rate and total number of shipments. If you are looking for a format to display your unique thoughts, then the professionally designed KPI Dashboard Assess Performance Advanced Supply Chain Improvement Strategies Brochure Pdf is the one for you. You can use it as a Google Slides template or a PowerPoint template. Incorporate impressive visuals, symbols, images, and other charts. Modify or reorganize the text boxes as you desire. Experiment with shade schemes and font pairings. Alter, share or cooperate with other people on your work. Download KPI Dashboard Assess Performance Advanced Supply Chain Improvement Strategies Brochure Pdf and find out how to give a successful presentation. Present a perfect display to your team and make your presentation unforgettable. This slide covers KPI dashboard to assess performance of integrating warehouse management system. It involves key details such as overall warehouse operating costs, perfect order rate and total number of shipments.
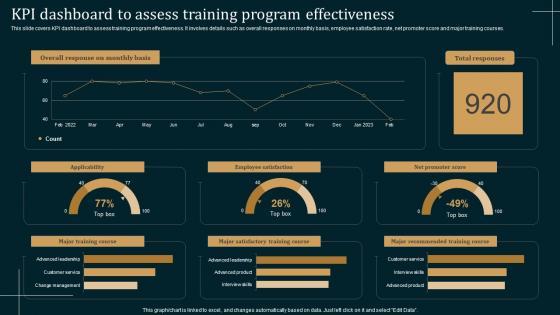
This slide covers KPI dashboard to assess training program effectiveness. It involves details such as overall responses on monthly basis, employee satisfaction rate, net promoter score and major training courses. Explore a selection of the finest KPI Dashboard To Assess Training Employee Performance Improvement Strategies Structure Pdf here. With a plethora of professionally designed and pre made slide templates, you can quickly and easily find the right one for your upcoming presentation. You can use our KPI Dashboard To Assess Training Employee Performance Improvement Strategies Structure Pdf to effectively convey your message to a wider audience. Slidegeeks has done a lot of research before preparing these presentation templates. The content can be personalized and the slides are highly editable. Grab templates today from Slidegeeks. This slide covers KPI dashboard to assess training program effectiveness. It involves details such as overall responses on monthly basis, employee satisfaction rate, net promoter score and major training courses.
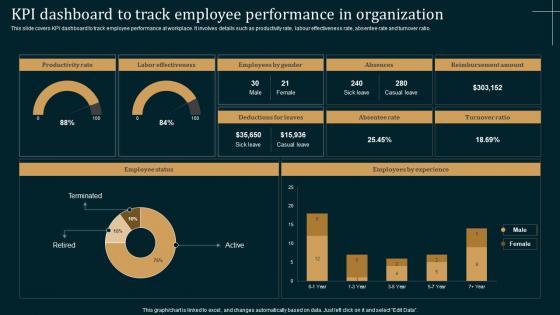

This slide covers KPI dashboard to track employee performance at workplace. It involves details such as productivity rate, labour effectiveness rate, absentee rate and turnover ratio. Slidegeeks is here to make your presentations a breeze with Employee Performance Improvement Strategies KPI Dashboard Track Employee Guidelines Pdf With our easy to use and customizable templates, you can focus on delivering your ideas rather than worrying about formatting. With a variety of designs to choose from, you are sure to find one that suits your needs. And with animations and unique photos, illustrations, and fonts, you can make your presentation pop. So whether you are giving a sales pitch or presenting to the board, make sure to check out Slidegeeks first This slide covers KPI dashboard to track employee performance at workplace. It involves details such as productivity rate, labour effectiveness rate, absentee rate and turnover ratio.
This slide showcases the KPIs that would help our business organization to evaluate improvements with the new financial strategy implementation. It includes total income, total expenses, accounts receivable, etc. Retrieve professionally designed Strategic Financial Planning And Administration KPI Dashboard Analyze Financial Improvements Icons PDF to effectively convey your message and captivate your listeners. Save time by selecting pre-made slideshows that are appropriate for various topics, from business to educational purposes. These themes come in many different styles, from creative to corporate, and all of them are easily adjustable and can be edited quickly. Access them as PowerPoint templates or as Google Slides themes. You do not have to go on a hunt for the perfect presentation because Slidegeeks got you covered from everywhere. This slide showcases the KPIs that would help our business organization to evaluate improvements with the new financial strategy implementation. It includes total income, total expenses, accounts receivable, etc.
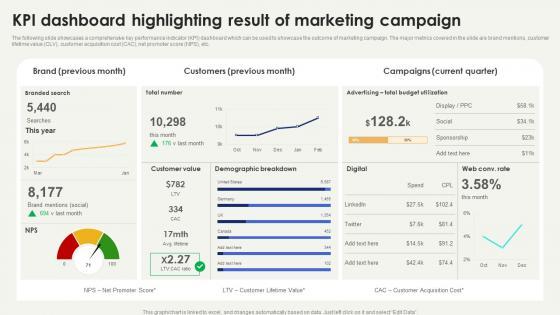
The following slide showcases a comprehensive key performance indicator KPI dashboard which can be used to showcase the outcome of marketing campaign. The major metrics covered in the slide are brand mentions, customer lifetime value CLV, customer acquisition cost CAC, net promoter score NPS, etc. Boost your pitch with our creative KPI Dashboard Highlighting Digital Marketing Strategies Improve Enterprise Sales Pictures Pdf. Deliver an awe inspiring pitch that will mesmerize everyone. Using these presentation templates you will surely catch everyones attention. You can browse the ppts collection on our website. We have researchers who are experts at creating the right content for the templates. So you do not have to invest time in any additional work. Just grab the template now and use them. The following slide showcases a comprehensive key performance indicator KPI dashboard which can be used to showcase the outcome of marketing campaign. The major metrics covered in the slide are brand mentions, customer lifetime value CLV, customer acquisition cost CAC, net promoter score NPS, etc.
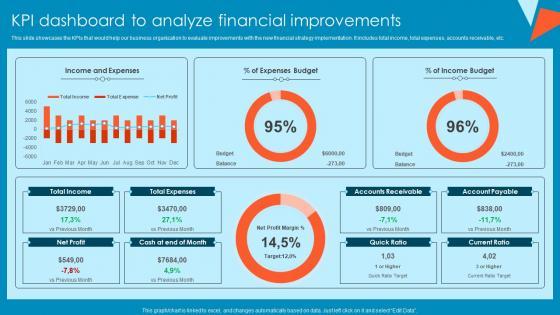

This slide showcases the KPIs that would help our business organization to evaluate improvements with the new financial strategy implementation. It includes total income, total expenses, accounts receivable, etc.Boost your pitch with our creative KPI Dashboard To Analyze Financial Improvements Tactical Financial Governance Brochure Pdf. Deliver an awe-inspiring pitch that will mesmerize everyone. Using these presentation templates you will surely catch everyones attention. You can browse the ppts collection on our website. We have researchers who are experts at creating the right content for the templates. So you do not have to invest time in any additional work. Just grab the template now and use them. This slide showcases the KPIs that would help our business organization to evaluate improvements with the new financial strategy implementation. It includes total income, total expenses, accounts receivable, etc.


This slide showcases dashboard that can help organization to measure the KPIs after implementing personalized marketing campaigns. Its key elements are lead breakdown, web user to lead, lead to trial, leads by region and google analtics web traffic If you are looking for a format to display your unique thoughts, then the professionally designed Targeted Marketing Campaigns To Improve Buyers Experience Dashboard For Personalized Digital Marketing Kpis Diagrams PDF is the one for you. You can use it as a Google Slides template or a PowerPoint template. Incorporate impressive visuals, symbols, images, and other charts. Modify or reorganize the text boxes as you desire. Experiment with shade schemes and font pairings. Alter, share or cooperate with other people on your work. Download Targeted Marketing Campaigns To Improve Buyers Experience Dashboard For Personalized Digital Marketing Kpis Diagrams PDF and find out how to give a successful presentation. Present a perfect display to your team and make your presentation unforgettable.
60 Item(s)