- Sign up
- Sign In
 AI PPT Maker
 Templates
 PPT Bundles
 Design Services
 Business PPTs
 Business Plan
 Management
 Strategy
 Introduction PPT
 Roadmap
 Self Introduction
 Timelines
 Process
 Marketing
 Agenda
 Technology
 Medical
 Startup Business Plan
 Cyber Security
 Dashboards
 SWOT
SWOT Proposals
 Education
 Pitch Deck
 Digital Marketing
 KPIs
KPIs Project Management
 Product Management
 Artificial Intelligence
 Target Market
 Communication
 Supply Chain
 Google Slides
 Research Services
 One Pagers
 All Categories
Forecasted data PowerPoint Presentation Templates and Google Slides
41 Item(s)


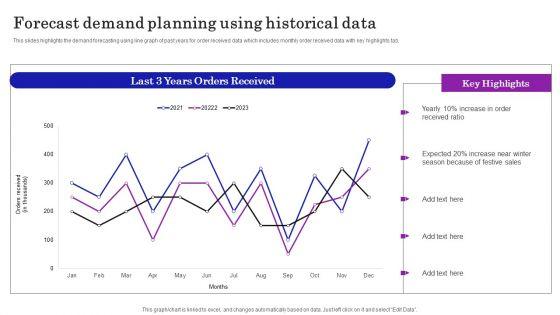
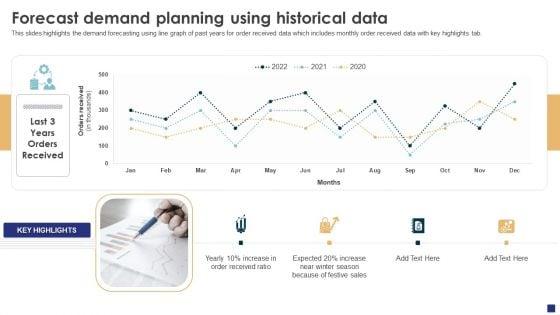
This slides highlights the demand forecasting using line graph of past years for order received data which includes monthly order received data with key highlights tab. Crafting an eye catching presentation has never been more straightforward. Let your presentation shine with this tasteful yet straightforward Forecast Demand Planning Using Historical Data Ppt PowerPoint Presentation Diagram Graph Charts PDF template. It offers a minimalistic and classy look that is great for making a statement. The colors have been employed intelligently to add a bit of playfulness while still remaining professional. Construct the ideal Forecast Demand Planning Using Historical Data Ppt PowerPoint Presentation Diagram Graph Charts PDF that effortlessly grabs the attention of your audience. Begin now and be certain to wow your customers.
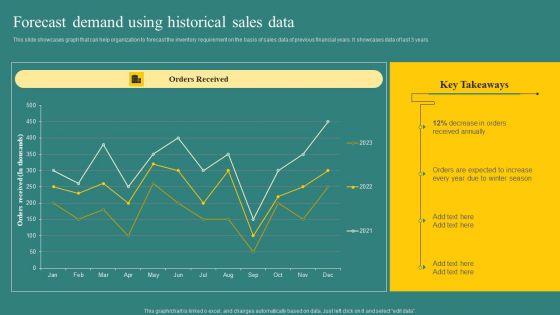

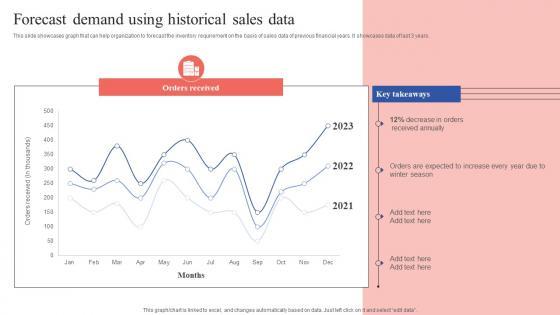
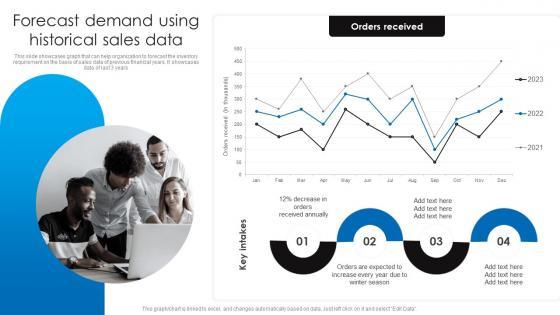
This slide showcases graph that can help organization to forecast the inventory requirement on the basis of sales data of previous financial years. It showcases data of last 3 years. Take your projects to the next level with our ultimate collection of Forecast Demand Using Historical Sales Data Background PDF. Slidegeeks has designed a range of layouts that are perfect for representing task or activity duration, keeping track of all your deadlines at a glance. Tailor these designs to your exact needs and give them a truly corporate look with your own brand colors they will make your projects stand out from the rest.
This slide represents the statistical data representing the forecasted Facebook advertising revenue for 2026. It includes details related to increase in Facebook advertising revenue by 70 percent within upcoming 4 years. Formulating a presentation can take up a lot of effort and time, so the content and message should always be the primary focus. The visuals of the PowerPoint can enhance the presenters message, so our Facebook Advertising Revenue Forecast Statistical Data Ppt PowerPoint Presentation File Icon PDF was created to help save time. Instead of worrying about the design, the presenter can concentrate on the message while our designers work on creating the ideal templates for whatever situation is needed. Slidegeeks has experts for everything from amazing designs to valuable content, we have put everything into Facebook Advertising Revenue Forecast Statistical Data Ppt PowerPoint Presentation File Icon PDF
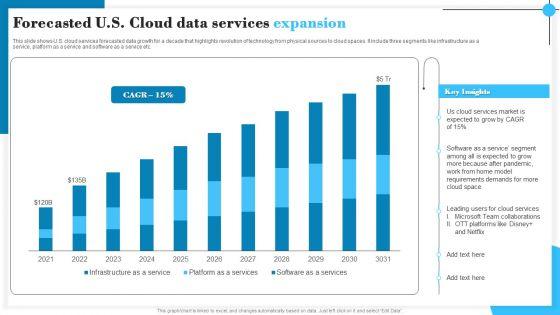
This slide shows U.S. cloud services forecasted data growth for a decade that highlights revolution of technology from physical sources to cloud spaces. It include three segments like infrastructure as a service, platform as a service and software as a service etc. Presenting Forecasted U S Cloud Data Services Expansion Demonstration PDF to dispense important information. This template comprises six stages. It also presents valuable insights into the topics including Cloud Services, Software, Team Collaborations. This is a completely customizable PowerPoint theme that can be put to use immediately. So, download it and address the topic impactfully.
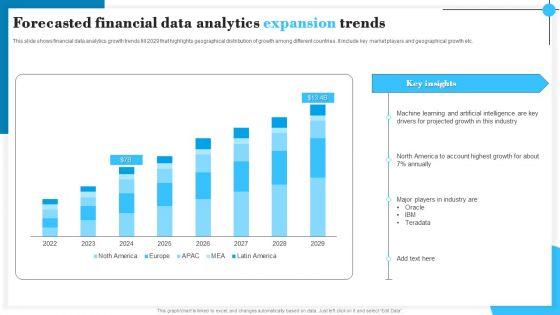

This slide shows financial data analytics growth trends till 2029 that highlights geographical distribution of growth among different countries. It include key market players and geographical growth etc. Showcasing this set of slides titled Forecasted Financial Data Analytics Expansion Trends Slides PDF. The topics addressed in these templates are Machine Learning, Projected Growth, Industry. All the content presented in this PPT design is completely editable. Download it and make adjustments in color, background, font etc. as per your unique business setting.
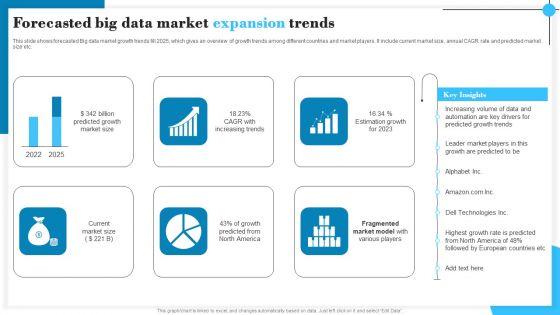

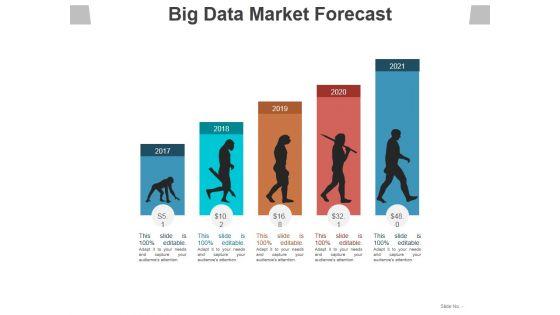
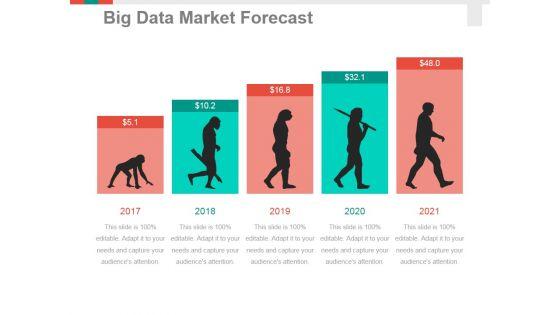
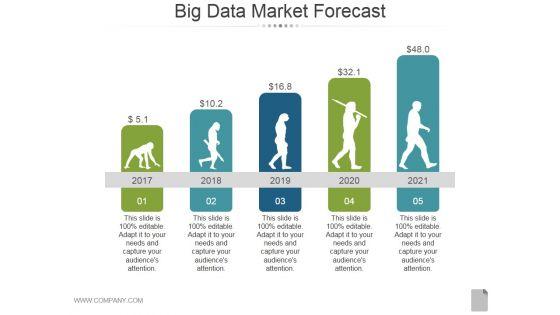
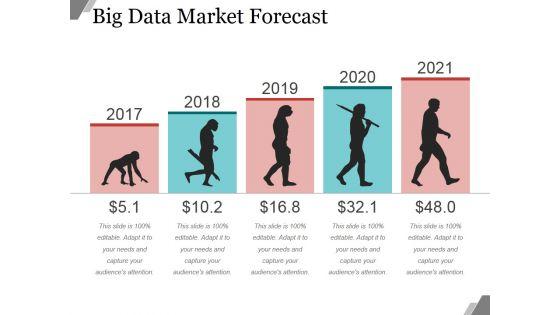
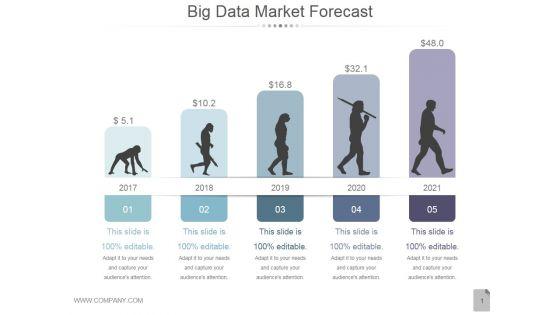
This slide shows forecasted Big data market growth trends till 2025, which gives an overview of growth trends among different countries and market players. It include current market size, annual CAGR rate and predicted market size etc. Pitch your topic with ease and precision using this Forecasted Big Data Market Expansion Trends Download PDF. This layout presents information on Billion Predicted Growth, Increasing Trends, Estimation Growth. It is also available for immediate download and adjustment. So, changes can be made in the color, design, graphics or any other component to create a unique layout.
This slides highlights the demand forecasting using line graph of past years for order received data which includes monthly order received data with key highlights tab. Slidegeeks is here to make your presentations a breeze with Supply Chain Planning To Enhance Logistics Process Forecast Demand Planning Using Historical Data Ideas PDF With our easy to use and customizable templates, you can focus on delivering your ideas rather than worrying about formatting. With a variety of designs to choose from, you are sure to find one that suits your needs. And with animations and unique photos, illustrations, and fonts, you can make your presentation pop. So whether you are giving a sales pitch or presenting to the board, make sure to check out Slidegeeks first.


This slide showcases graph that can help organization to forecast the inventory requirement on the basis of sales data of previous financial years. It showcases data of last 3 years. This Stock Inventory Acquisition Forecast Demand Using Historical Sales Data Themes PDF from Slidegeeks makes it easy to present information on your topic with precision. It provides customization options, so you can make changes to the colors, design, graphics, or any other component to create a unique layout. It is also available for immediate download, so you can begin using it right away. Slidegeeks has done good research to ensure that you have everything you need to make your presentation stand out. Make a name out there for a brilliant performance.

This slides highlights the demand forecasting using line graph of past years for order received data which includes monthly order received data with key highlights tab. Make sure to capture your audiences attention in your business displays with our gratis customizable Comprehensive Guide To Ecommerce Forecast Demand Planning Using Historical Data Designs PDF. These are great for business strategies, office conferences, capital raising or task suggestions. If you desire to acquire more customers for your tech business and ensure they stay satisfied, create your own sales presentation with these plain slides.
Presenting statistical data graph icon showing financial forecast rules pdf to dispense important information. This template comprises four stages. It also presents valuable insights into the topics including statistical data graph icon showing financial forecast. This is a completely customizable PowerPoint theme that can be put to use immediately. So, download it and address the topic impactfully.
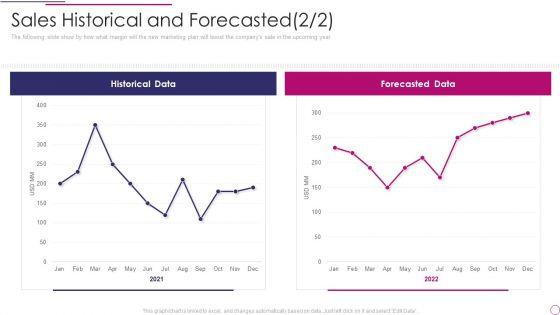

The following slide show by how what margin will the new marketing plan will boost the companys sale in the upcoming year. Deliver and pitch your topic in the best possible manner with this performance analysis of new product development sales historical and forecasted data rules pdf. Use them to share invaluable insights on historical data, forecasted data and impress your audience. This template can be altered and modified as per your expectations. So, grab it now.
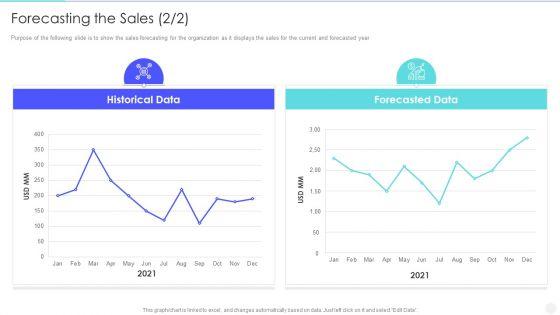

Purpose of the following slide is to show the sales forecasting for the organization as it displays the sales for the current and forecasted year. Deliver and pitch your topic in the best possible manner with this increase returns by examining and executing new sales qualification procedure forecasting the sales data sample pdf. Use them to share invaluable insights on historical data, forecasted data and impress your audience. This template can be altered and modified as per your expectations. So, grab it now.
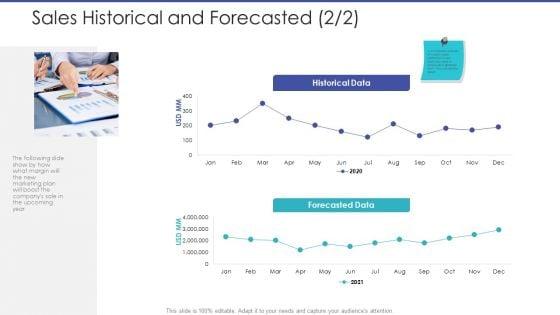
The following slide show by how what margin will the new marketing plan will boost the companys sale in the upcoming year. Deliver and pitch your topic in the best possible manner with this tactical planning for marketing and commercial advancement sales historical and forecasted data template pdf. Use them to share invaluable insights on historical data, forecasted data and impress your audience. This template can be altered and modified as per your expectations. So, grab it now.
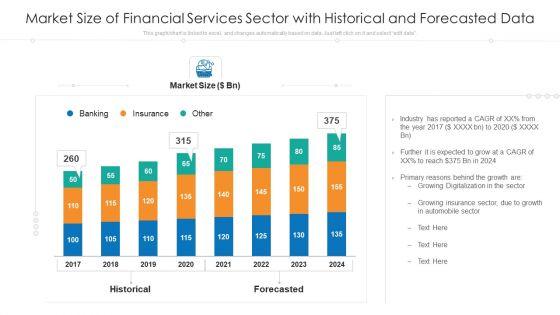
Pitch your topic with ease and precision using this market size of financial services sector with historical and forecasted data ppt portfolio portrait pdf. This layout presents information on market size of financial services sector with historical and forecasted data. It is also available for immediate download and adjustment. So, changes can be made in the color, design, graphics or any other component to create a unique layout.
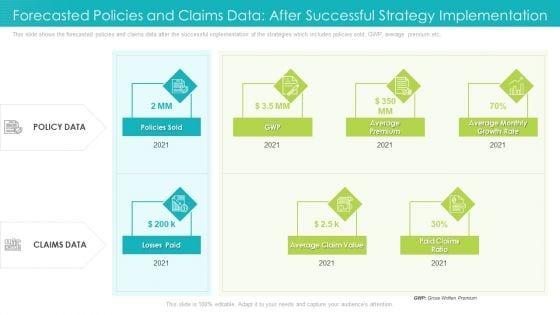

This slide shows the forecasted policies and claims data after the successful implementation of the strategies which includes policies sold, GWP, average premium etc. This is a forecasted policies and claims data after successful strategy implementation ppt model introduction pdf template with various stages. Focus and dispense information on two stages using this creative set, that comes with editable features. It contains large content boxes to add your information on topics like average premium, paid claims ratio, 2021. You can also showcase facts, figures, and other relevant content using this PPT layout. Grab it now.
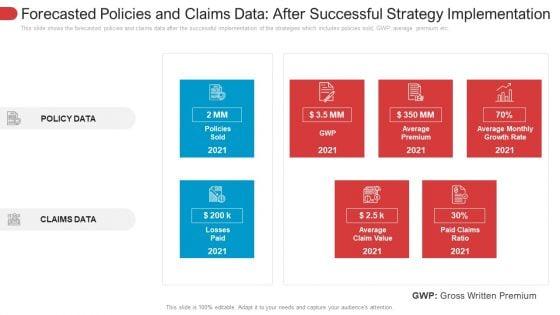

This slide shows the forecasted policies and claims data after the successful implementation of the strategies which includes policies sold, GWP, average premium etc. Deliver an awe-inspiring pitch with this creative forecasted policies and claims data after successful strategy implementation brochure pdf. bundle. Topics like policy data, claims data can be discussed with this completely editable template. It is available for immediate download depending on the needs and requirements of the user.
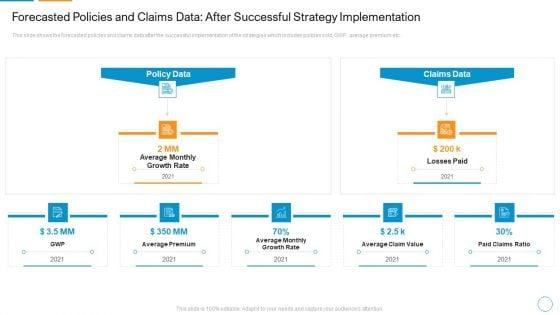

This slide shows the forecasted policies and claims data after the successful implementation of the strategies which includes policies sold, GWP, average premium etc.Presenting forecasted policies and claims data after successful strategy implementation diagrams pdf to provide visual cues and insights. Share and navigate important information on five stages that need your due attention. This template can be used to pitch topics like average premium, average monthly growth rate, average claim value. In addtion, this PPT design contains high resolution images, graphics, etc, that are easily editable and available for immediate download.


The following slide show by how what margin will the new marketing plan will boost the companys sale in the upcoming year. Deliver and pitch your topic in the best possible manner with this organizational development and promotional plan sales historical and forecasted data slides pdf. Use them to share invaluable insights on historical data, forecasted data and impress your audience. This template can be altered and modified as per your expectations. So, grab it now.


The following slide show by how what margin will the new marketing plan will boost the companys sale in the upcoming year. Deliver an awe inspiring pitch with this creative evaluation evolving advanced enterprise development marketing tactics sales historical and forecasted data elements pdf bundle. Topics like sales historical and forecasted can be discussed with this completely editable template. It is available for immediate download depending on the needs and requirements of the user.


The following slide show by how what margin will the new marketing plan will boost the companys sale in the upcoming year. Deliver and pitch your topic in the best possible manner with this strategic plan for business expansion and growth sales historical and forecasted data brochure pdf. Use them to share invaluable insights on historical data, forecasted data and impress your audience. This template can be altered and modified as per your expectations. So, grab it now.


Presenting this set of slides with name customer 360 overview sales historical and forecasted data ppt infographics design templates pdf. The topics discussed in these slides are historical data, forecasted data. This is a completely editable PowerPoint presentation and is available for immediate download. Download now and impress your audience.


Persuade your audience using this Computer Data Application Icon For Demand Forecasting Background PDF. This PPT design covers three stages, thus making it a great tool to use. It also caters to a variety of topics including Computer Data, Application Icon, Demand Forecasting. Download this PPT design now to present a convincing pitch that not only emphasizes the topic but also showcases your presentation skills.
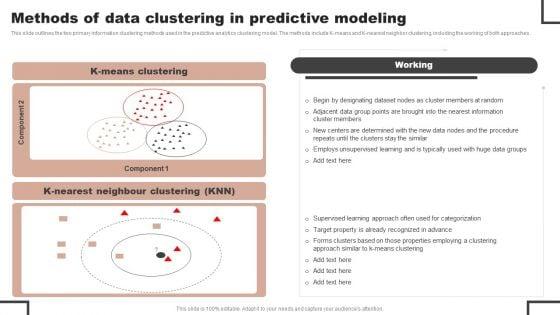
This slide outlines the two primary information clustering methods used in the predictive analytics clustering model. The methods include K means and K nearest neighbor clustering, including the working of both approaches. Create an editable Forecast Analysis Technique IT Methods Of Data Clustering In Predictive Modeling Formats PDF that communicates your idea and engages your audience. Whether you are presenting a business or an educational presentation, pre designed presentation templates help save time. Forecast Analysis Technique IT Methods Of Data Clustering In Predictive Modeling Formats PDF is highly customizable and very easy to edit, covering many different styles from creative to business presentations. Slidegeeks has creative team members who have crafted amazing templates. So, go and get them without any delay.
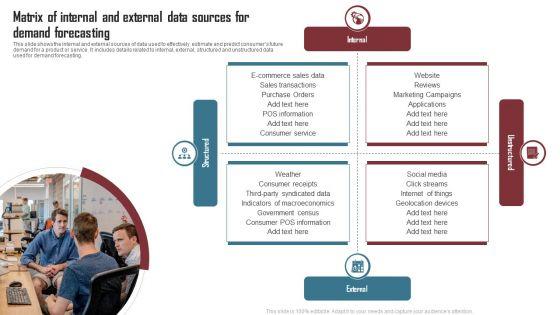
This slide shows the internal and external sources of data used to effectively estimate and predict consumers future demand for a product or service. It includes details related to internal, external, structured and unstructured data used for demand forecasting. Showcasing this set of slides titled Matrix Of Internal And External Data Sources For Demand Forecasting Inspiration PDF. The topics addressed in these templates are Consumer Receipts, Indicators Of Macroeconomics, Government Census. All the content presented in this PPT design is completely editable. Download it and make adjustments in color, background, font etc. as per your unique business setting.
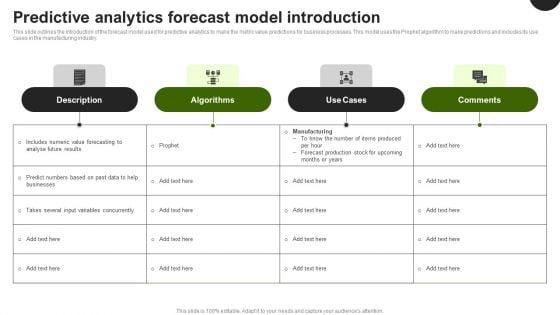
This slide outlines the introduction of the forecast model used for predictive analytics to make the metric value predictions for business processes. This model uses the Prophet algorithm to make predictions and includes its use cases in the manufacturing industry. Formulating a presentation can take up a lot of effort and time, so the content and message should always be the primary focus. The visuals of the PowerPoint can enhance the presenters message, so our Predictive Analytics In The Age Of Big Data Predictive Analytics Forecast Model Introduction Information PDF was created to help save time. Instead of worrying about the design, the presenter can concentrate on the message while our designers work on creating the ideal templates for whatever situation is needed. Slidegeeks has experts for everything from amazing designs to valuable content, we have put everything into Predictive Analytics In The Age Of Big Data Predictive Analytics Forecast Model Introduction Information PDF
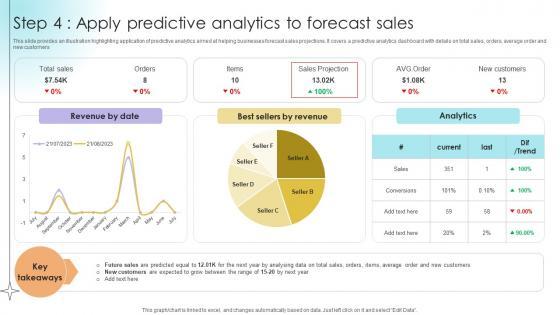
This slide provides an illustration highlighting application of predictive analytics aimed at helping businesses forecast sales projections. It covers a predictive analytics dashboard with details on total sales, orders, average order and new customers.Coming up with a presentation necessitates that the majority of the effort goes into the content and the message you intend to convey. The visuals of a PowerPoint presentation can only be effective if it supplements and supports the story that is being told. Keeping this in mind our experts created Step 4 Apply Predictive Analytics To Forecast Sales Data Analytics SS V to reduce the time that goes into designing the presentation. This way, you can concentrate on the message while our designers take care of providing you with the right template for the situation. This slide provides an illustration highlighting application of predictive analytics aimed at helping businesses forecast sales projections. It covers a predictive analytics dashboard with details on total sales, orders, average order and new customers.
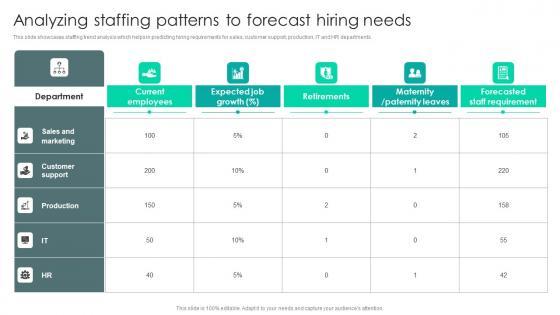
This slide showcases staffing trend analysis which helps in predicting hiring requirements for sales, customer support, production, IT and HR departments. From laying roadmaps to briefing everything in detail, our templates are perfect for you. You can set the stage with your presentation slides. All you have to do is download these easy-to-edit and customizable templates. Strategic Staffing Using Data Analyzing Staffing Patterns To Forecast Hiring Needs CRP DK SS V will help you deliver an outstanding performance that everyone would remember and praise you for. Do download this presentation today. This slide showcases staffing trend analysis which helps in predicting hiring requirements for sales, customer support, production, IT and HR departments.
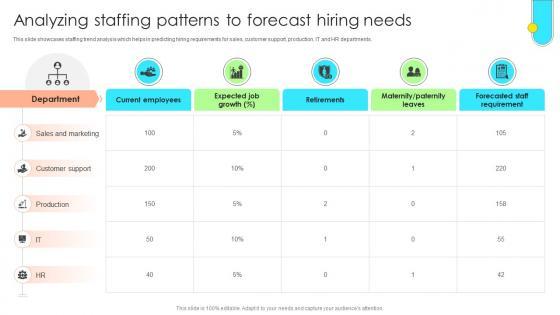
This slide showcases staffing trend analysis which helps in predicting hiring requirements for sales, customer support, production, IT and HR departments. Get a simple yet stunning designed Data Driven Approach To Optimise Analyzing Staffing Patterns To Forecast CRP SS V. It is the best one to establish the tone in your meetings. It is an excellent way to make your presentations highly effective. So, download this PPT today from Slidegeeks and see the positive impacts. Our easy-to-edit Data Driven Approach To Optimise Analyzing Staffing Patterns To Forecast CRP SS V can be your go-to option for all upcoming conferences and meetings. So, what are you waiting for Grab this template today. This slide showcases staffing trend analysis which helps in predicting hiring requirements for sales, customer support, production, IT and HR departments.

This slide graphically provides information about market size of big data. It further includes reasons for revenue growth such as expansion of data traffic, cloud computing traffic, development in technologies, etc Showcasing this set of slides titled Advanced Data Global Market Size Revenue Forecast Microsoft Pdf. The topics addressed in these templates are Expansion Mobile Data Traffic, Cloud Computing Traffic, Development Technologies. All the content presented in this PPT design is completely editable. Download it and make adjustments in color, background, font etc. as per your unique business setting. This slide graphically provides information about market size of big data. It further includes reasons for revenue growth such as expansion of data traffic, cloud computing traffic, development in technologies, etc
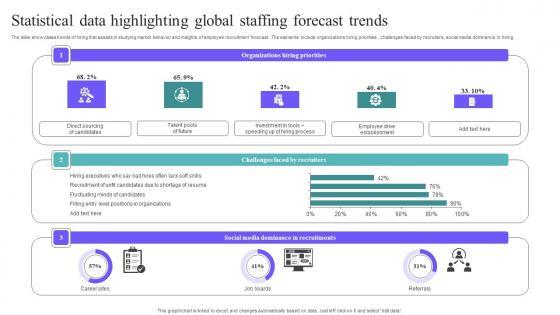
The slide showcases trends of hiring that assists in studying market behavior and insights of employee recruitment forecast . The elements include organizations hiring priorities , challenges faced by recruiters, social media dominance in hiring. Showcasing this set of slides titled Statistical Data Highlighting Global Staffing Forecast Trends Template Pdf. The topics addressed in these templates are Hiring Executives, Fluctuating Minds, Filling Entry Level Positions. All the content presented in this PPT design is completely editable. Download it and make adjustments in color, background, font etc. as per your unique business setting. The slide showcases trends of hiring that assists in studying market behavior and insights of employee recruitment forecast . The elements include organizations hiring priorities , challenges faced by recruiters, social media dominance in hiring.
This slide showcases graph that can help organization to forecast the inventory requirement on the basis of sales data of previous financial years. It showcases data of last 3 years. Find highly impressive Forecast Demand Using Historical Sales Data Tactical Guide Stock Administration Themes Pdf on Slidegeeks to deliver a meaningful presentation. You can save an ample amount of time using these presentation templates. No need to worry to prepare everything from scratch because Slidegeeks experts have already done a huge research and work for you. You need to download Forecast Demand Using Historical Sales Data Tactical Guide Stock Administration Themes Pdf for your upcoming presentation. All the presentation templates are 100 percent editable and you can change the color and personalize the content accordingly. Download now This slide showcases graph that can help organization to forecast the inventory requirement on the basis of sales data of previous financial years. It showcases data of last 3 years.
This slide showcases graph that can help organization to forecast the inventory requirement on the basis of sales data of previous financial years. It showcases data of last 3 years.Explore a selection of the finest Forecast Demand Using Historical Sales Data Retail Stock Administration Strategies Slides Pdf here. With a plethora of professionally designed and pre-made slide templates, you can quickly and easily find the right one for your upcoming presentation. You can use our Forecast Demand Using Historical Sales Data Retail Stock Administration Strategies Slides Pdf to effectively convey your message to a wider audience. Slidegeeks has done a lot of research before preparing these presentation templates. The content can be personalized and the slides are highly editable. Grab templates today from Slidegeeks. This slide showcases graph that can help organization to forecast the inventory requirement on the basis of sales data of previous financial years. It showcases data of last 3 years

This slide outlines the introduction of the forecast model used for predictive analytics to make the metric value predictions for business processes. This model uses the Prophet algorithm to make predictions and includes its use cases in the manufacturing industry. The best PPT templates are a great way to save time, energy, and resources. Slidegeeks have 100 percent editable powerpoint slides making them incredibly versatile. With these quality presentation templates, you can create a captivating and memorable presentation by combining visually appealing slides and effectively communicating your message. Download Predictive Data Model Predictive Analytics Forecast Model Introduction Themes PDF from Slidegeeks and deliver a wonderful presentation.


This slide showcases graph that can help organization to forecast the inventory requirement on the basis of sales data of previous financial years. It showcases data of last 3 years. Take your projects to the next level with our ultimate collection of Procurement Strategies For Reducing Stock Wastage Forecast Demand Using Historical Sales Data Designs PDF. Slidegeeks has designed a range of layouts that are perfect for representing task or activity duration, keeping track of all your deadlines at a glance. Tailor these designs to your exact needs and give them a truly corporate look with your own brand colors they will make your projects stand out from the rest.
41 Item(s)