- Sign up
- Sign In
 AI PPT Maker
 Templates
 PPT Bundles
 Design Services
 Business PPTs
 Business Plan
 Management
 Strategy
 Introduction PPT
 Roadmap
 Self Introduction
 Timelines
 Process
 Marketing
 Agenda
 Technology
 Medical
 Startup Business Plan
 Cyber Security
 Dashboards
 SWOT
SWOT Proposals
 Education
 Pitch Deck
 Digital Marketing
 KPIs
KPIs Project Management
 Product Management
 Artificial Intelligence
 Target Market
 Communication
 Supply Chain
 Google Slides
 Research Services
 One Pagers
 All Categories
Financials dashboard PowerPoint Presentation Templates and Google Slides
DISPLAYING: 60 of 308 Item(s)
Page

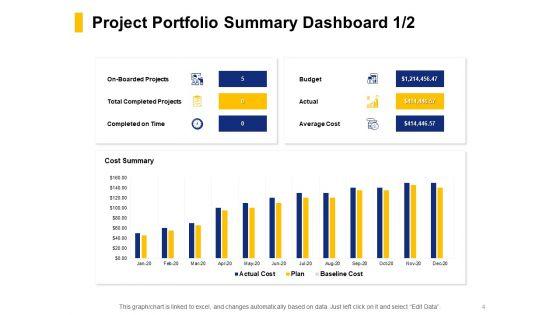
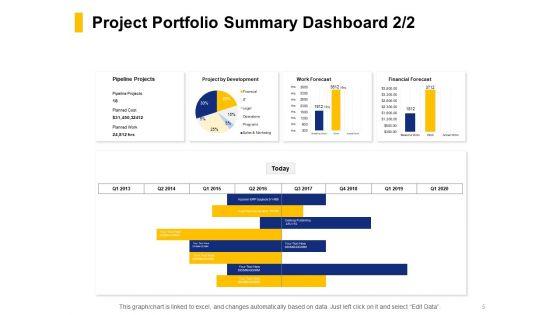


Presenting this set of slides with name financial assets management kpi and dashboard ppt powerpoint presentation complete deck with slides. The topics discussed in these slides are pipeline projects, financial forecast, work forecast. This is a completely editable PowerPoint presentation and is available for immediate download. Download now and impress your audience.


Improve your presentation delivery using this Financial KPI Dashboard Ppt PowerPoint Presentation Complete Deck With Slides. Support your business vision and objectives using this well structured PPT deck. This template offers a great starting point for delivering beautifully designed presentations on the topic of your choice. Comprising Twelve this professionally designed template is all you need to host discussion and meetings with collaborators. Each slide is self explanatory and equipped with high quality graphics that can be adjusted to your needs. Therefore, you will face no difficulty in portraying your desired content using this PPT slideshow. This PowerPoint slideshow contains every important element that you need for a great pitch. It is not only editable but also available for immediate download and utilization. The color, font size, background, shapes everything can be modified to create your unique presentation layout. Therefore, download it now.


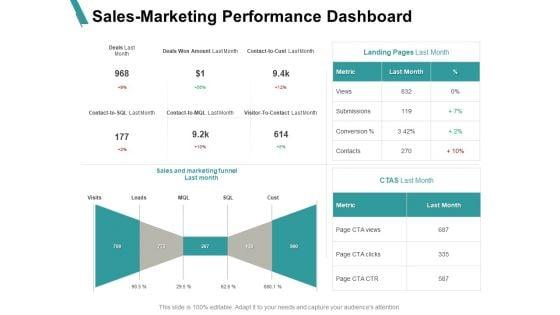

Presenting this set of slides with name sales marketing performance dashboard financial ppt powerpoint presentation styles backgrounds. The topics discussed in these slides are marketing, business, management, planning, strategy. This is a completely editable PowerPoint presentation and is available for immediate download. Download now and impress your audience.


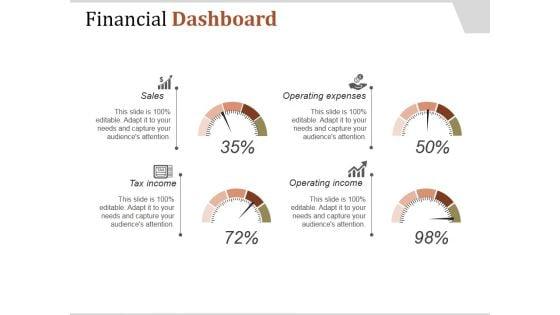


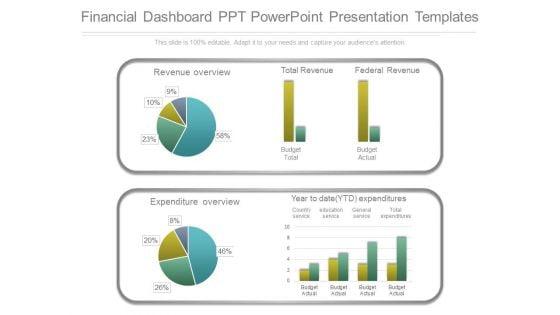
This is a financial dashboard ppt powerpoint presentation templates. This is a two stage process. The stages in this process are revenue overview, total revenue, federal revenue, budget total, budget actual, expenditure overview, year to date ytd expenditures, country service, education service, general service, total expenditures.


This slide showcases the KPIs that would help our business organization to evaluate improvements with the new financial strategy implementation. It includes total income, total expenses, accounts receivable, etc. The best PPT templates are a great way to save time, energy, and resources. Slidegeeks have 100 percent editable powerpoint slides making them incredibly versatile. With these quality presentation templates, you can create a captivating and memorable presentation by combining visually appealing slides and effectively communicating your message. Download Adjusting Financial Strategies And Planning KPI Dashboard To Analyze Financial Improvements Inspiration PDF from Slidegeeks and deliver a wonderful presentation.


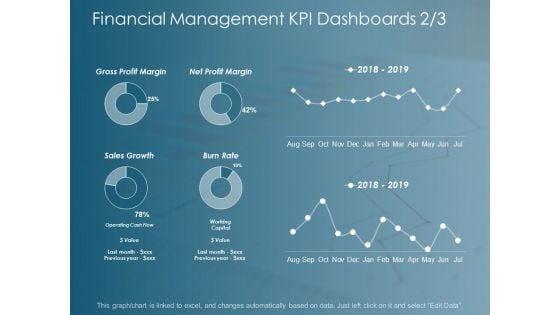
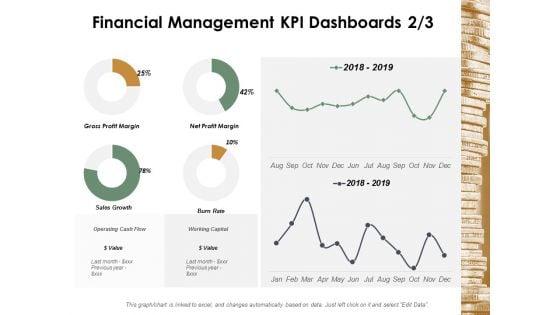
This slide showcases dashboard that can help organization to evaluate key changes in financial KPIs post fundraising. Its key components are net profit margin, revenue, gross profit margin, debt to equity and return on equity. Do you have to make sure that everyone on your team knows about any specific topic I yes, then you should give Financial Kpi Dashboard To Evaluate Fundraising Impact Topics PDF a try. Our experts have put a lot of knowledge and effort into creating this impeccable Financial Kpi Dashboard To Evaluate Fundraising Impact Topics PDF. You can use this template for your upcoming presentations, as the slides are perfect to represent even the tiniest detail. You can download these templates from the Slidegeeks website and these are easy to edit. So grab these today.
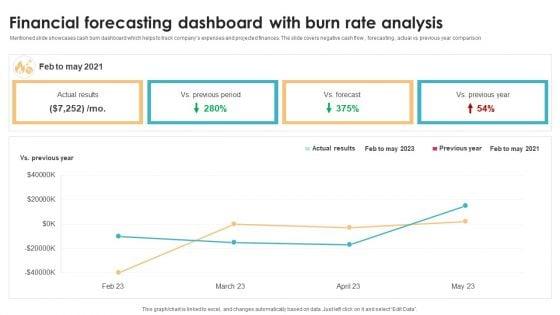
Mentioned slide showcases cash burn dashboard which helps to track companys expenses and projected finances. The slide covers negative cash flow , forecasting , actual vs previous year comparison Showcasing this set of slides titled Financial Forecasting Dashboard With Burn Rate Analysis Brochure PDF. The topics addressed in these templates are Previous Year, Analysis, Forecast. All the content presented in this PPT design is completely editable. Download it and make adjustments in color, background, font etc. as per your unique business setting.
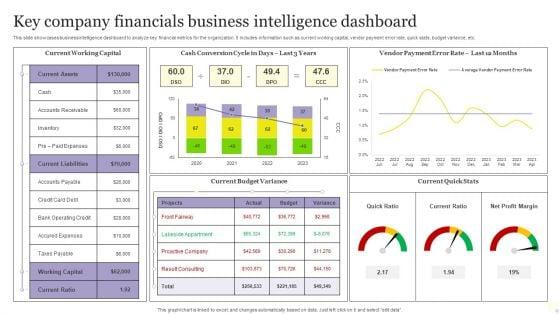
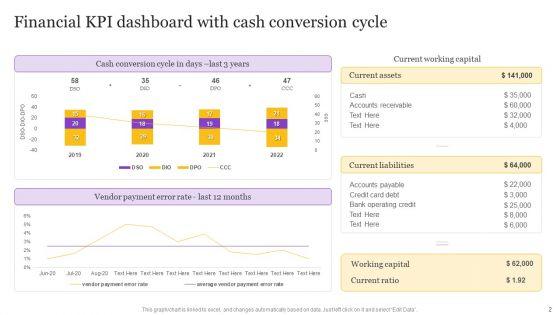
This slide showcases business intelligence dashboard to analyze key financial metrics for the organization. It includes information such as current working capital, vendor payment error rate, quick stats, budget variance, etc. Showcasing this set of slides titled Key Company Financials Business Intelligence Dashboard Graphics PDF. The topics addressed in these templates are Key Company Financials, Business Intelligence Dashboard. All the content presented in this PPT design is completely editable. Download it and make adjustments in color, background, font etc. as per your unique business setting.


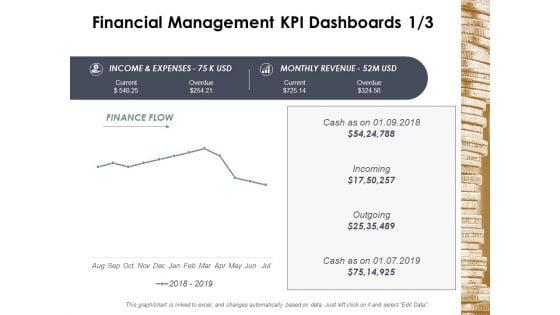
This slide showcases KPI dashboard for monitoring financial health of business to ensure smooth flow of business operations. It includes details such as COGS, net profit, cost breakdown, etc. Showcasing this set of slides titled Monthly Financial Metrics Dashboard With Revenue And Expenditure Rules PDF. The topics addressed in these templates are Net Profit, Costs, Expenditure. All the content presented in this PPT design is completely editable. Download it and make adjustments in color, background, font etc. as per your unique business setting.
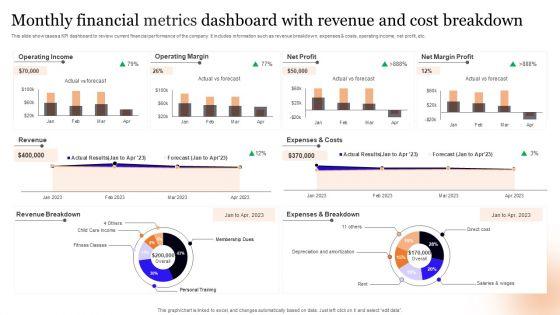
This slide showcases a KPI dashboard to review current financial performance of the company. It includes information such as revenue breakdown, expenses and costs, operating income, net profit, etc. Pitch your topic with ease and precision using this Monthly Financial Metrics Dashboard With Revenue And Cost Breakdown Information PDF. This layout presents information on Operating Income, Operating Margin, Net Profit. It is also available for immediate download and adjustment. So, changes can be made in the color, design, graphics or any other component to create a unique layout.
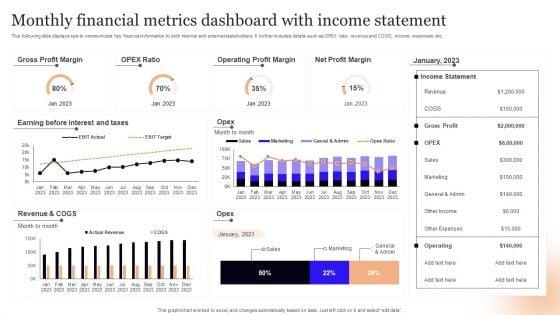
This following slide displays kpis to communicate key financial information to both internal and external stakeholders. It further includes details such as OPEX ratio, revenue and COGS, income, expenses, etc. Showcasing this set of slides titled Monthly Financial Metrics Dashboard With Income Statement Infographics PDF. The topics addressed in these templates are Gross Profit Margin, Taxes, Revenue. All the content presented in this PPT design is completely editable. Download it and make adjustments in color, background, font etc. as per your unique business setting.
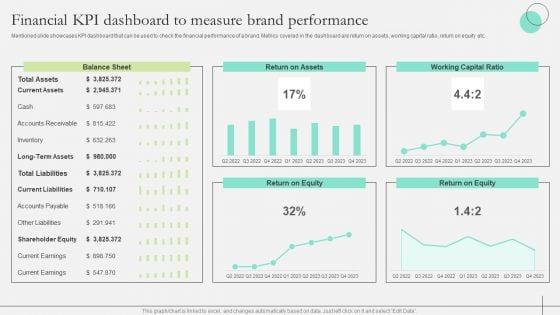

Mentioned slide showcases KPI dashboard that can be used to check the financial performance of a brand. Metrics covered in the dashboard are return on assets, working capital ratio, return on equity etc. Take your projects to the next level with our ultimate collection of Comprehensive Guide To Strengthen Brand Equity Financial KPI Dashboard Measure Brand Structure PDF. Slidegeeks has designed a range of layouts that are perfect for representing task or activity duration, keeping track of all your deadlines at a glance. Tailor these designs to your exact needs and give them a truly corporate look with your own brand colors they will make your projects stand out from the rest
This slide presents the dashboard which will help firm in tracking the fiscal performance. This dashboard displays revenues and expenses trends and payment received analysis. There are so many reasons you need a Financial Performance Tracking Dashboard Themes PDF. The first reason is you can not spend time making everything from scratch, Thus, Slidegeeks has made presentation templates for you too. You can easily download these templates from our website easily.
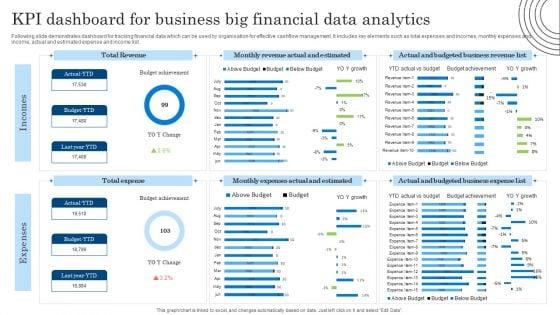
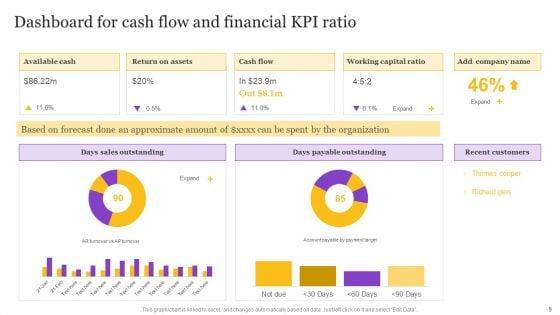
Following slide demonstrates dashboard for tracking financial data which can be used by organisation for effective cashflow management. It includes key elements such as total expenses and incomes, monthly expenses and income, actual and estimated expense and income list. Showcasing this set of slides titled KPI Dashboard For Business Big Financial Data Analytics Diagrams PDF. The topics addressed in these templates are KPI Dashboard, Business Big Financial, Data Analytics. All the content presented in this PPT design is completely editable. Download it and make adjustments in color, background, font etc. as per your unique business setting.
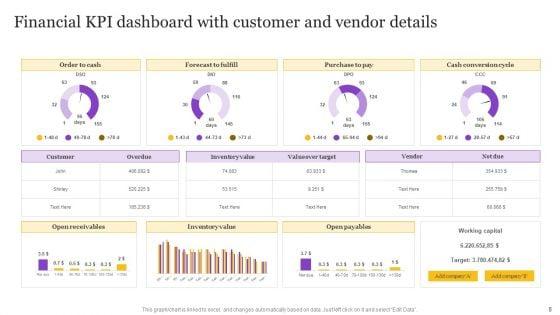
This slide provides information regarding dashboard utilized by firm to monitor financial performance. The performance is tracked through revenues generated, vendors associated, profit generated, etc. Whether you have daily or monthly meetings, a brilliant presentation is necessary. Corporate Financial Performance Tracking Dashboard Elements PDF can be your best option for delivering a presentation. Represent everything in detail using Corporate Financial Performance Tracking Dashboard Elements PDF and make yourself stand out in meetings. The template is versatile and follows a structure that will cater to your requirements. All the templates prepared by Slidegeeks are easy to download and edit. Our research experts have taken care of the corporate themes as well. So, give it a try and see the results.
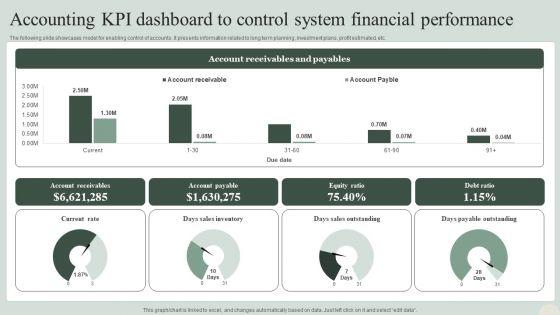

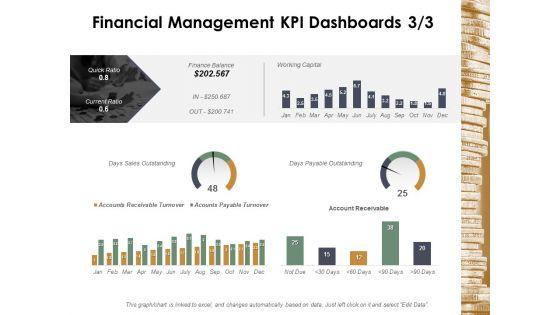
The following slide showcases model for enabling control of accounts. It presents information related to long term planning, investment plans, profit estimated, etc. Pitch your topic with ease and precision using this Accounting KPI Dashboard To Control System Financial Performance Formats PDF. This layout presents information on Sales Outstanding, Payable Outstanding, Sales Inventory. It is also available for immediate download and adjustment. So, changes can be made in the color, design, graphics or any other component to create a unique layout.

The following slide showcases KPI dashboard which can be used by finance managers to evaluate financial health of company. Revenue, expenses, net profit, bills receivable, bills payable, quick ratio, current ratio are some of the major metrics which are outlined in the slide. Do you have an important presentation coming up Are you looking for something that will make your presentation stand out from the rest Look no further than Market Evaluation Of IT Industry Financial Dashboard To Track Organization Expenses Clipart PDF. With our professional designs, you can trust that your presentation will pop and make delivering it a smooth process. And with Slidegeeks, you can trust that your presentation will be unique and memorable. So why wait Grab Market Evaluation Of IT Industry Financial Dashboard To Track Organization Expenses Clipart PDF today and make your presentation stand out from the rest.
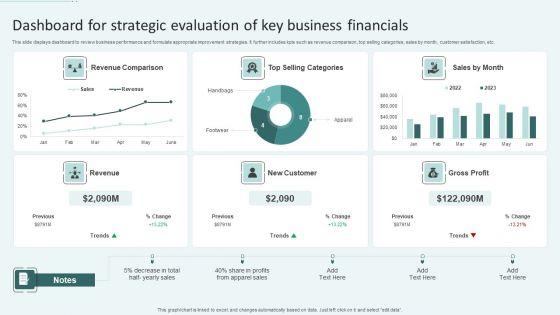

This slide displays dashboard to review business performance and formulate appropriate improvement strategies. It further includes kpis such as revenue comparison, top selling categories, sales by month, customer satisfaction, etc. Showcasing this set of slides titled Dashboard For Strategic Evaluation Of Key Business Financials Ppt Gallery Aids PDF. The topics addressed in these templates are Revenue Comparison, Top Selling Categories, New Customer. All the content presented in this PPT design is completely editable. Download it and make adjustments in color, background, font etc. as per your unique business setting.


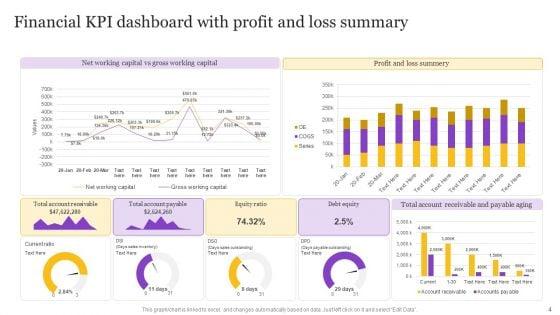
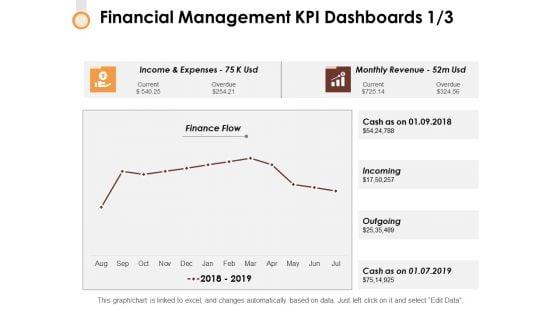
This slide shows the financial statement analysis dashboard of organization. It covers various KPIs such as OPEX Ratio, operating profit margin, gross profit margin, net profit margin, etc. Pitch your topic with ease and precision using this Financial Position Evaluation Dashboard With Operating Profit Margin Elements PDF. This layout presents information on Income Statement, Revenue, Operating Profit, Net Profit. It is also available for immediate download and adjustment. So, changes can be made in the color, design, graphics or any other component to create a unique layout.


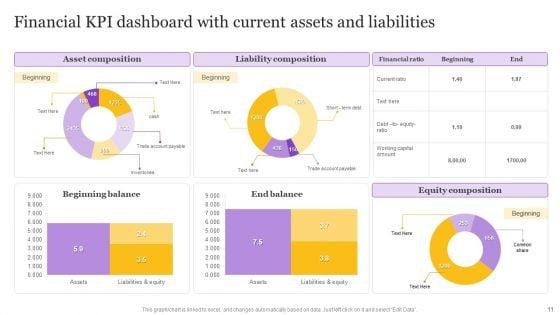
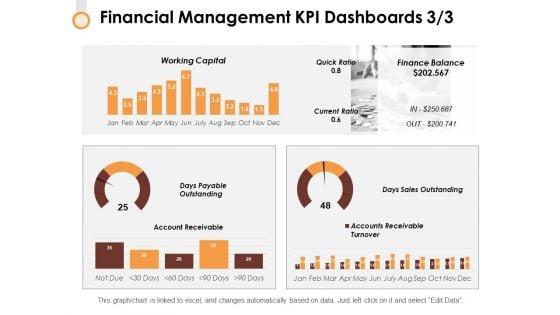
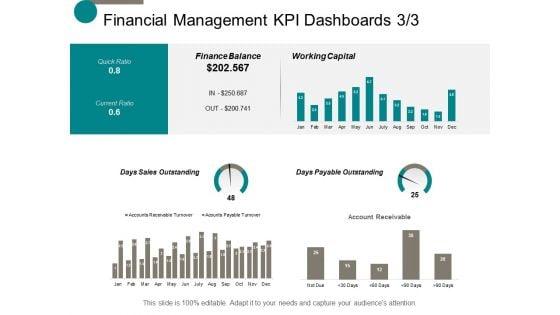
This slide shows the cash financial statement analysis dashboard of the firm. It covers KPIs such as quick ratio, current ratio, cash balance, days sales outstanding, etc. Showcasing this set of slides titled Financial Position Evaluation Dashboard With Cash Balance Rules PDF. The topics addressed in these templates are Cash Conversion, Working Capital, Days Sales Outstanding. All the content presented in this PPT design is completely editable. Download it and make adjustments in color, background, font etc. as per your unique business setting.


The following slides highlights the financial kpas in summarized form to evaluate companys annual operating performance. It includes metrics such as gross, operating and net profit margin, income statement, target versus actual EBIT etc. Pitch your topic with ease and precision using this Annual Financial Data With KPI Insights Dashboard Structure PDF. This layout presents information on Gross Profit Margin, Operating Profit Margin, Net Profit Margin. It is also available for immediate download and adjustment. So, changes can be made in the color, design, graphics or any other component to create a unique layout.
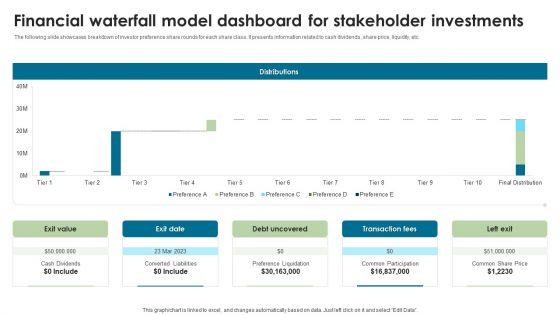
The following slide showcases breakdown of investor preference share rounds for each share class. It presents information related to cash dividends, share price, liquidity, etc. Showcasing this set of slides titled Financial Waterfall Model Dashboard For Stakeholder Investments Graphics PDF. The topics addressed in these templates are Distributions, Transaction Fees, Left Exit. All the content presented in this PPT design is completely editable. Download it and make adjustments in color, background, font etc. as per your unique business setting.
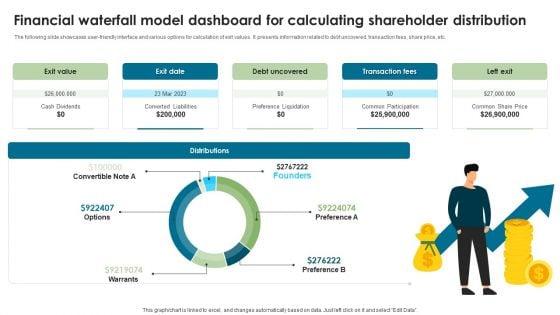

The following slide showcases user-friendly interface and various options for calculation of exit values. It presents information related to debt uncovered, transaction fees, share price, etc. Showcasing this set of slides titled Financial Waterfall Model Dashboard For Calculating Shareholder Distribution Slides PDF. The topics addressed in these templates are Exit Value, Exit Date, Debt Uncovered. All the content presented in this PPT design is completely editable. Download it and make adjustments in color, background, font etc. as per your unique business setting.
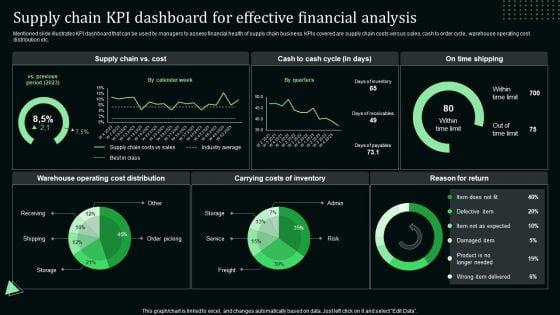
Mentioned slide illustrates KPI dashboard that can be used by managers to assess financial health of supply chain business. KPIs covered are supply chain costs versus sales, cash to order cycle, warehouse operating cost distribution etc.Coming up with a presentation necessitates that the majority of the effort goes into the content and the message you intend to convey. The visuals of a PowerPoint presentation can only be effective if it supplements and supports the story that is being told. Keeping this in mind our experts created Supply Chain Kpi Dashboard For Effective Financial Analysis Stand Out Digital Supply Chain Tactics Enhancing Graphics PDF to reduce the time that goes into designing the presentation. This way, you can concentrate on the message while our designers take care of providing you with the right template for the situation.
This slide provides information regarding dashboard utilized by firm to monitor financial performance. The performance is tracked through revenues generated, vendors associated, profit generated, etc. This Strategic Corporate Planning To Attain Corporate Financial Performance Tracking Dashboard Icons PDF is perfect for any presentation, be it in front of clients or colleagues. It is a versatile and stylish solution for organizing your meetings. The Strategic Corporate Planning To Attain Corporate Financial Performance Tracking Dashboard Icons PDF features a modern design for your presentation meetings. The adjustable and customizable slides provide unlimited possibilities for acing up your presentation. Slidegeeks has done all the homework before launching the product for you. So, do not wait, grab the presentation templates today
This slide provides information regarding dashboard utilized by firm to monitor financial performance. The performance is tracked through revenues generated, vendors associated, profit generated, etc. If you are looking for a format to display your unique thoughts, then the professionally designed Corporate Financial Performance Tracking Dashboard Diagrams PDF is the one for you. You can use it as a Google Slides template or a PowerPoint template. Incorporate impressive visuals, symbols, images, and other charts. Modify or reorganize the text boxes as you desire. Experiment with shade schemes and font pairings. Alter, share or cooperate with other people on your work. Download Corporate Financial Performance Tracking Dashboard Diagrams PDF and find out how to give a successful presentation. Present a perfect display to your team and make your presentation unforgettable.
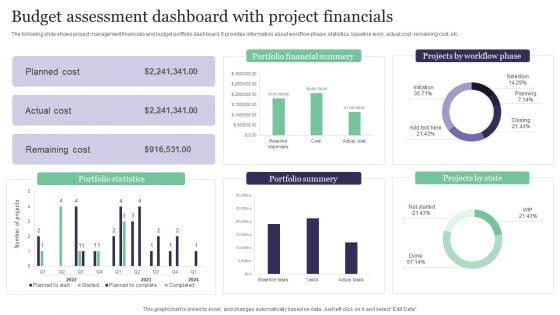

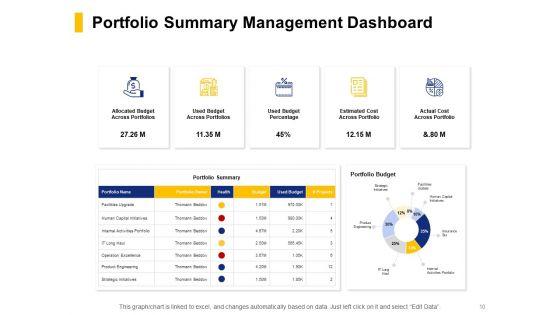
The following slide shows project management financials and budget portfolio dashboard. It provides information about workflow phase, statistics, baseline work, actual cost, remaining cost, etc. Showcasing this set of slides titled Budget Assessment Dashboard With Project Financials Rules PDF. The topics addressed in these templates are Portfolio Statistics, Portfolio Summery, Projects By State. All the content presented in this PPT design is completely editable. Download it and make adjustments in color, background, font etc. as per your unique business setting.
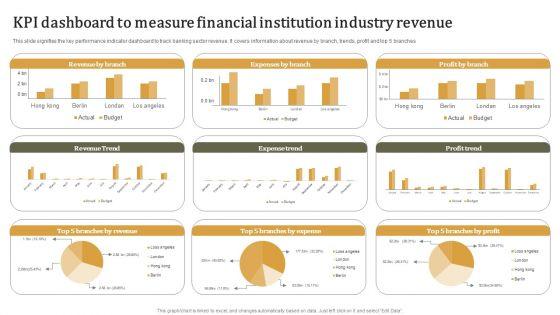
Pitch your topic with ease and precision using this KPI Dashboard To Measure Financial Institution Industry Revenue Summary PDF. This layout presents information on Measure Financial, Institution Industry . It is also available for immediate download and adjustment. So, changes can be made in the color, design, graphics or any other component to create a unique layout.
This slide depicts a dashboard for tracking the banking and financial activities of a business enterprise to measure the income and expenses. The key performing indicators are business accounts, paid, pending and cancelled transactions etc. Pitch your topic with ease and precision using this KPI Dashboard For Tracking Commercial Banking And Financial Activities Download PDF. This layout presents information on KPI Dashboard, Tracking Commercial Banking, Financial Activities. It is also available for immediate download and adjustment. So, changes can be made in the color, design, graphics or any other component to create a unique layout.
DISPLAYING: 60 of 308 Item(s)
Page