- Sign up
- Sign In
 AI PPT Maker
 Templates
 PPT Bundles
 Design Services
 Business PPTs
 Business Plan
 Management
 Strategy
 Introduction PPT
 Roadmap
 Self Introduction
 Timelines
 Process
 Marketing
 Agenda
 Technology
 Medical
 Startup Business Plan
 Cyber Security
 Dashboards
 SWOT
SWOT Proposals
 Education
 Pitch Deck
 Digital Marketing
 KPIs
KPIs Project Management
 Product Management
 Artificial Intelligence
 Target Market
 Communication
 Supply Chain
 Google Slides
 Research Services
 One Pagers
 All Categories
Financial projection graph PowerPoint Presentation Templates and Google Slides
38 Item(s)


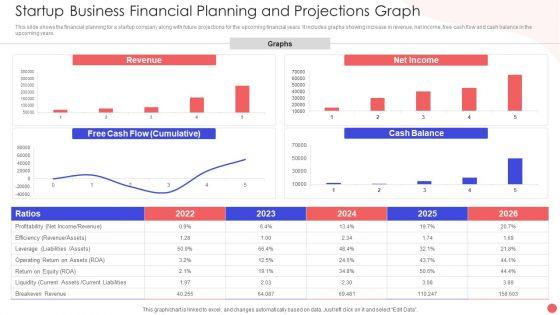
This slide shows the financial planning for a startup company along with future projections for the upcoming financial years. It includes graphs showing increase in revenue, net income, free cash flow and cash balance in the upcoming years. Pitch your topic with ease and precision using this Startup Business Financial Planning And Projections Graph Slides PDF. This layout presents information on Revenue Graphs Operating, Free Cash Flow, Net Income Ration. It is also available for immediate download and adjustment. So, changes can be made in the color, design, graphics or any other component to create a unique layout.
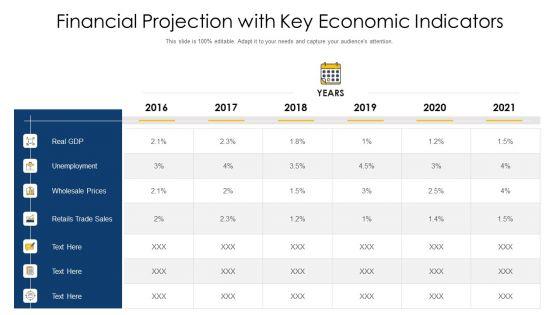

Pitch your topic with ease and precision using this financial projection with key economic indicators ppt styles graphics design pdf. This layout presents information on unemployment, retails trade sales, wholesale prices. It is also available for immediate download and adjustment. So, changes can be made in the color, design, graphics or any other component to create a unique layout.

The slide provides the financials projections of the company for next five years. Key Data points include revenue, operating income, net income, cash flow, cash in hand, total assets etc. Deliver an awe inspiring pitch with this creative investment fundraising pitch deck from stock market key financial projection for next five years graphics pdf bundle. Topics like financing, cash flow, revenue, operating expense, operating income can be discussed with this completely editable template. It is available for immediate download depending on the needs and requirements of the user.


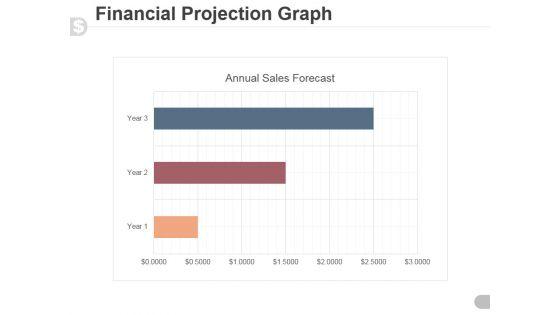
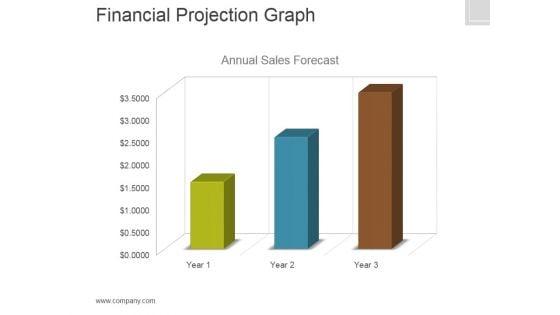
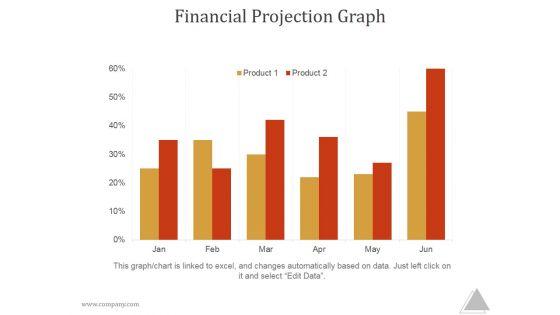
Deliver an awe inspiring pitch with this creative investor pitch deck new venture capital raising financial projection graph demonstration pdf bundle. Topics like financial projection graph can be discussed with this completely editable template. It is available for immediate download depending on the needs and requirements of the user.

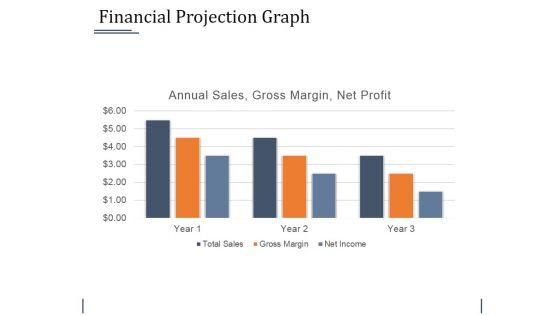
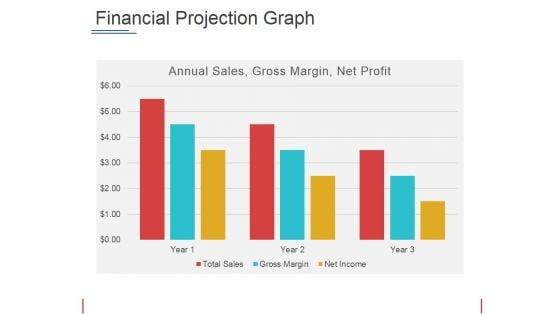
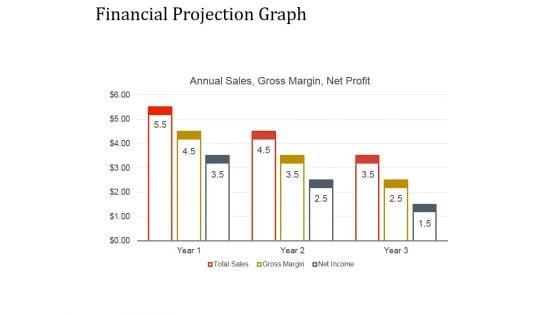
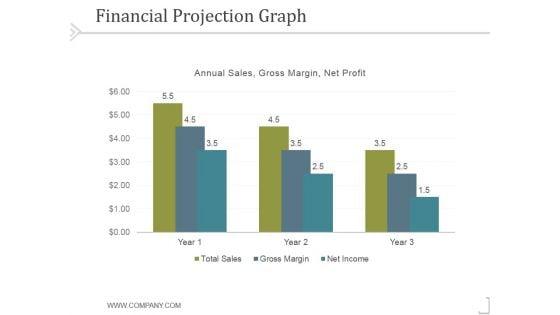
Deliver and pitch your topic in the best possible manner with this investor pitch deck new venture capital raising financial projection graph slide2 portrait pdf. Use them to share invaluable insights on annual sales, gross margin, net profit and impress your audience. This template can be altered and modified as per your expectations. So, grab it now.

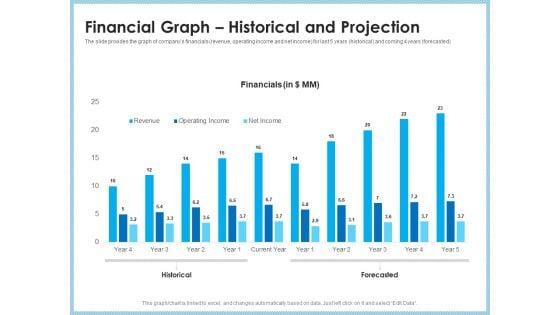
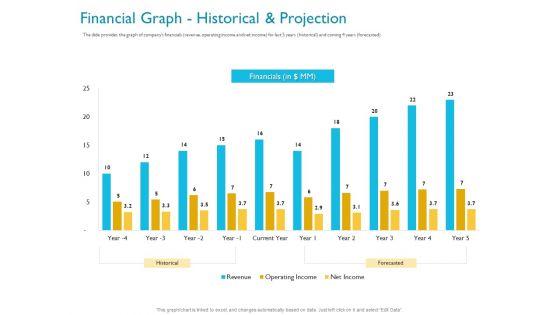
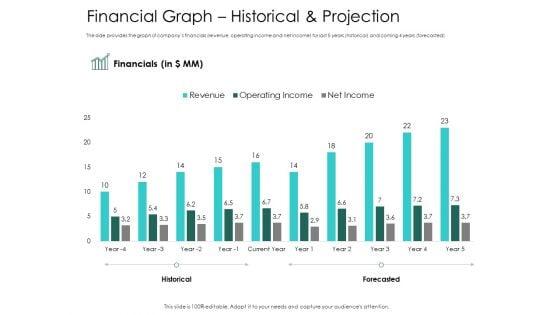
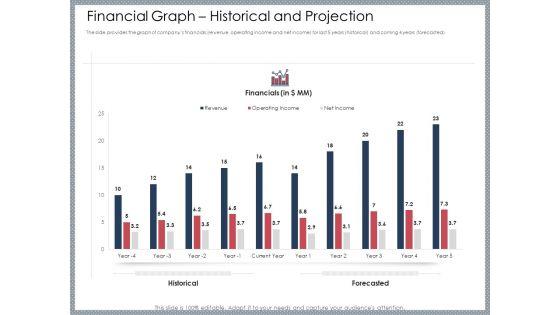
The slide provides the graph of companys financials revenue, operating income and net income for last 5 years historical and coming 4 years forecasted. Deliver and pitch your topic in the best possible manner with this investor pitch deck fundraising via mezzanine equity instrument financial graph historical and projection formats pdf. Use them to share invaluable insights on financial graph historical and projection and impress your audience. This template can be altered and modified as per your expectations. So, grab it now.


Deliver an awe-inspiring pitch with this creative convertible debt financing pitch deck financial graph historical and projection clipart pdf bundle. Topics like revenue, operating income, net income can be discussed with this completely editable template. It is available for immediate download depending on the needs and requirements of the user.


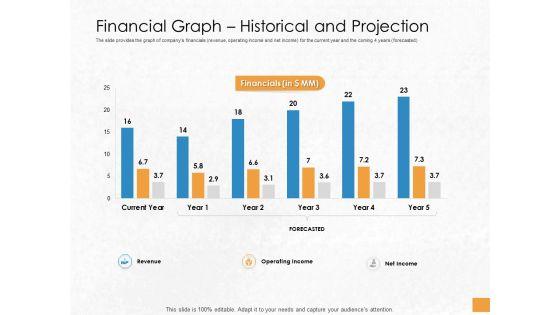
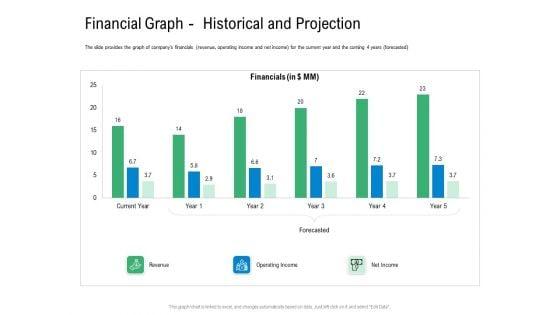
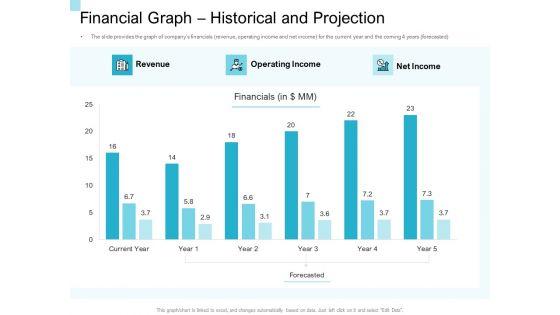
The slide provides the graph of companys financials revenue, operating income and net income for the current year and the coming 4 years forecasted. Deliver an awe-inspiring pitch with this creative convertible bond financing pitch deck financial graph historical and projection slides pdf bundle. Topics like revenue, operating income, net income, financial can be discussed with this completely editable template. It is available for immediate download depending on the needs and requirements of the user.
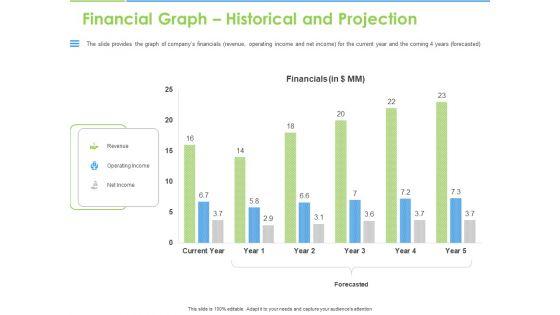

The slide provides the graph of companys financials revenue, operating income and net income for the current year and the coming 4 years forecasted. Deliver an awe-inspiring pitch with this creative convertible bonds pitch deck for increasing capitals financial graph historical and projection elements pdf bundle. Topics like revenue, operating income, net income, forecasted, financials, current year can be discussed with this completely editable template. It is available for immediate download depending on the needs and requirements of the user.

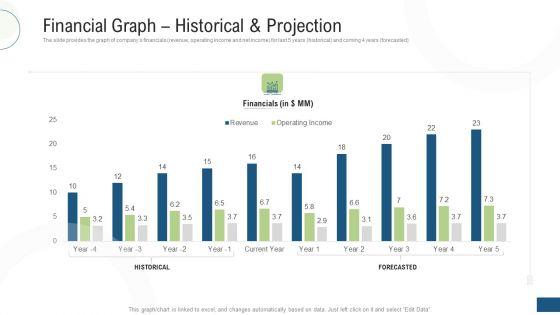
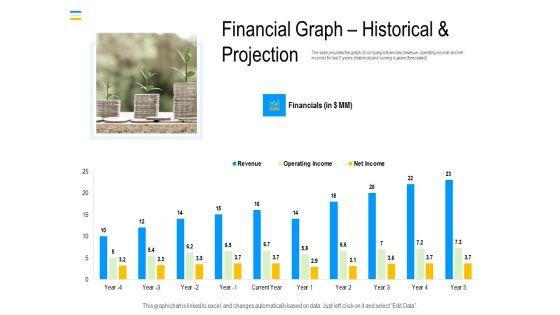
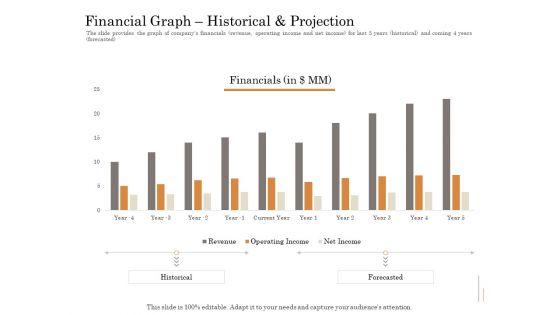
The slide provides the graph of companys financials revenue, operating income and net income for last 5 years historical and coming 4 years forecasted. Deliver an awe-inspiring pitch with this creative investor pitch deck to collect capital from subordinated loan financial graph historical and projection introduction pdf bundle. Topics like financials, net income, operating income, revenue, historical, forecasted can be discussed with this completely editable template. It is available for immediate download depending on the needs and requirements of the user.

The slide provides the graph of companys financials revenue, operating income and net income for last 5 years historical and coming 4 years forecasted. Deliver and pitch your topic in the best possible manner with this investment pitch to generating capital from mezzanine credit financial graph historical and projection microsoft pdf. Use them to share invaluable insights on revenue, operating income, net income, current year, historical, forecasted and impress your audience. This template can be altered and modified as per your expectations. So, grab it now.
The slide provides the graph of companys financials revenue, operating income and net income for last 5 years historical and coming 4 years forecasted. Deliver and pitch your topic in the best possible manner with this investor funding deck for hybrid financing financial graph historical and projection ppt layouts slides pdf. Use them to share invaluable insights on historical, forecasted, net income, operating income, financial and impress your audience. This template can be altered and modified as per your expectations. So, grab it now.

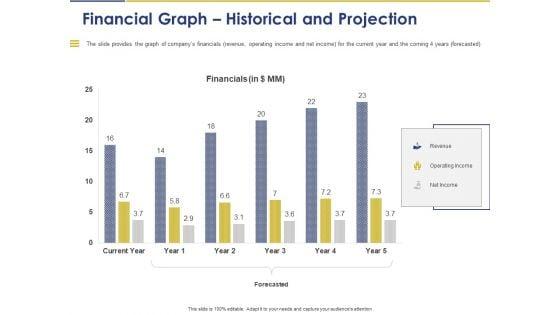
The slide provides the graph of companys financials revenue, operating income and net income for the current year and the coming 4 years forecasted. Deliver an awe-inspiring pitch with this creative convertible debenture funding financial graph historical and projection ppt professional themes pdf bundle. Topics like revenue, operating income, net income, forecasted, financials, current year can be discussed with this completely editable template. It is available for immediate download depending on the needs and requirements of the user.
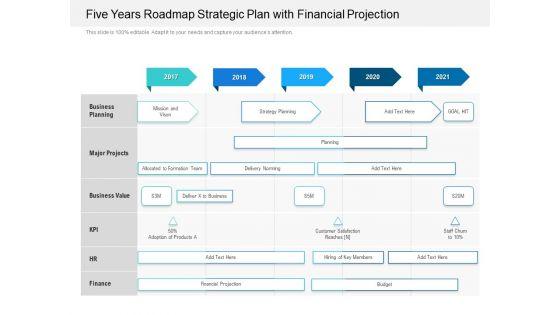
Introducing our five years roadmap strategic plan with financial projection graphics. This PPT presentation is Google Slides compatible, therefore, you can share it easily with the collaborators for measuring the progress. Also, the presentation is available in both standard screen and widescreen aspect ratios. So edit the template design by modifying the font size, font type, color, and shapes as per your requirements. As this PPT design is fully editable it can be presented in PDF, JPG and PNG formats.

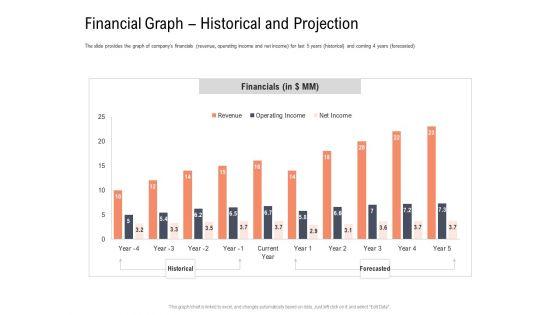
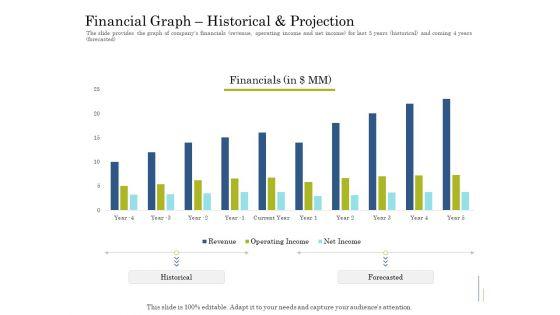
The slide provides the graph of companys financials revenue, operating income and net income for last 5 years historical and coming 4 years forecasted. Deliver an awe inspiring pitch with this creative hybrid investment pitch deck financial graph historical and projection ppt portfolio design inspiration pdf bundle. Topics like financial, revenue, operating income, net income can be discussed with this completely editable template. It is available for immediate download depending on the needs and requirements of the user.

The slide provides the graph of companys financials revenue, operating income and net income for the current year and the coming 4 years forecasted. Deliver an awe inspiring pitch with this creative convertible preferred stock funding pitch deck financial graph historical and projection themes pdf bundle. Topics like revenue, operating income, net income can be discussed with this completely editable template. It is available for immediate download depending on the needs and requirements of the user.

The slide provides the graph of companys financials revenue, operating income and net income for last five years historical and coming four years forecasted. Deliver and pitch your topic in the best possible manner with this mezzanine debt financing pitch deck financial graph historical and projection demonstration pdf. Use them to share invaluable insights on financials, revenue, operating income and impress your audience. This template can be altered and modified as per your expectations. So, grab it now.

The slide provides the graph of companys financials revenue operating income and net income for last five years historical and coming four years forecasted. Deliver and pitch your topic in the best possible manner with this mezzanine venture capital funding pitch deck financial graph historical and projection pictures pdf. Use them to share invaluable insights on financial, historical, projection, year, revenue and impress your audience. This template can be altered and modified as per your expectations. So, grab it now.

The slide provides the graph of companys financials revenue, operating income and net income for last 5 years historical and coming 4 years forecasted. Deliver and pitch your topic in the best possible manner with this subordinated loan funding financial graph historical and projection ppt model file formats pdf. Use them to share invaluable insights on revenue, operating income, net income, current year. and impress your audience. This template can be altered and modified as per your expectations. So, grab it now.
Deliver an awe inspiring pitch with this creative supplementary debt financing pitch deck financial graph historical and projection brochure pdf bundle. Topics like financial, revenue, operating income, net income can be discussed with this completely editable template. It is available for immediate download depending on the needs and requirements of the user.

Deliver an awe inspiring pitch with this creative convertible market notes financial graph historical and projection ppt summary show pdf bundle. Topics like revenue, operating income, net income, financial can be discussed with this completely editable template. It is available for immediate download depending on the needs and requirements of the user.
Presenting this set of slides with name convertible note pitch deck funding strategy financial graph historical and projection ppt powerpoint presentation infographics layouts pdf. The topics discussed in these slides are financials, revenue, operating income, net income, forecasted. This is a completely editable PowerPoint presentation and is available for immediate download. Download now and impress your audience.

Presenting this set of slides with name profit loss statement financial projections graph ppt powerpoint presentation summary slides. The topics discussed in these slides are sales, gross profit, operating expenses, income before taxes. This is a completely editable PowerPoint presentation and is available for immediate download. Download now and impress your audience.
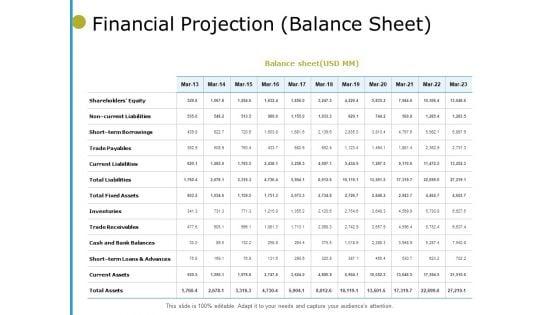
Presenting this set of slides with name financial projection balance sheet ppt powerpoint presentation file graphics. The topics discussed in these slides are equity, liabilities, borrowings, inventories, trade receivables. This is a completely editable PowerPoint presentation and is available for immediate download. Download now and impress your audience.
38 Item(s)