AI PPT Maker
Templates
PPT Bundles
Design Services
Business PPTs
Business Plan
Management
Strategy
Introduction PPT
Roadmap
Self Introduction
Timelines
Process
Marketing
Agenda
Technology
Medical
Startup Business Plan
Cyber Security
Dashboards
SWOT
Proposals
Education
Pitch Deck
Digital Marketing
KPIs
Project Management
Product Management
Artificial Intelligence
Target Market
Communication
Supply Chain
Google Slides
Research Services
One Pagers
All Categories
Financial chart PowerPoint Presentation Templates and Google Slides
SHOW
- 60
- 120
- 180
DISPLAYING: 60 of 238 Item(s)
Page


Slide 1 of 16
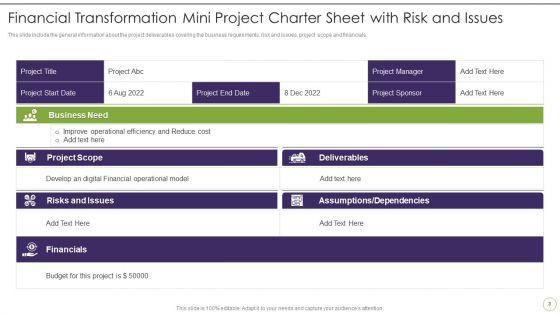
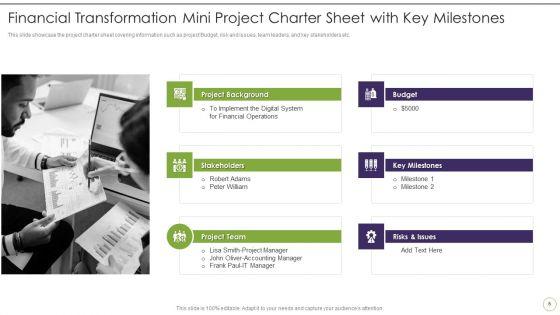
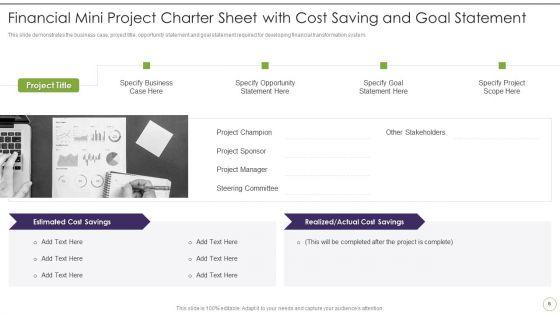
This complete deck covers various topics and highlights important concepts. It has PPT slides which cater to your business needs. This complete deck presentation emphasizes Financial Transformation Small Project Charter Sheet Ppt PowerPoint Presentation Complete Deck With Slides and has templates with professional background images and relevant content. This deck consists of total of sixteen slides. Our designers have created customizable templates, keeping your convenience in mind. You can edit the colour, text and font size with ease. Not just this, you can also add or delete the content if needed. Get access to this fully editable complete presentation by clicking the download button below.


Slide 1 of 16
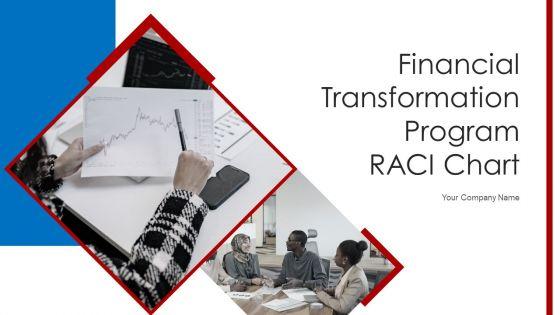
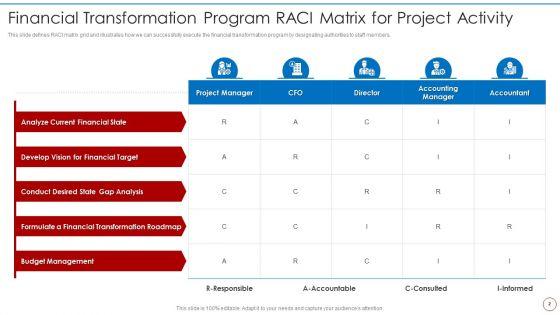
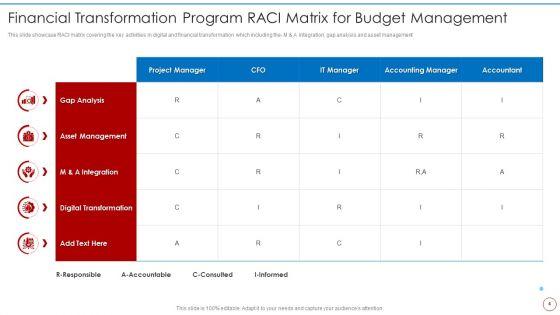
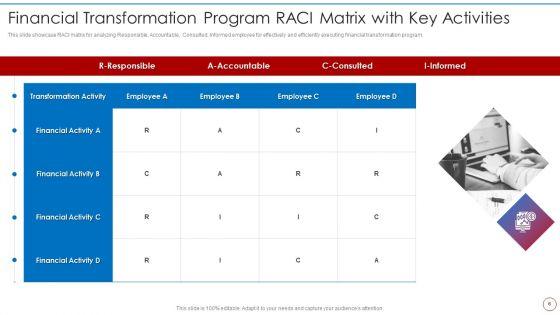
Pitch yourself both in house and outside by utilizing this complete deck. This Financial Transformation Program RACI Chart Ppt PowerPoint Presentation Complete Deck With Slides focuses on key fundamentals of the topic, displayed using different slides. With a total of sixteen slides, this template is the best tool you can use to persuade your audience. It will not only help you create great presentations but also induce strategic thinking because of its well researched content and graphics. You can easily personalize any of the elements to suit your unique business setting. Additionally, it can be saved in PNG, JPG, and PDF formats to save your time and resources.


Slide 1 of 15
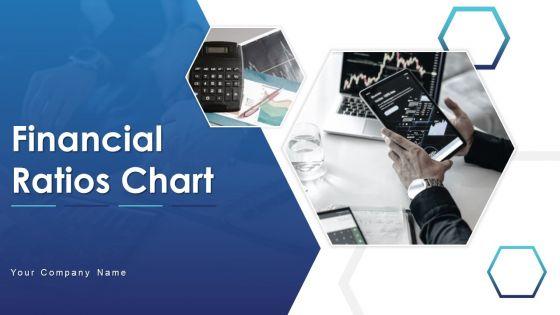
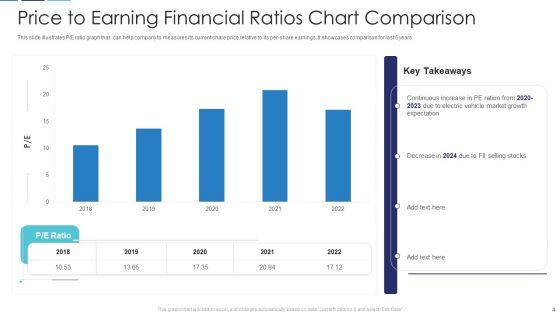
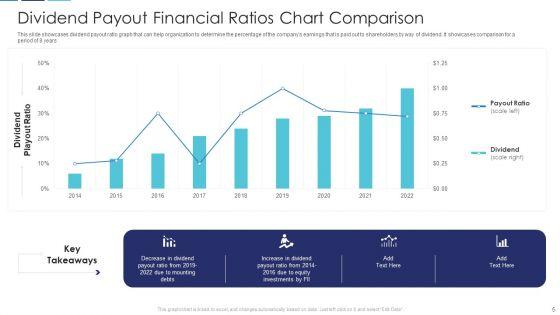
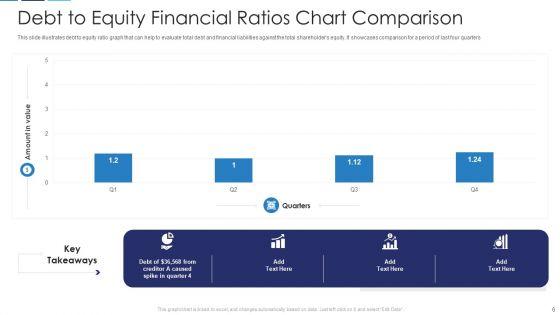
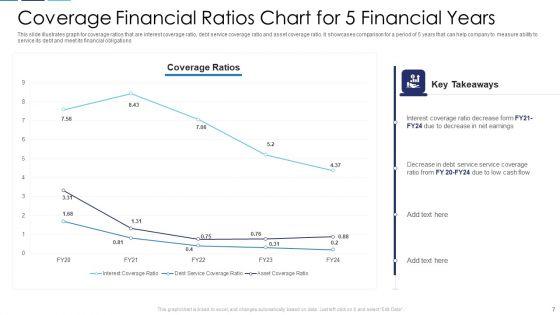
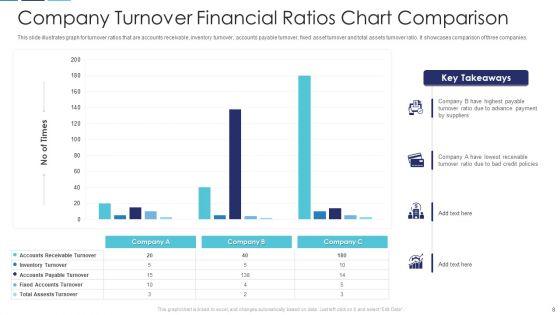
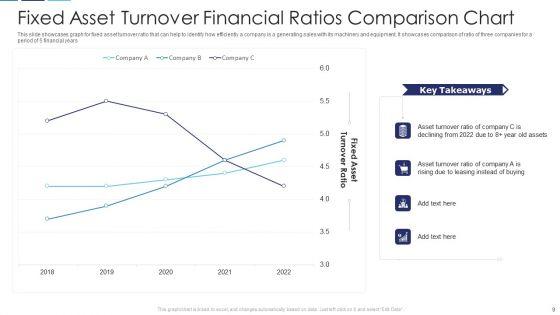
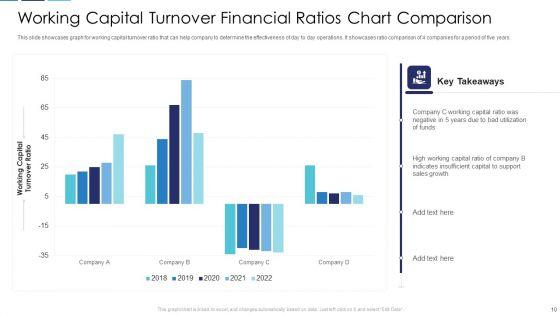
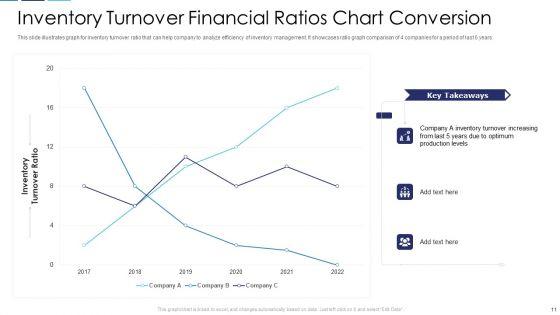
Pitch yourself both in house and outside by utilizing this complete deck. This financial ratios chart ppt powerpoint presentation complete deck with slides focuses on key fundamentals of the topic, displayed using different slides. With a total of fifteen slides, this template is the best tool you can use to persuade your audience. It will not only help you create great presentations but also induce strategic thinking because of its well researched content and graphics. You can easily personalize any of the elements to suit your unique business setting. Additionally, it can be saved in PNG, JPG, and PDF formats to save your time and resources.


Slide 1 of 7
This is a financials base plan table chart powerpoint slide designs. This is a five stage process. The stages in this process are revenue, cost of sales, gross profit, customer acquisition cost, other operating cost expense, operating profit, change in cash, ending cash.


Slide 1 of 7
This is a financials base plan table chart ppt slide templates. This is a five stage process. The stages in this process are kpi, revenue, cost of sales, gross profit, customer acquisition cost, other operating cost expense, operating profit, change in cash, ending cash, employees ftes.


Slide 1 of 7
This is a financial planning circular chart powerpoint graphics. This is a five stage process. The stages in this process are risk management, cash flow, estate planning, retirement, investments.


Slide 1 of 7
This is a financial planning steps infographic chart ppt samples download. This is a five stage process. The stages in this process are investments, retirement, estate planning, risk management, cash flow.


Slide 1 of 7
This is a financial analysis progressive chart powerpoint slide download. This is a three stage process. The stages in this process are 3 point 4 percent dollar 832 point 5m, 7 point 5 percent dollar 435 point 2 m, 10 point 1 percent dollar 721 point 8m.


Slide 1 of 7
This is a financial information systems chart example of ppt presentation. This is a three stage process. The stages in this process are process, people, value, technology.


Slide 1 of 7
This is a financial investments pie chart design powerpoint show. This is a eight stage process. The stages in this process are stocks, real estate, mutual funds, precious metal, bonds, art, collectibles, antiques.


Slide 1 of 7
This is a financial logistics pyramid chart presentation ideas. This is a five stage process. The stages in this process are advice, risk management, liquidity management, cash flow management, payments and receivables.


Slide 1 of 7
This is a financial marketing solutions chart presentation ideas. This is a eight stage process. The stages in this process are direct deposits, e commerce, prepaid cards, bill payments, money orders, small loans, mobile transaction, international money transfer.


Slide 1 of 7
This is a financial transaction and accounting flow chart ppt slides. This is a eight stage process. The stages in this process are financial transactions, journals, ledger, trial balance, reversing entries, income statement balance sheet, closing entries, balance day adjustments.


Slide 1 of 7
This is a cash flow and financial independence process flow chart ppt sample. This is a five stage process. The stages in this process are risk management, business and benefits, cash flow and financial independence, investment planning, tax strategies, legacy and estate.


Slide 1 of 7
This is a operational flow of financial services chart example of ppt. This is a five stage process. The stages in this process are customer, mobile, atm, employees, high finance trading.


Slide 1 of 7
This is a advisor financial marketing plan chart presentation ideas. This is a two stage process. The stages in this process are product service price, feature, benefit.


Slide 1 of 7
This is a financial public relations arrows chart powerpoint templates. This is a five stage process. The stages in this process are investor relations, consumer relations, government relations, public relations, internal communications, crisis communications.


Slide 1 of 7
This is a financial marketing organization chart presentation ideas. This is a five stage process. The stages in this process are financial system, financial institutions, financial markets, financial instruments, financial services.\n\n


Slide 1 of 7
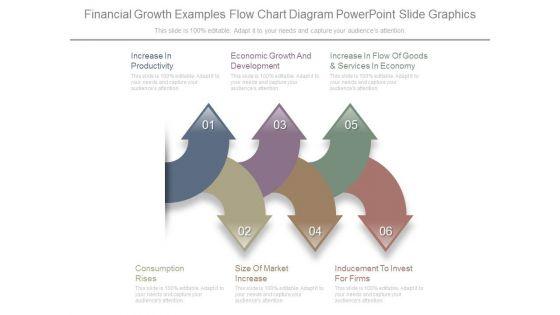
This is a financial growth examples flow chart diagram powerpoint slide graphics. This is a six stage process. The stages in this process are increase in productivity, economic growth and development, increase in flow of goods and services in economy, consumption rises, size of market increase, inducement to invest for firms.


Slide 1 of 7
This is a financial growth chart ppt background designs. This is a five stage process. The stages in this process are financial growth.\n\n\n\n\n\n\n\n\n\n\n\n\n\n\n\n\n\n


Slide 1 of 7
This is a financial analyst growth chart presentation diagrams. This is a three stage process. The stages in this process are reporting, growth, analysis.


Slide 1 of 7
This is a financial balanced scorecard pie chart ppt slide. This is a four stage process. The stages in this process are organizational capacity, internal processes, grow net revenue, financial resources.


Slide 1 of 6
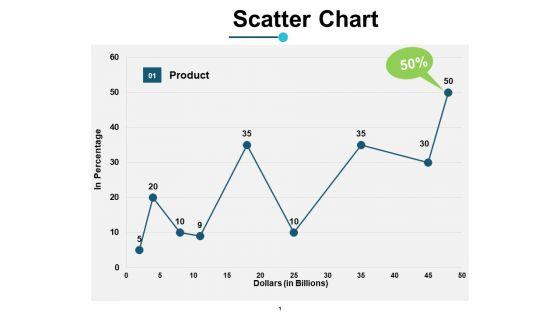
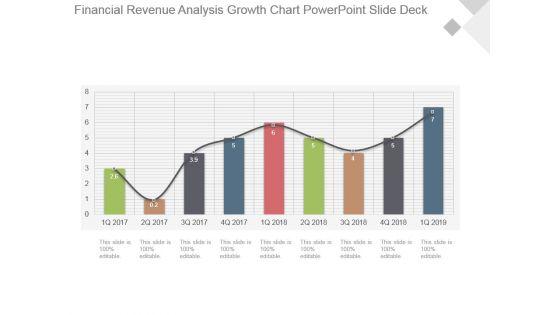
Presenting this set of slides with name quarterly sales growth chart for financial report ppt powerpoint presentation ideas infographics. The topics discussed in these slides are revenue trend, bar chart, financial. This is a completely editable PowerPoint presentation and is available for immediate download. Download now and impress your audience.


Slide 1 of 6
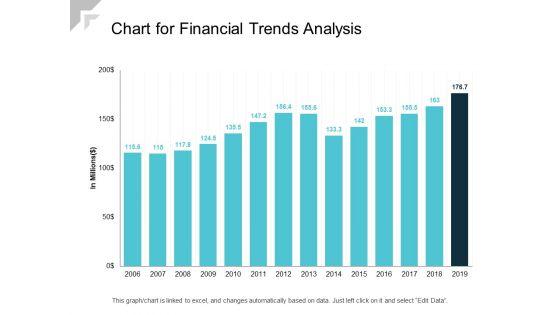
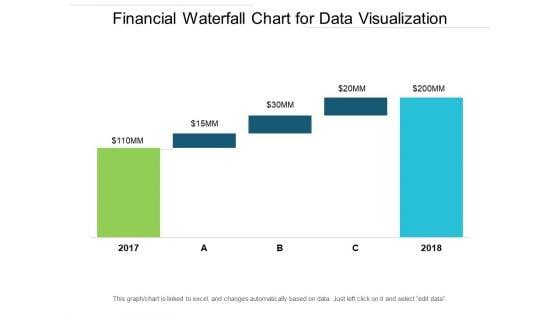
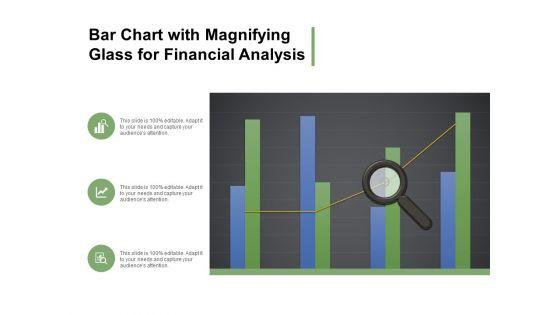
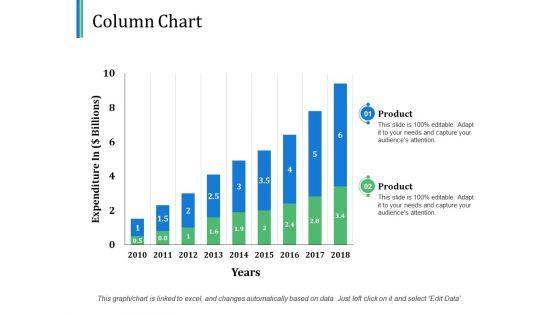
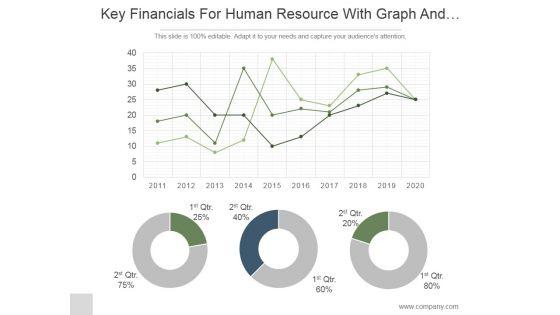
Presenting this set of slides with name chart for financial trends analysis ppt powerpoint presentation inspiration background image. The topics discussed in these slides are revenue trend, bar chart, financial. This is a completely editable PowerPoint presentation and is available for immediate download. Download now and impress your audience.


Slide 1 of 6
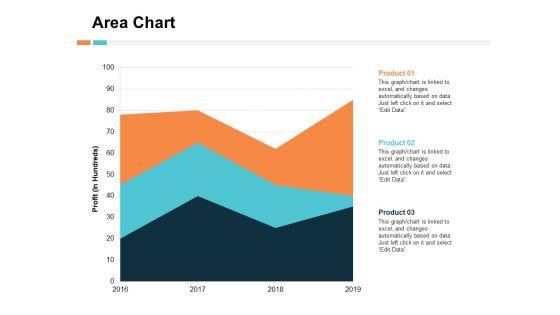
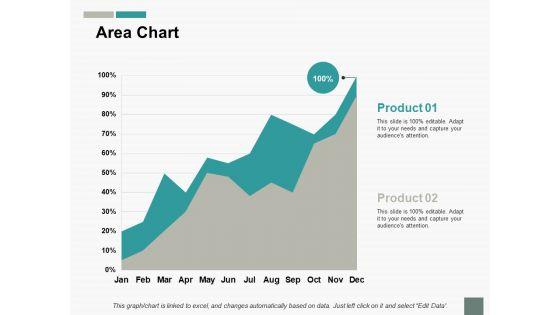
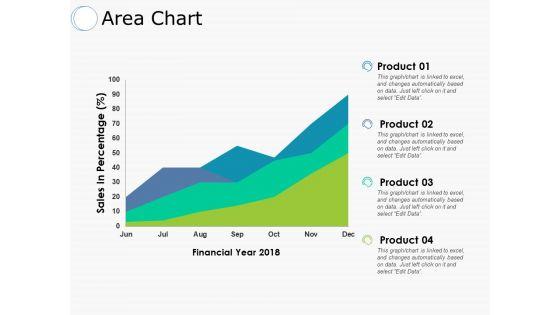
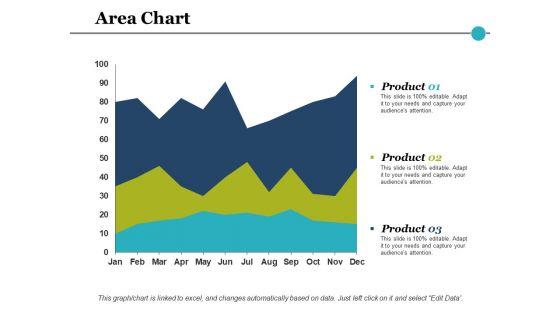
Presenting this set of slides with name area chart financial year ppt powerpoint presentation styles mockup. The topics discussed in these slides are finance, marketing, management, investment, analysis. This is a completely editable PowerPoint presentation and is available for immediate download. Download now and impress your audience.


Slide 1 of 6
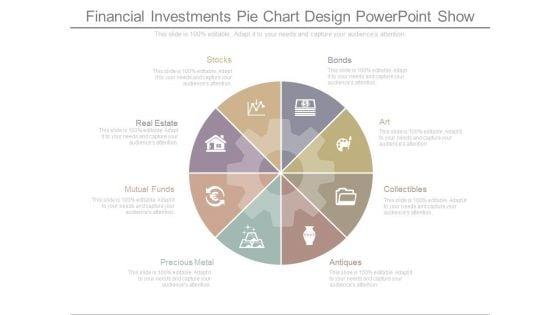
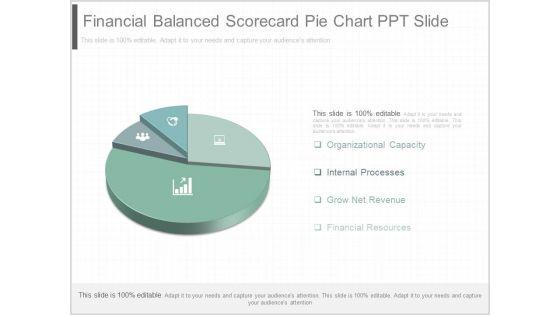
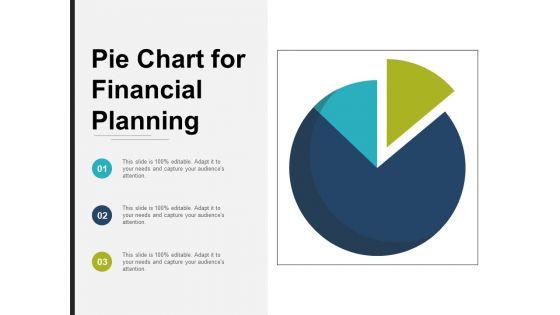
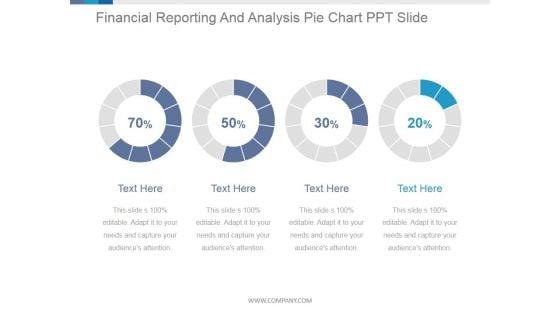
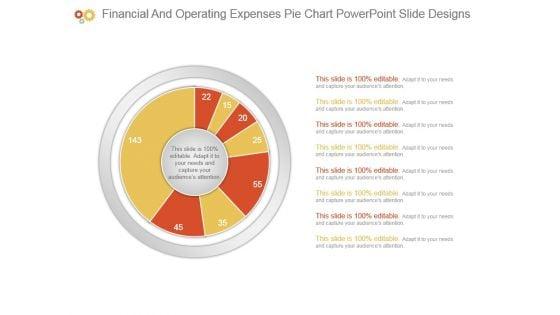
Presenting this set of slides with name pie chart for financial planning and distribution ppt powerpoint presentation file deck. The topics discussed in these slides are pie chart, finance, donut chart. This is a completely editable PowerPoint presentation and is available for immediate download. Download now and impress your audience.


Slide 1 of 6
This is a financial success arrow on bar chart ppt powerpoint presentation ideas display. This is a four stage process. The stages in this process are rising arrow, growing arrow, increasing arrow.


Slide 1 of 6
This is a financial waterfall chart for data visualization ppt powerpoint presentation ideas elements. This is a five stage process. The stages in this process are sales waterfall, waterfall chart, business.


Slide 1 of 6
This is a scatter chart financial ppt powerpoint presentation model deck. This is a one stage process. The stages in this process are business, management, marketing, percentage, product.


Slide 1 of 6
This is a financial charts and graphs for statistical analysis ppt powerpoint presentation show layout. This is a four stage process. The stages in this process are business metrics, business kpi, business dashboard.


Slide 1 of 6
This is a bar chart with magnifying glass for financial analysis ppt powerpoint presentation infographics designs download. This is a three stage process. The stages in this process are business metrics, business kpi, business dashboard.


Slide 1 of 6
This is a column chart financial ppt powerpoint presentation information. This is a three stage process. The stages in this process are business, management, marketing, percentage, product.


Slide 1 of 6
This is a area chart financial ppt powerpoint presentation outline information. This is a three stage process. The stages in this process are percentage, product, business, management, marketing.


Slide 1 of 5
This is a financial chart analysis ppt powerpoint presentation icon vector cpb. This is a four stage process. The stages in this process are financial chart analysis.


Slide 1 of 5
This is a financial charts data analysis vector icon ppt powerpoint presentation visual aids summary cpb. This is a three stage process. The stages in this process are data analysis, analytics architecture, analytics framework.


Slide 1 of 5
This is a area chart financial ppt powerpoint presentation styles templates. This is a two stage process. The stages in this process are finance, marketing, management, investment, analysis.


Slide 1 of 5
This is a donut chart financial investment ppt powerpoint presentation inspiration introduction. This is a five stage process. The stages in this process are finance, marketing, management, investment, analysis.


Slide 1 of 5
This is a clustered bar financial chart ppt powerpoint presentation file design ideas. This is a three stage process. The stages in this process are column chart, financial, business, marketing, planning, strategy.


Slide 1 of 5
This is a column chart financial ppt powerpoint presentation outline design templates. This is a two stage process. The stages in this process are financial, business, marketing, planning, strategy.


Slide 1 of 5
This is a combo chart financial ppt powerpoint presentation layouts layouts. This is a three stage process. The stages in this process are finance, marketing, management, investment, analysis.


Slide 1 of 5
This is a pie chart for financial planning ppt powerpoint presentation professional aids. This is a three stage process. The stages in this process are sectioned circle, segmented circle, partitioned circle.


Slide 1 of 5
This is a area chart financial ppt powerpoint presentation model background. This is a two stage process. The stages in this process are finance, marketing, management, investment, analysis.


Slide 1 of 5
This is a area chart financial ppt powerpoint presentation outline professional. This is a four stage process. The stages in this process are product, sales in percentage, financial year.


Slide 1 of 5
This is a area chart financial ppt powerpoint presentation inspiration topics. This is a three stage process. The stages in this process are finance, marketing, management, investment, analysis.


Slide 1 of 5
This is a area chart financial ppt powerpoint presentation layouts slide. This is a three stage process. The stages in this process are finance, marketing, management, investment, analysis.


Slide 1 of 5
This is a bar chart financial ppt powerpoint presentation pictures files. This is a five stage process. The stages in this process are finance, marketing, management, investment, analysis.


Slide 1 of 5
This is a financial chart ppt powerpoint presentation outline show. This is three stage process. The stages in this process are financial, minimum, medium, maximum.


Slide 1 of 5
This is a area chart financial chart ppt powerpoint presentation design ideas. This is two stage process. The stages in this process are finance, marketing, business, strategy, area chart.


Slide 1 of 5
This is a circular chart financial analysis team management ppt powerpoint presentation guide. This is a four stage process. The stages in this process are puzzle, teamwork, business, marketing, analysis.


Slide 1 of 5
This is a financial comparison chart ppt powerpoint presentation styles. This is a four stage process. The stage in this process are dollar, business, symbol, finance, management.


Slide 1 of 5
This is a key financials for human resource with graph and pie chart ppt powerpoint presentation ideas. This is a three stage process. The stages in this process are business, strategy, marketing, analysis, donut, growth.


Slide 1 of 5
This is a financial reporting and analysis pie chart ppt powerpoint presentation guidelines. This is a four stage process. The stages in this process are process, percentage, business, marketing, finance.


Slide 1 of 5
This is a financials summary comparison chart powerpoint show. This is a three stage process. The stages in this process are revenue, cost of sales, gross profit, customer acquisition cost, other operating cost expense, operating profit, change in cash, ending cash, employees.


Slide 1 of 5
This PowerPoint template has been designed with graphics of column chart with percentage values. You may use this business slide design for topics like financial analysis and planning. This PPT slide is powerful tool to describe your ideas.


Slide 1 of 5
This PowerPoint template has been designed with financial chart with dollar icon. This PPT slide may be used to display dollar value analysis chart. Download this slide to build unique presentation.


Slide 1 of 4
This is a financial revenue analysis growth chart powerpoint slide deck. This is a nine stage process. The stages in this process are growth, success, business, marketing, bar graph.


Slide 1 of 4
This is a financial and operating expenses pie chart powerpoint slide designs. This is a eight stage process. The stages in this process are business, diagram, marketing, management, presentation.


Slide 1 of 4
This is a progress analysis chart with financial growth ppt example. This is a nine stage process. The stages in this process are chart, years, business, growth, marketing, management.


Slide 1 of 4
This PPT slide contains graphics of puzzle pie chart with team icons. You may use this PowerPoint template to display team strategy and success. Download this professional slide design to deliver amazing presentations.


Slide 1 of 4
This PowerPoint slide contains graphics of note pad with gold coins. This professional slide may be used to display financial planning, report and analysis. Adjust the above diagram in your business presentations to give professional impact.
SHOW
- 60
- 120
- 180
DISPLAYING: 60 of 238 Item(s)
Page