- Sign up
- Sign In
 AI PPT Maker
 Templates
 PPT Bundles
 Design Services
 Business PPTs
 Business Plan
 Management
 Strategy
 Introduction PPT
 Roadmap
 Self Introduction
 Timelines
 Process
 Marketing
 Agenda
 Technology
 Medical
 Startup Business Plan
 Cyber Security
 Dashboards
 SWOT
SWOT Proposals
 Education
 Pitch Deck
 Digital Marketing
 KPIs
KPIs Project Management
 Product Management
 Artificial Intelligence
 Target Market
 Communication
 Supply Chain
 Google Slides
 Research Services
 One Pagers
 All Categories
Financial-statistics PowerPoint Presentation Templates and Google Slides
13 Item(s)


Persuade your audience using this sales resource strategy with financial statistics summary pdf. This PPT design covers four stages, thus making it a great tool to use. It also caters to a variety of topics including sales resource strategy with financial statistics. Download this PPT design now to present a convincing pitch that not only emphasizes the topic but also showcases your presentation skills.
Persuade your audience using this financial statistics of business with main growth findings and recommendations ppt powerpoint presentation gallery template pdf. This PPT design covers three stages, thus making it a great tool to use. It also caters to a variety of topics including financial statistics of business with main growth findings and recommendations. Download this PPT design now to present a convincing pitch that not only emphasizes the topic but also showcases your presentation skills.
Presenting this set of slides with name industry financial statistics ppt powerpoint presentation model graphics cpb. This is an editable Powerpoint four stages graphic that deals with topics like industry financial statistics to help convey your message better graphically. This product is a premium product available for immediate download and is 100 percent editable in Powerpoint. Download this now and use it in your presentations to impress your audience.
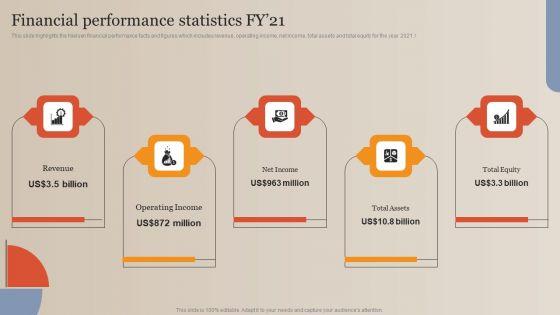


This slide highlights the Nielsen financial performance facts and figures which includes revenue, operating income, net income, total assets and total equity for the year 2021. Do you know about Slidesgeeks Market Study Company Outline Financial Performance Statistics FY 21 Summary PDF. These are perfect for delivering any kind od presentation. Using it, create PowerPoint presentations that communicate your ideas and engage audiences. Save time and effort by using our pre designed presentation templates that are perfect for a wide range of topic. Our vast selection of designs covers a range of styles, from creative to business, and are all highly customizable and easy to edit. Download as a PowerPoint template or use them as Google Slides themes.

This slide highlights the Nielsen financial performance facts and figures which includes revenue, operating income, net income, total assets and total equity for the year 2021. Do you have to make sure that everyone on your team knows about any specific topic I yes, then you should give Nielsen Business Profile Financial Performance Statistics Fy21 Ppt PowerPoint Presentation Diagram PDF a try. Our experts have put a lot of knowledge and effort into creating this impeccable Nielsen Business Profile Financial Performance Statistics Fy21 Ppt PowerPoint Presentation Diagram PDF. You can use this template for your upcoming presentations, as the slides are perfect to represent even the tiniest detail. You can download these templates from the Slidegeeks website and these are easy to edit. So grab these today.
This slide focuses on future expansion plans of interior designing company which includes service diversification, engage with target audience, geographic expansion, etc.Deliver an awe inspiring pitch with this creative Home Decoration Company Profile Key Financial Statistics Portrait PDF bundle. Topics like Utilization Rate, Operating Profit, Customer Retention can be discussed with this completely editable template. It is available for immediate download depending on the needs and requirements of the user.
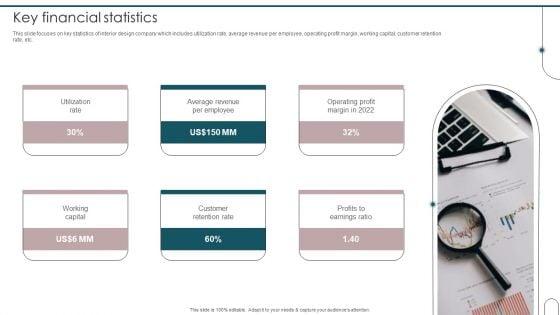
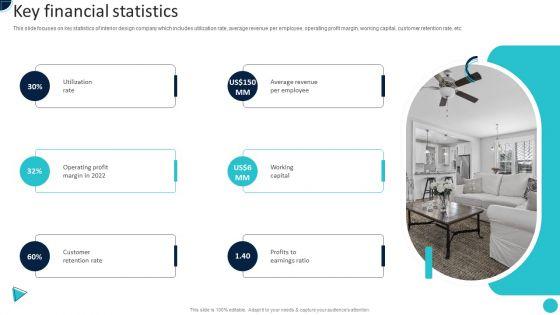
This slide focuses on key statistics of interior design company which includes utilization rate, average revenue per employee, operating profit margin, working capital, customer retention rate, etc. This is a Home Interior Design And Decoration Company Profile Key Financial Statistics Themes PDF template with various stages. Focus and dispense information on one stages using this creative set, that comes with editable features. It contains large content boxes to add your information on topics like Utilization Rate, Average Revenue, Per Employee. You can also showcase facts, figures, and other relevant content using this PPT layout. Grab it now.

This slide focuses on key statistics of interior design company which includes utilization rate, average revenue per employee, operating profit margin, working capital, customer retention rate, etc. Presenting Interior Design Company Outline Key Financial Statistics Ppt PowerPoint Presentation Gallery Information PDF to provide visual cues and insights. Share and navigate important information on one stages that need your due attention. This template can be used to pitch topics like Revenue Per Employee, Operating Profit Margin, Customer Retention Rate. In addtion, this PPT design contains high resolution images, graphics, etc, that are easily editable and available for immediate download.

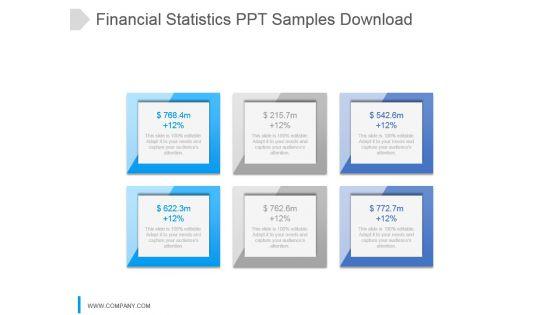
This slide focuses on key statistics of interior design company which includes utilization rate, average revenue per employee, operating profit margin, working capital, customer retention rate, etc.This is a Home Interior Styling Services Company Profile Key Financial Statistics Infographics PDF template with various stages. Focus and dispense information on six stages using this creative set, that comes with editable features. It contains large content boxes to add your information on topics like Revenue Per, Working Capital, Customer Retention. You can also showcase facts, figures, and other relevant content using this PPT layout. Grab it now.
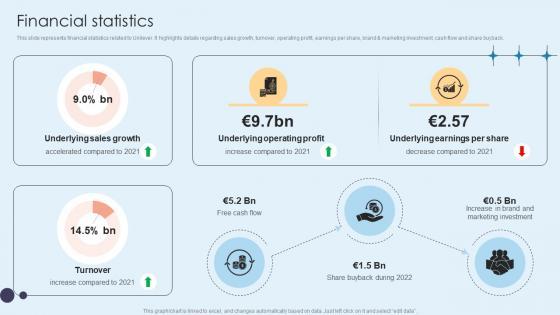
This slide represents financial statistics related to Unilever. It highlights details regarding sales growth, turnover, operating profit, earnings per share, brand and marketing investment, cash flow and share buyback.Formulating a presentation can take up a lot of effort and time, so the content and message should always be the primary focus. The visuals of the PowerPoint can enhance the presenters message, so our Financial Statistics Home Care Solutions Company Profile CP SS V was created to help save time. Instead of worrying about the design, the presenter can concentrate on the message while our designers work on creating the ideal templates for whatever situation is needed. Slidegeeks has experts for everything from amazing designs to valuable content, we have put everything into Financial Statistics Home Care Solutions Company Profile CP SS V. This slide represents financial statistics related to Unilever. It highlights details regarding sales growth, turnover, operating profit, earnings per share, brand and marketing investment, cash flow and share buyback.

This slide provides a glimpse of industry overview of the insurance agency. The purpose of this slide is concerning with the overview of insurance, its growth, demand and its forecasting in the market. From laying roadmaps to briefing everything in detail, our templates are perfect for you. You can set the stage with your presentation slides. All you have to do is download these easy-to-edit and customizable templates. Insurance Firm Start Up Financial Market Statistics For Understanding Insurance Agency Business Template Pdf will help you deliver an outstanding performance that everyone would remember and praise you for. Do download this presentation today. This slide provides a glimpse of industry overview of the insurance agency. The purpose of this slide is concerning with the overview of insurance, its growth, demand and its forecasting in the market.

This slide highlights the Nielsen financial performance facts and figures which includes revenue, operating income, net income, total assets and total equity for the year 2021. Coming up with a presentation necessitates that the majority of the effort goes into the content and the message you intend to convey. The visuals of a PowerPoint presentation can only be effective if it supplements and supports the story that is being told. Keeping this in mind our experts created Data And Customer Analysis Company Outline Financial Performance Statistics FY21 Professional PDF to reduce the time that goes into designing the presentation. This way, you can concentrate on the message while our designers take care of providing you with the right template for the situation.
13 Item(s)