- Sign up
- Sign In
 AI PPT Maker
 Templates
 PPT Bundles
 Design Services
 Business PPTs
 Business Plan
 Management
 Strategy
 Introduction PPT
 Roadmap
 Self Introduction
 Timelines
 Process
 Marketing
 Agenda
 Technology
 Medical
 Startup Business Plan
 Cyber Security
 Dashboards
 SWOT
SWOT Proposals
 Education
 Pitch Deck
 Digital Marketing
 KPIs
KPIs Project Management
 Product Management
 Artificial Intelligence
 Target Market
 Communication
 Supply Chain
 Google Slides
 Research Services
 One Pagers
 All Categories
Data analytic report PowerPoint Presentation Templates and Google Slides
18 Item(s)


This slide shows app marketing analytics dashboard to gauge how well the marketing efforts are performing. It includes parameters like non organic content, organic content attribution,reengegement. Showcasing this set of slides titled Software Application Marketing Data Analytics Report Mockup PDF. The topics addressed in these templates are Software Application, Marketing Data, Analytics Report. All the content presented in this PPT design is completely editable. Download it and make adjustments in color, background, font etc. as per your unique business setting.


This slide illustrates the SAP Analytics Cloud dashboard for financial reporting in terms of net revenue, operating profit, cost of goods sold, profitability trend and net revenue by country. It also provides details of net worth of incoming order and order distribution by country. Coming up with a presentation necessitates that the majority of the effort goes into the content and the message you intend to convey. The visuals of a PowerPoint presentation can only be effective if it supplements and supports the story that is being told. Keeping this in mind our experts created BI Technique For Data Informed Decisions Sap Analytics Cloud Dashboard For Financial Reporting Portrait PDF to reduce the time that goes into designing the presentation. This way, you can concentrate on the message while our designers take care of providing you with the right template for the situation.
Persuade your audience using this data consumption analytics report vector icon ppt powerpoint presentation gallery show pdf. This PPT design covers three stages, thus making it a great tool to use. It also caters to a variety of topics including data consumption analytics report vector icon. Download this PPT design now to present a convincing pitch that not only emphasizes the topic but also showcases your presentation skills.


Deliver an awe-inspiring pitch with this creative business data analytics report with lead to opportunity ratio ppt styles show pdf bundle. Topics like lead conversion ratio, sales team executives, average deal size can be discussed with this completely editable template. It is available for immediate download depending on the needs and requirements of the user.


This slide covers the actions performed to deploy data and analytics monitoring capabilities which focuses on market actions, assets and capabilities, and other considerations. Deliver an awe-inspiring pitch with this creative monitoring and reporting healthcare data and analytics guidelines pdf bundle. Topics like market actions, assets and capabilities, other considerations, data protection framework, social media capabilities can be discussed with this completely editable template. It is available for immediate download depending on the needs and requirements of the user.
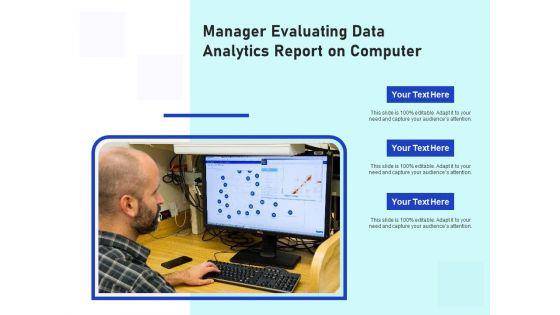

Manager Evaluating Data Analytics Report On Computer Ppt PowerPoint Presentation File Background PDF
Presenting manager evaluating data analytics report on computer ppt powerpoint presentation file background pdf to dispense important information. This template comprises one stages. It also presents valuable insights into the topics including manager evaluating data analytics report on computer. This is a completely customizable PowerPoint theme that can be put to use immediately. So, download it and address the topic impactfully.
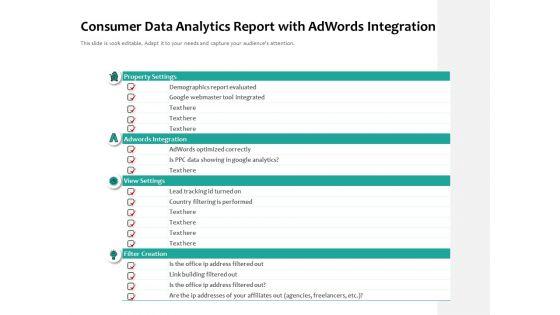
Pitch your topic with ease and precision using this consumer data analytics report with adwords integration ppt powerpoint presentation gallery sample pdf. This layout presents information on property settings, adwords integration, view settings, filter creation. It is also available for immediate download and adjustment. So, changes can be made in the color, design, graphics or any other component to create a unique layout.
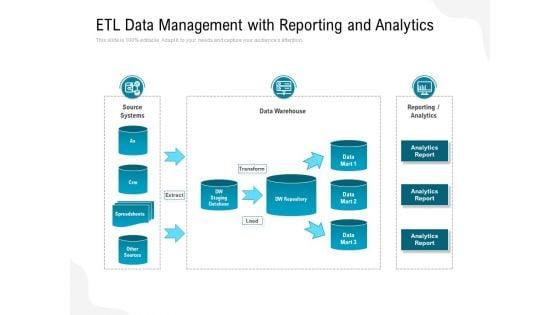
Pitch your topic with ease and precision using this etl data management with reporting and analytics ppt powerpoint presentation gallery slide download pdf. This layout presents information on source systems, data warehouse, analytics. It is also available for immediate download and adjustment. So, changes can be made in the color, design, graphics or any other component to create a unique layout.
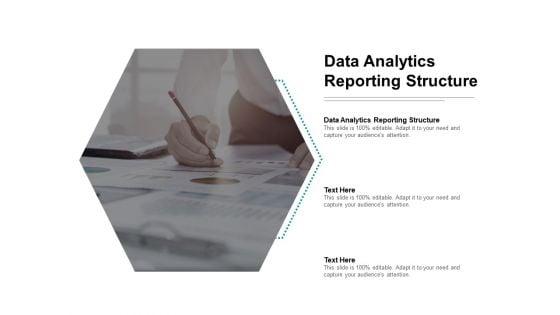
Presenting this set of slides with name data analytics reporting structure ppt powerpoint presentation infographics clipart images cpb pdf. This is an editable Powerpoint one stages graphic that deals with topics like data analysis reporting tools to help convey your message better graphically. This product is a premium product available for immediate download and is 100 percent editable in Powerpoint. Download this now and use it in your presentations to impress your audience.
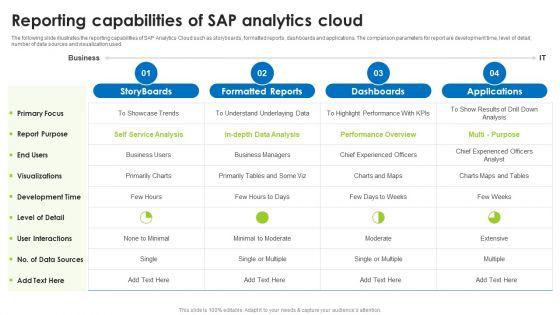


The following slide illustrates the reporting capabilities of SAP Analytics Cloud such as storyboards, formatted reports, dashboards and applications. The comparison parameters for report are development time, level of detail, number of data sources and visualization used. Make sure to capture your audiences attention in your business displays with our gratis customizable BI Technique For Data Informed Decisions Reporting Capabilities Of Sap Analytics Cloud Demonstration PDF. These are great for business strategies, office conferences, capital raising or task suggestions. If you desire to acquire more customers for your tech business and ensure they stay satisfied, create your own sales presentation with these plain slides.

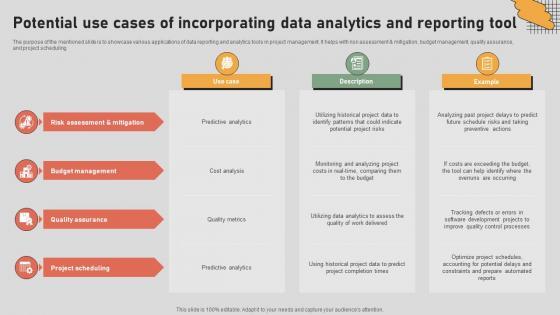
The purpose of the mentioned slide is to showcase various applications of data reporting and analytics tools in project management. It helps with risk assessment and mitigation, budget management, quality assurance, and project scheduling. The Digital Project Management Strategies Potential Use Cases Of Incorporating Data Analytics And Reporting is a compilation of the most recent design trends as a series of slides. It is suitable for any subject or industry presentation, containing attractive visuals and photo spots for businesses to clearly express their messages. This template contains a variety of slides for the user to input data, such as structures to contrast two elements, bullet points, and slides for written information. Slidegeeks is prepared to create an impression. The purpose of the mentioned slide is to showcase various applications of data reporting and analytics tools in project management. It helps with risk assessment and mitigation, budget management, quality assurance, and project scheduling.
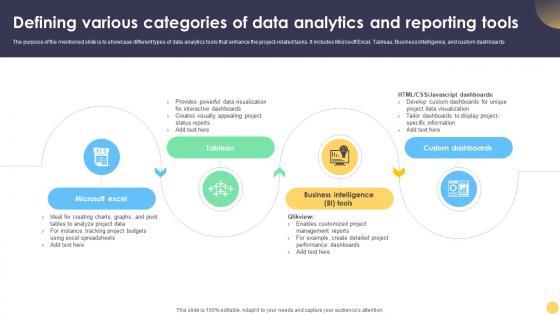
The purpose of the mentioned slide is to showcase different types of data analytics tools that enhance the project-related tasks. It includes Microsoft Excel, Tableau, Business Intelligence, and custom dashboards. Slidegeeks is here to make your presentations a breeze with Digital Project Management Strategies Defining Various Categories Of Data Analytics And Reporting With our easy-to-use and customizable templates, you can focus on delivering your ideas rather than worrying about formatting. With a variety of designs to choose from, you are sure to find one that suits your needs. And with animations and unique photos, illustrations, and fonts, you can make your presentation pop. So whether you are giving a sales pitch or presenting to the board, make sure to check out Slidegeeks first The purpose of the mentioned slide is to showcase different types of data analytics tools that enhance the project-related tasks. It includes Microsoft Excel, Tableau, Business Intelligence, and custom dashboards.
The purpose of the mentioned slide is to showcase various applications of data reporting and analytics tools in project management. It helps with risk assessment and mitigation, budget management, quality assurance, and project scheduling. Presenting this PowerPoint presentation, titled The Digital Project Managers Potential Use Cases Of Incorporating Data Analytics And Reporting, with topics curated by our researchers after extensive research. This editable presentation is available for immediate download and provides attractive features when used. Download now and captivate your audience. Presenting this The Digital Project Managers Potential Use Cases Of Incorporating Data Analytics And Reporting. Our researchers have carefully researched and created these slides with all aspects taken into consideration. This is a completely customizable The Digital Project Managers Potential Use Cases Of Incorporating Data Analytics And Reporting that is available for immediate downloading. Download now and make an impact on your audience. Highlight the attractive features available with our PPTs. The purpose of the mentioned slide is to showcase various applications of data reporting and analytics tools in project management. It helps with risk assessment and mitigation, budget management, quality assurance, and project scheduling.

The purpose of the mentioned slide is to showcase different types of data analytics tools that enhance the project-related tasks. It includes Microsoft Excel, Tableau, Business Intelligence, and custom dashboards. If your project calls for a presentation, then Slidegeeks is your go-to partner because we have professionally designed, easy-to-edit templates that are perfect for any presentation. After downloading, you can easily edit The Digital Project Managers Defining Various Categories Of Data Analytics And Reporting Tools and make the changes accordingly. You can rearrange slides or fill them with different images. Check out all the handy templates The purpose of the mentioned slide is to showcase different types of data analytics tools that enhance the project-related tasks. It includes Microsoft Excel, Tableau, Business Intelligence, and custom dashboards.

The purpose of the mentioned slide is to showcase various applications of data reporting and analytics tools in project management. It helps with risk assessment and mitigation, budget management, quality assurance, and project scheduling. Are you searching for a Potential Use Cases Of Incorporating Data Analytics And Reporting Tool Strategies For Success In Digital that is uncluttered, straightforward, and original Its easy to edit, and you can change the colors to suit your personal or business branding. For a presentation that expresses how much effort you have put in, this template is ideal With all of its features, including tables, diagrams, statistics, and lists, its perfect for a business plan presentation. Make your ideas more appealing with these professional slides. Download Potential Use Cases Of Incorporating Data Analytics And Reporting Tool Strategies For Success In Digital from Slidegeeks today. The purpose of the mentioned slide is to showcase various applications of data reporting and analytics tools in project management. It helps with risk assessment and mitigation, budget management, quality assurance, and project scheduling.
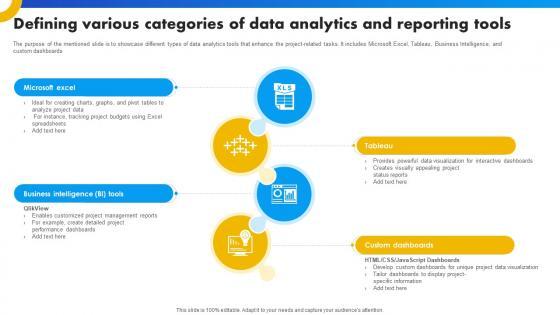
The purpose of the mentioned slide is to showcase different types of data analytics tools that enhance the project-related tasks. It includes Microsoft Excel, Tableau, Business Intelligence, and custom dashboards. Slidegeeks is here to make your presentations a breeze with Defining Various Categories Of Data Analytics And Reporting Tools Strategies For Success In Digital With our easy-to-use and customizable templates, you can focus on delivering your ideas rather than worrying about formatting. With a variety of designs to choose from, you are sure to find one that suits your needs. And with animations and unique photos, illustrations, and fonts, you can make your presentation pop. So whether you are giving a sales pitch or presenting to the board, make sure to check out Slidegeeks first The purpose of the mentioned slide is to showcase different types of data analytics tools that enhance the project-related tasks. It includes Microsoft Excel, Tableau, Business Intelligence, and custom dashboards.
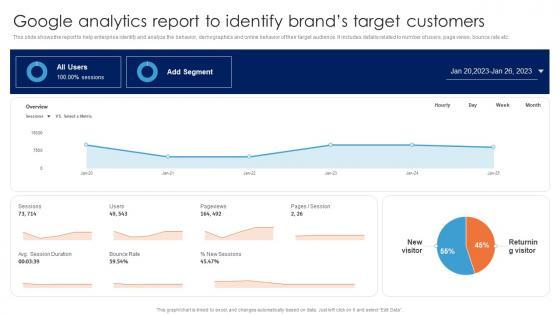

This slide shows the report to help enterprise identify and analyze the behavior, demographics and online behavior of their target audience. It includes details related to number of users, page views, bounce rate etc.Slidegeeks is one of the best resources for PowerPoint templates. You can download easily and regulate Google Analytics Report To Identify Brands Guide For Data Driven Advertising Infographics Pdf for your personal presentations from our wonderful collection. A few clicks is all it takes to discover and get the most relevant and appropriate templates. Use our Templates to add a unique zing and appeal to your presentation and meetings. All the slides are easy to edit and you can use them even for advertisement purposes. This slide shows the report to help enterprise identify and analyze the behavior, demographics and online behavior of their target audience. It includes details related to number of users, page views, bounce rate etc.
18 Item(s)