- Sign up
- Sign In
 AI PPT Maker
 Templates
 PPT Bundles
 Design Services
 Business PPTs
 Business Plan
 Management
 Strategy
 Introduction PPT
 Roadmap
 Self Introduction
 Timelines
 Process
 Marketing
 Agenda
 Technology
 Medical
 Startup Business Plan
 Cyber Security
 Dashboards
 SWOT
SWOT Proposals
 Education
 Pitch Deck
 Digital Marketing
 KPIs
KPIs Project Management
 Product Management
 Artificial Intelligence
 Target Market
 Communication
 Supply Chain
 Google Slides
 Research Services
 One Pagers
 All Categories
Compared year PowerPoint Presentation Templates and Google Slides
28 Item(s)


Improve your presentation delivery using this 5 Years Comparative Analysis Chart Ppt PowerPoint Presentation Complete Deck With Slides. Support your business vision and objectives using this well-structured PPT deck. This template offers a great starting point for delivering beautifully designed presentations on the topic of your choice. Comprising twenty slides this professionally designed template is all you need to host discussion and meetings with collaborators. Each slide is self-explanatory and equipped with high-quality graphics that can be adjusted to your needs. Therefore, you will face no difficulty in portraying your desired content using this PPT slideshow. This PowerPoint slideshow contains every important element that you need for a great pitch. It is not only editable but also available for immediate download and utilization. The color, font size, background, shapes everything can be modified to create your unique presentation layout. Therefore, download it now.
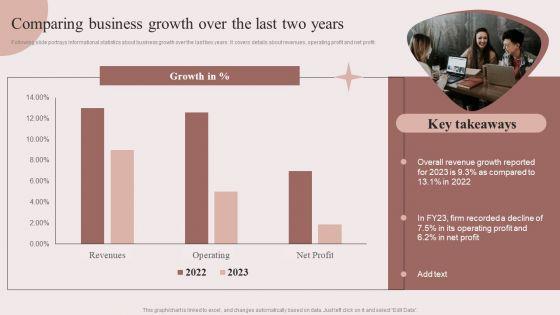
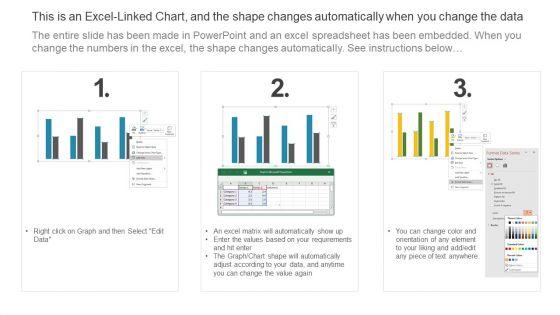
Following slide portrays informational statistics about business growth over the last two years. It covers details about revenues, operating profit and net profit.Do you have to make sure that everyone on your team knows about any specific topic I yes, then you should give Enhancing Retail Process By Effective Inventory Management Comparing Business Growth Over The Last Two Years Rules PDF a try. Our experts have put a lot of knowledge and effort into creating this impeccable Enhancing Retail Process By Effective Inventory Management Comparing Business Growth Over The Last Two Years Rules PDF. You can use this template for your upcoming presentations, as the slides are perfect to represent even the tiniest detail. You can download these templates from the Slidegeeks website and these are easy to edit. So grab these today.
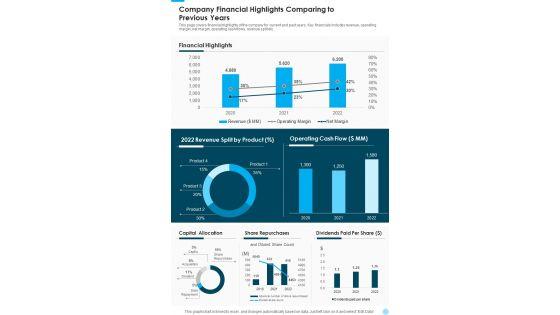
This page covers financial highlights of the company for current and past years. Key financials includes revenue, operating margin, net margin, operating cash flows, revenue split etc. Presenting you a fantastic Company Financial Highlights Comparing To Previous Years One Pager Documents. This piece is crafted on hours of research and professional design efforts to ensure you have the best resource. It is completely editable and its design allow you to rehash its elements to suit your needs. Get this Company Financial Highlights Comparing To Previous Years One Pager Documents A4 One-pager now.
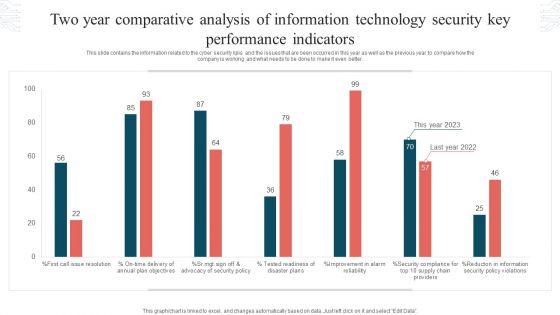

This slide contains the information related to the cyber security kpis and the issues that are been occurred in this year as well as the previous year to compare how the company is working and what needs to be done to make it even better. Showcasing this set of slides titled Two Year Comparative Analysis Of Information Technology Security Key Performance Indicators Graphics PDF. The topics addressed in these templates are Tested Readiness, Disaster Plans, Security Policy Violations. All the content presented in this PPT design is completely editable. Download it and make adjustments in color, background, font etc. as per your unique business setting.

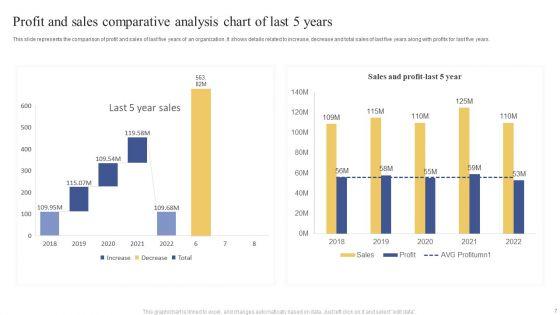
This slide represents the comparison of profit and sales of last five years of an organization. It shows details related to increase, decrease and total sales of last five years along with profits for last five years. Showcasing this set of slides titled Profit And Sales Comparative Analysis Chart Of Last 5 Years Ppt Visual Aids Example 2015 PDF. The topics addressed in these templates are Last 5 Year, Sales, 2018 To 2022. All the content presented in this PPT design is completely editable. Download it and make adjustments in color, background, font etc. as per your unique business setting.


Planning Sales Campaign To Improve Comparing Sales Target Versus Last Year Achievements Graphics PDF
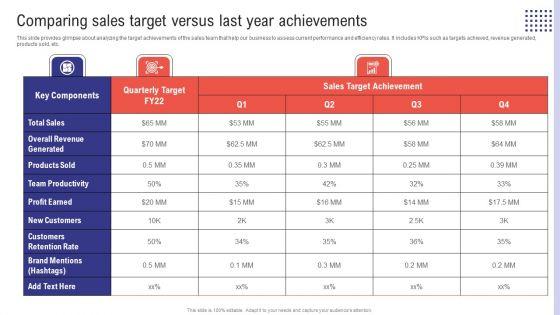
This slide provides glimpse about analyzing the target achievements of the sales team that help our business to assess current performance and efficiency rates. It includes KPIs such as targets achieved, revenue generated, products sold, etc. Do you have an important presentation coming up Are you looking for something that will make your presentation stand out from the rest Look no further than Planning Sales Campaign To Improve Comparing Sales Target Versus Last Year Achievements Graphics PDF. With our professional designs, you can trust that your presentation will pop and make delivering it a smooth process. And with Slidegeeks, you can trust that your presentation will be unique and memorable. So why wait Grab Planning Sales Campaign To Improve Comparing Sales Target Versus Last Year Achievements Graphics PDF today and make your presentation stand out from the rest.

This slide shows business financial plan for two years to track progress in business. It include various parameters such as gross revenue, gross profit, profit before taxes and net profit etc. Persuade your audience using this Comparative Financial Business Forecast For Two Years Topics PDF. This PPT design covers one stage, thus making it a great tool to use. It also caters to a variety of topics including Sales General And Administration, Profit Before Taxes. Download this PPT design now to present a convincing pitch that not only emphasizes the topic but also showcases your presentation skills.
This slide covers turnover rates for staff in an organisation. It further includes number of employees left the organisation for year 2020 and 2021 with percentage of headcounts. Showcasing this set of slides titled Two Year Comparative Report For Staff Attrition Tracking With Headcount Rates Formats PDF. The topics addressed in these templates are Resources, Environment And Housing, Social Services. All the content presented in this PPT design is completely editable. Download it and make adjustments in color, background, font etc. as per your unique business setting.

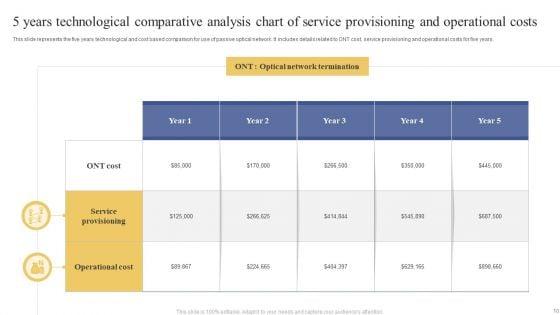
This slide represents the five years technological and cost based comparison for use of passive optical network. It includes details related to ONT cost, service provisioning and operational costs for five years. Pitch your topic with ease and precision using this 5 Years Technological Comparative Analysis Chart Of Service Provisioning And Operational Costs Information PDF. This layout presents information on Optical Network Termination, Service Provisioning, Operational Cost. It is also available for immediate download and adjustment. So, changes can be made in the color, design, graphics or any other component to create a unique layout.
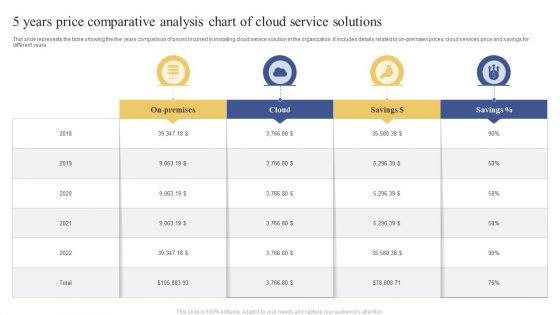
This slide represents the table showing the five years comparison of prices incurred in installing cloud service solution in the organization. It includes details related to on-premises prices, cloud services price and savings for different years. Showcasing this set of slides titled 5 Years Price Comparative Analysis Chart Of Cloud Service Solutions Brochure PDF. The topics addressed in these templates are Cloud, Savings, 2018 To 2022. All the content presented in this PPT design is completely editable. Download it and make adjustments in color, background, font etc. as per your unique business setting.

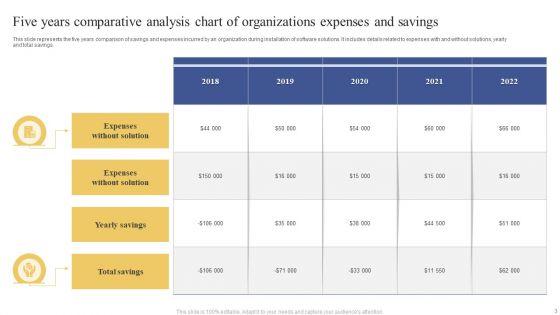
This slide represents the five years comparison of savings and expenses incurred by an organization during installation of software solutions. It includes details related to expenses with and without solutions, yearly and total savings. Showcasing this set of slides titled Five Years Comparative Analysis Chart Of Organizations Expenses And Savings Topics PDF. The topics addressed in these templates are Expenses Without Solution, Yearly Savings, Total Savings. All the content presented in this PPT design is completely editable. Download it and make adjustments in color, background, font etc. as per your unique business setting.
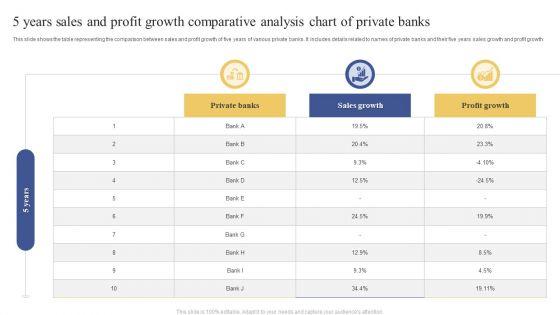
This slide shows the table representing the comparison between sales and profit growth of five years of various private banks. It includes details related to names of private banks and their five years sales growth and profit growth. Pitch your topic with ease and precision using this 5 Years Sales And Profit Growth Comparative Analysis Chart Of Private Banks Infographics PDF. This layout presents information on Private Banks, Sales Growth, Profit Growth. It is also available for immediate download and adjustment. So, changes can be made in the color, design, graphics or any other component to create a unique layout.

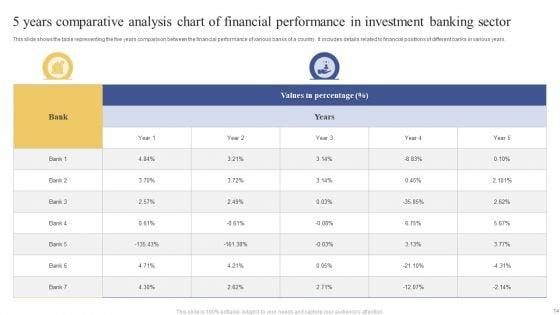
This slide shows the table representing the five years comparison between the financial performance of various banks of a country. It includes details related to financial positions of different banks in various years. Showcasing this set of slides titled 5 Years Comparative Analysis Chart Of Financial Performance In Investment Banking Sector Themes PDF. The topics addressed in these templates are Values Percentage, Bank, Year. All the content presented in this PPT design is completely editable. Download it and make adjustments in color, background, font etc. as per your unique business setting.
Presenting 5 Years Revenue Comparative Analysis Chart Icon Ppt Inspiration Diagrams PDF to dispense important information. This template comprises three stages. It also presents valuable insights into the topics including 5 Years, Revenue Comparative, Analysis Chart, Icon. This is a completely customizable PowerPoint theme that can be put to use immediately. So, download it and address the topic impactfully.
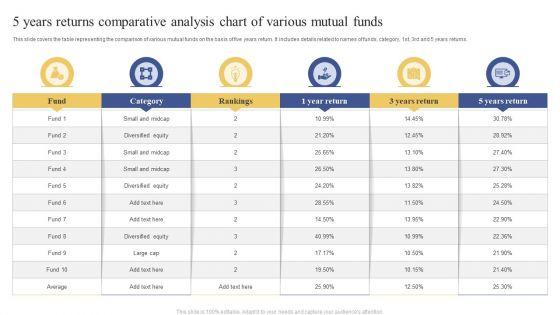
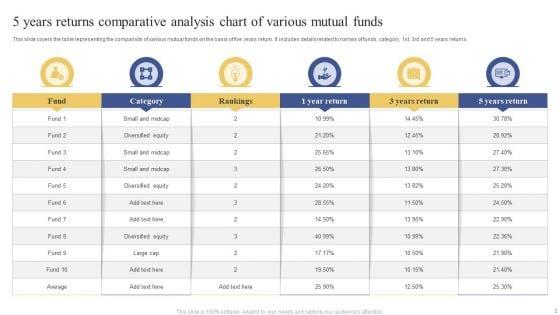
This slide covers the table representing the comparison of various mutual funds on the basis of five years return. It includes details related to names of funds, category, 1st, 3rd and 5 years returns. Showcasing this set of slides titled 5 Years Returns Comparative Analysis Chart Of Various Mutual Funds Ppt Slides Microsoft PDF. The topics addressed in these templates are Diversified Equity, Small And Midcap, Diversified Equity. All the content presented in this PPT design is completely editable. Download it and make adjustments in color, background, font etc. as per your unique business setting.
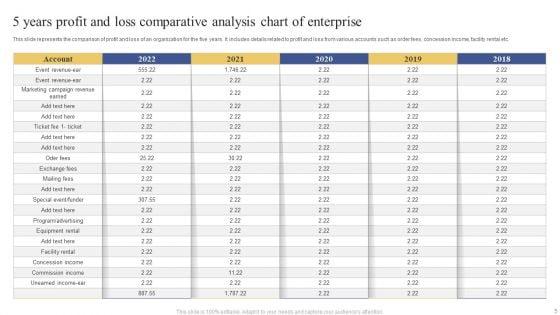
This slide represents the comparison of profit and loss of an organization for the five years. It includes details related to profit and loss from various accounts such as order fees, concession income, facility rental etc. Pitch your topic with ease and precision using this 5 Years Profit And Loss Comparative Analysis Chart Of Enterprise Ppt Icon Graphics PDF. This layout presents information on Account, 2018 To 2022, Exchange Fees. It is also available for immediate download and adjustment. So, changes can be made in the color, design, graphics or any other component to create a unique layout.

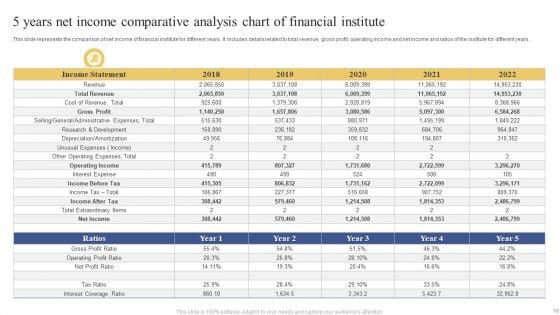
This slide represents the comparison of net income of financial institute for different years. It includes details related to total revenue, gross profit, operating income and net income and ratios of the institute for different years. Showcasing this set of slides titled 5 Years Net Income Comparative Analysis Chart Of Financial Institute Ppt Show Designs PDF. The topics addressed in these templates are Income Statement, 2018 To 2022, Ratios. All the content presented in this PPT design is completely editable. Download it and make adjustments in color, background, font etc. as per your unique business setting.
Persuade your audience using this 5 Years Mutual Funds Performance Comparative Analysis Chart Icon Ppt Show Gridlines PDF. This PPT design covers three stages, thus making it a great tool to use. It also caters to a variety of topics including 5 Years, Mutual Funds, Performance Comparative, Analysis, Chart Icon. Download this PPT design now to present a convincing pitch that not only emphasizes the topic but also showcases your presentation skills.
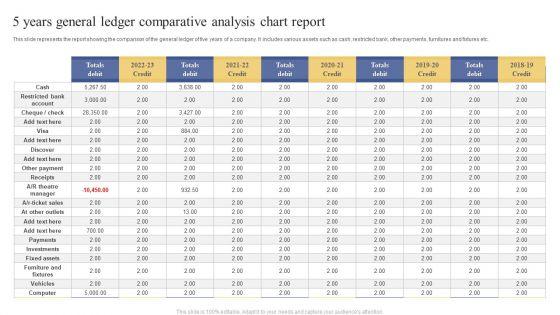
This slide represents the report showing the comparison of the general ledger of five years of a company. It includes various assets such as cash, restricted bank, other payments, furnitures and fixtures etc. Showcasing this set of slides titled 5 Years General Ledger Comparative Analysis Chart Report Ppt Model Slide PDF. The topics addressed in these templates are Other Payment, Investments, Fixed Assets. All the content presented in this PPT design is completely editable. Download it and make adjustments in color, background, font etc. as per your unique business setting.
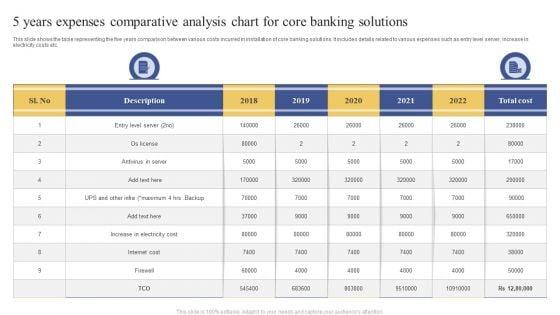
This slide shows the table representing the five years comparison between various costs incurred in installation of core banking solutions. It includes details related to various expenses such as entry level server, increase in electricity costs etc. Pitch your topic with ease and precision using this 5 Years Expenses Comparative Analysis Chart For Core Banking Solutions Ppt Portfolio Clipart Images PDF. This layout presents information on Entry Level Server, Antivirus Server, Increase Electricity Cost. It is also available for immediate download and adjustment. So, changes can be made in the color, design, graphics or any other component to create a unique layout.
Presenting 5 Years Employee Performance Comparative Analysis Chart Icon Ppt Portfolio Objects PDF to dispense important information. This template comprises three stages. It also presents valuable insights into the topics including 5 Years, Employee Performance, Comparative Analysis, Chart Icon. This is a completely customizable PowerPoint theme that can be put to use immediately. So, download it and address the topic impactfully.

5 Years Comparative Analysis Chart Of Liquidity Ratios Of IT Companies Ppt Portfolio Visual Aids PDF
This slide represents the table showing comparison between current and quick ratios of two IT companies over five years. It includes details related to current and quick ratios for both companies for different years along with the average of their five years ratios. Pitch your topic with ease and precision using this 5 Years Comparative Analysis Chart Of Liquidity Ratios Of IT Companies Ppt Portfolio Visual Aids PDF. This layout presents information on Current Ratio, Average, 2018 To 2022. It is also available for immediate download and adjustment. So, changes can be made in the color, design, graphics or any other component to create a unique layout.

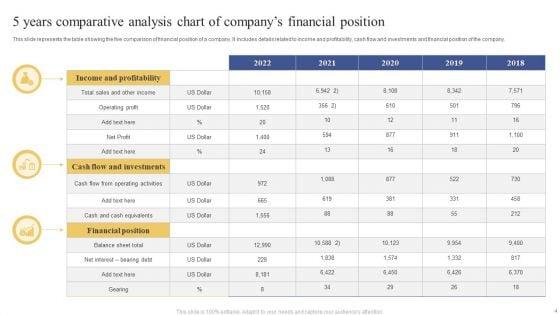
This slide represents the table showing the five comparison of financial position of a company. It includes details related to income and profitability, cash flow and investments and financial position of the company. Showcasing this set of slides titled 5 Years Comparative Analysis Chart Of Companys Financial Position Ppt Layouts Structure PDF. The topics addressed in these templates are Income And Profitability, Financial Position, Balance Sheet Total. All the content presented in this PPT design is completely editable. Download it and make adjustments in color, background, font etc. as per your unique business setting.
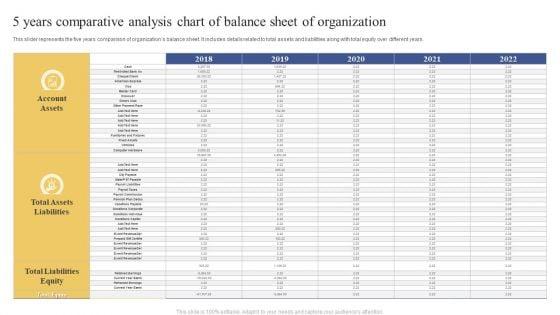
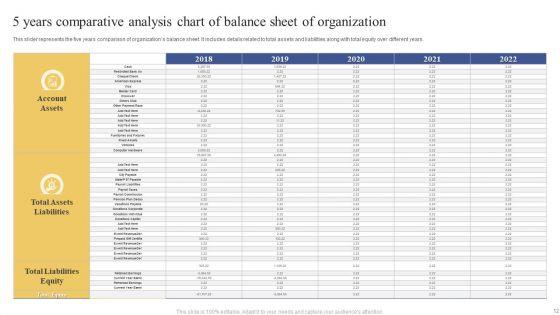
This slider represents the five years comparison of organizations balance sheet. It includes details related to total assets and liabilities along with total equity over different years. Pitch your topic with ease and precision using this 5 Years Comparative Analysis Chart Of Balance Sheet Of Organization Ppt Inspiration Slide PDF. This layout presents information on Account Assets, Total Assets Liabilities, Total Liabilities Equity. It is also available for immediate download and adjustment. So, changes can be made in the color, design, graphics or any other component to create a unique layout.
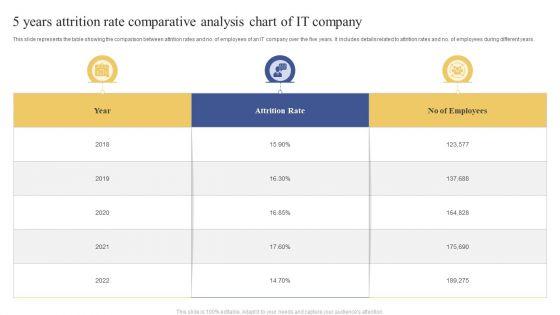
This slide represents the table showing the comparison between attrition rates and no. of employees of an IT company over the five years. It includes details related to attrition rates and no. of employees during different years. Showcasing this set of slides titled 5 Years Attrition Rate Comparative Analysis Chart Of IT Company Ppt Layouts Examples PDF. The topics addressed in these templates are Attrition Rate, No Employees, 2018 To 2022. All the content presented in this PPT design is completely editable. Download it and make adjustments in color, background, font etc. as per your unique business setting.
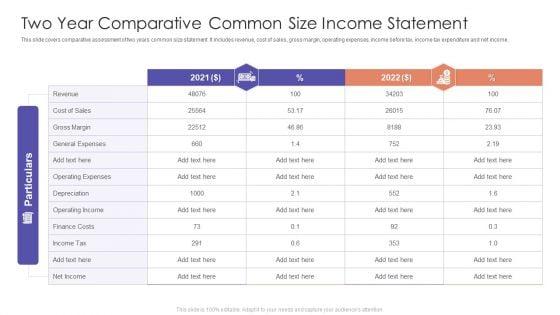
This slide covers comparative assessment of two years common size statement. It includes revenue, cost of sales, gross margin, operating expenses, income before tax, income tax expenditure and net income. Showcasing this set of slides titled Two Year Comparative Common Size Income Statement Ppt PowerPoint Presentation Gallery Skills PDF. The topics addressed in these templates are Cost Sales, Revenue, Operating Expenses. All the content presented in this PPT design is completely editable. Download it and make adjustments in color, background, font etc. as per your unique business setting.
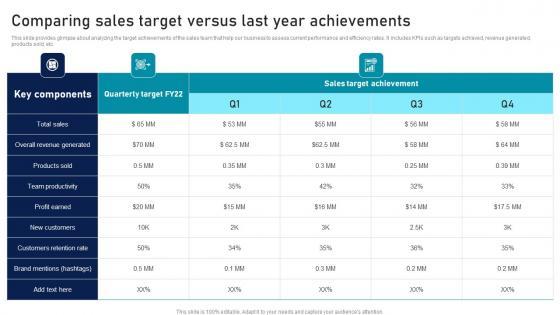
This slide provides glimpse about analyzing the target achievements of the sales team that help our business to assess current performance and efficiency rates. It includes KPIs such as targets achieved, revenue generated, products sold, etc. Slidegeeks is here to make your presentations a breeze with Comparing Sales Target Versus Last Year Strategic Sales Plan To Enhance Infographics Pdf With our easy-to-use and customizable templates, you can focus on delivering your ideas rather than worrying about formatting. With a variety of designs to choose from, you are sure to find one that suits your needs. And with animations and unique photos, illustrations, and fonts, you can make your presentation pop. So whether you are giving a sales pitch or presenting to the board, make sure to check out Slidegeeks first. This slide provides glimpse about analyzing the target achievements of the sales team that help our business to assess current performance and efficiency rates. It includes KPIs such as targets achieved, revenue generated, products sold, etc.

This slide provides glimpse about analyzing the target achievements of the sales team that help our business to assess current performance and efficiency rates. It includes KPIs such as targets achieved, revenue generated, products sold, etc. Slidegeeks is here to make your presentations a breeze with Enhance Customer Retention Comparing Sales Target Versus Last Year Achievements Graphics Pdf With our easy-to-use and customizable templates, you can focus on delivering your ideas rather than worrying about formatting. With a variety of designs to choose from, you are sure to find one that suits your needs. And with animations and unique photos, illustrations, and fonts, you can make your presentation pop. So whether you are giving a sales pitch or presenting to the board, make sure to check out Slidegeeks first. This slide provides glimpse about analyzing the target achievements of the sales team that help our business to assess current performance and efficiency rates. It includes KPIs such as targets achieved, revenue generated, products sold, etc.
28 Item(s)