- Sign up
- Sign In
 AI PPT Maker
 Templates
 PPT Bundles
 Design Services
 Business PPTs
 Business Plan
 Management
 Strategy
 Introduction PPT
 Roadmap
 Self Introduction
 Timelines
 Process
 Marketing
 Agenda
 Technology
 Medical
 Startup Business Plan
 Cyber Security
 Dashboards
 SWOT
SWOT Proposals
 Education
 Pitch Deck
 Digital Marketing
 KPIs
KPIs Project Management
 Product Management
 Artificial Intelligence
 Target Market
 Communication
 Supply Chain
 Google Slides
 Research Services
 One Pagers
 All Categories
Business revenue dashboard PowerPoint Presentation Templates and Google Slides
45 Item(s)


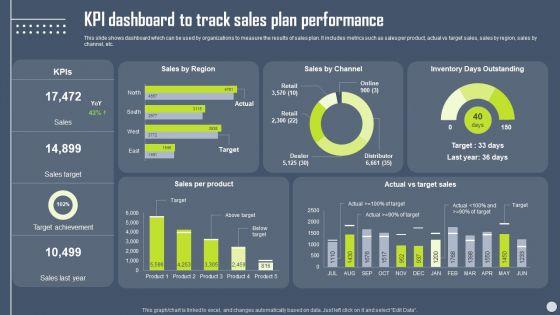
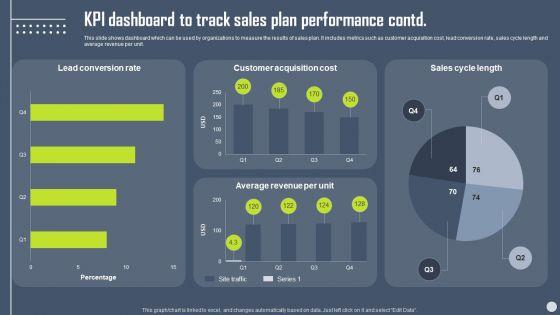
This slide shows dashboard which can be used by organizations to measure the results of sales plan. It includes metrics such as sales per product, actual vs target sales, sales by region, sales by channel, etc. Boost your pitch with our creative Boosting Yearly Business Revenue KPI Dashboard To Track Sales Plan Performance Topics PDF. Deliver an awe-inspiring pitch that will mesmerize everyone. Using these presentation templates you will surely catch everyones attention. You can browse the ppts collection on our website. We have researchers who are experts at creating the right content for the templates. So you dont have to invest time in any additional work. Just grab the template now and use them.
This slide shows the KPI dashboard of the catering industry to evaluate the actual and potential targets. It includes KPIs such as expenditure, sales revenue, beverage, etc. Showcasing this set of slides titled Catering Business Advertisement Plan KPI Dashboard With Revenue Comparison Icons PDF. The topics addressed in these templates are Expenditure, Revenue Comparison, Department. All the content presented in this PPT design is completely editable. Download it and make adjustments in color, background, font etc. as per your unique business setting.
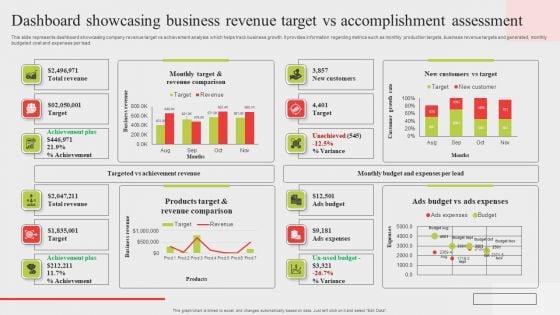

This slide represents dashboard showcasing company revenue target vs achievement analysis which helps track business growth. It provides information regarding metrics such as monthly production targets, business revenue targets and generated, monthly budgeted cost and expenses per lead. Showcasing this set of slides titled Dashboard Showcasing Business Revenue Target Vs Accomplishment Assessment Information PDF. The topics addressed in these templates are Total Revenue, Target, Achievement. All the content presented in this PPT design is completely editable. Download it and make adjustments in color, background, font etc. as per your unique business setting.


The following slide display a business performance dashboard that highlights the average revenue per unit, customer Acquisition Cost and profit earned. This Periodic Revenue Model Business Performance Dashboard Rules PDF from Slidegeeks makes it easy to present information on your topic with precision. It provides customization options, so you can make changes to the colors, design, graphics, or any other component to create a unique layout. It is also available for immediate download, so you can begin using it right away. Slidegeeks has done good research to ensure that you have everything you need to make your presentation stand out. Make a name out there for a brilliant performance.
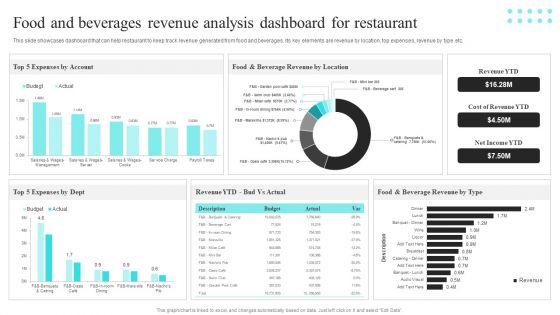
This slide showcases dashboard that can help restaurant to keep track revenue generated from food and beverages. Its key elements are revenue by location, top expenses, revenue by type etc. This Strategic Promotional Guide For Restaurant Business Advertising Food And Beverages Revenue Analysis Dashboard Template PDF from Slidegeeks makes it easy to present information on your topic with precision. It provides customization options, so you can make changes to the colors, design, graphics, or any other component to create a unique layout. It is also available for immediate download, so you can begin using it right away. Slidegeeks has done good research to ensure that you have everything you need to make your presentation stand out. Make a name out there for a brilliant performance.

The following slide display a business performance dashboard that highlights the average revenue per unit, customer Acquisition Cost and profit earned. There are so many reasons you need a Membership Based Revenue Plan Business Performance Dashboard Ideas PDF. The first reason is you cant spend time making everything from scratch, Thus, Slidegeeks has made presentation templates for you too. You can easily download these templates from our website easily.
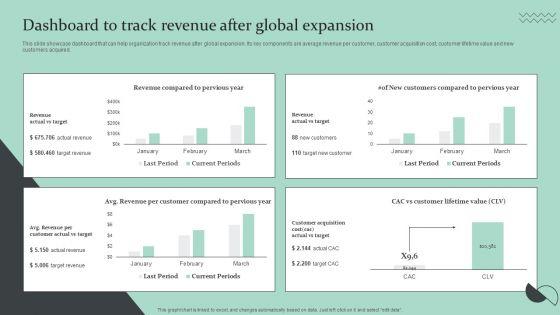

This slide showcase dashboard that can help organization track revenue after global expansion. Its key components are average revenue per customer, customer acquisition cost, customer lifetime value and new customers acquired. Here you can discover an assortment of the finest PowerPoint and Google Slides templates. With these templates, you can create presentations for a variety of purposes while simultaneously providing your audience with an eye catching visual experience. Download Strategic Global Expansion Business Plan Dashboard To Track Revenue After Global Expansion Topics PDF to deliver an impeccable presentation. These templates will make your job of preparing presentations much quicker, yet still, maintain a high level of quality. Slidegeeks has experienced researchers who prepare these templates and write high quality content for you. Later on, you can personalize the content by editing the Strategic Global Expansion Business Plan Dashboard To Track Revenue After Global Expansion Topics PDF.
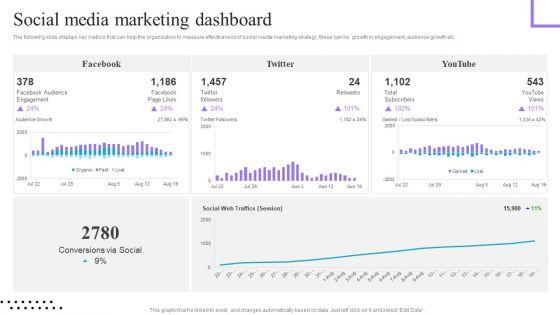
The following slide displays key metrics that can help the organization to measure effectiveness of social media marketing strategy, these can be growth in engagement, audience growth etc.. Present like a pro with Content And Permission Marketing Tactics For Enhancing Business Revenues Social Media Marketing Dashboard Download PDF Create beautiful presentations together with your team, using our easy-to-use presentation slides. Share your ideas in real-time and make changes on the fly by downloading our templates. So whether you are in the office, on the go, or in a remote location, you can stay in sync with your team and present your ideas with confidence. With Slidegeeks presentation got a whole lot easier. Grab these presentations today.
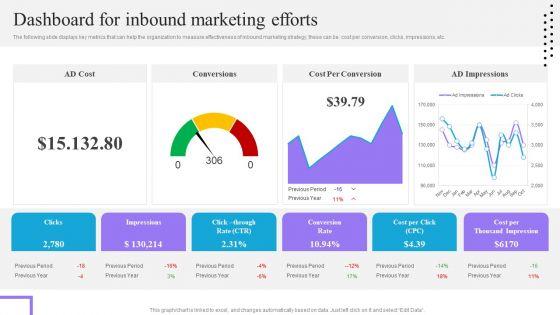
The following slide displays key metrics that can help the organization to measure effectiveness of inbound marketing strategy, these can be cost per conversion, clicks, impressions, etc. This modern and well-arranged Content And Permission Marketing Tactics For Enhancing Business Revenues Dashboard For Inbound Marketing Efforts Wd Demonstration PDF provides lots of creative possibilities. It is very simple to customize and edit with the Powerpoint Software. Just drag and drop your pictures into the shapes. All facets of this template can be edited with Powerpoint no extra software is necessary. Add your own material, put your images in the places assigned for them, adjust the colors, and then you can show your slides to the world, with an animated slide included.
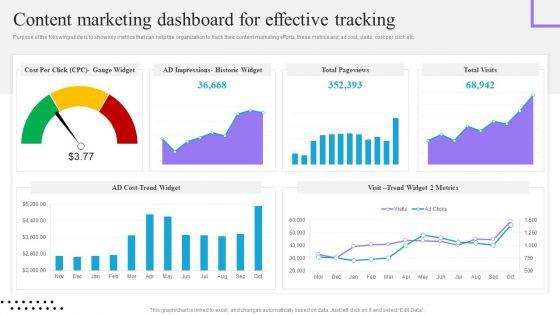

Purpose of the following slide is to show key metrics that can help the organization to track their content marketing efforts, these metrics are ad cost, visits, cost per click etc. Slidegeeks is here to make your presentations a breeze with Content And Permission Marketing Tactics For Enhancing Business Revenues Content Marketing Dashboard Topics PDF With our easy-to-use and customizable templates, you can focus on delivering your ideas rather than worrying about formatting. With a variety of designs to choose from, you are sure to find one that suits your needs. And with animations and unique photos, illustrations, and fonts, you can make your presentation pop. So whether you are giving a sales pitch or presenting to the board, make sure to check out Slidegeeks first
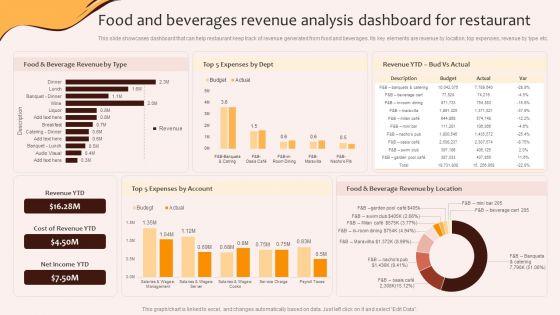

This slide showcases dashboard that can help restaurant keep track of revenue generated from food and beverages. Its key elements are revenue by location, top expenses, revenue by type etc.The best PPT templates are a great way to save time, energy, and resources. Slidegeeks have 100precent editable powerpoint slides making them incredibly versatile. With these quality presentation templates, you can create a captivating and memorable presentation by combining visually appealing slides and effectively communicating your message. Download Digital Marketing Plan For Restaurant Business Food And Beverages Revenue Analysis Dashboard Template PDF from Slidegeeks and deliver a wonderful presentation.


The following slide outlines key performance indicator KPI dashboard showcasing various financial metrics of the organization. The key metrics are gross revenue, product revenue, service revenue, gross profit, net profit etc. Formulating a presentation can take up a lot of effort and time, so the content and message should always be the primary focus. The visuals of the PowerPoint can enhance the presenters message, so our Estimating Business Overall Kpi Metrics Dashboard Highlighting Organization Revenue Clipart PDF was created to help save time. Instead of worrying about the design, the presenter can concentrate on the message while our designers work on creating the ideal templates for whatever situation is needed. Slidegeeks has experts for everything from amazing designs to valuable content, we have put everything into Estimating Business Overall Kpi Metrics Dashboard Highlighting Organization Revenue Clipart PDF.
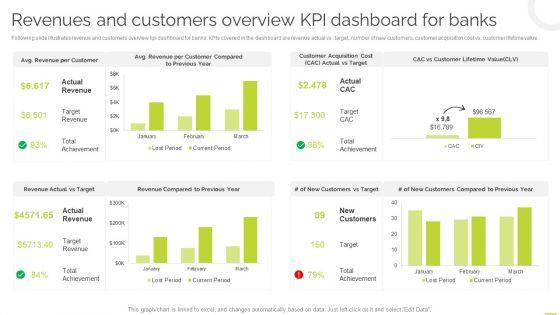

Following slide illustrates revenue and customers overview kpi dashboard for banks. KPIs covered in the dashboard are revenue actual vs target, number of new customers, customer acquisition cost vs. customer lifetime value. This Effective BPM Tool For Business Process Management Revenues And Customers Overview KPI Dashboard For Banks Elements PDF is perfect for any presentation, be it in front of clients or colleagues. It is a versatile and stylish solution for organizing your meetings. The Effective BPM Tool For Business Process Management Revenues And Customers Overview KPI Dashboard For Banks Elements PDF features a modern design for your presentation meetings. The adjustable and customizable slides provide unlimited possibilities for acing up your presentation. Slidegeeks has done all the homework before launching the product for you. So, do not wait, grab the presentation templates today.
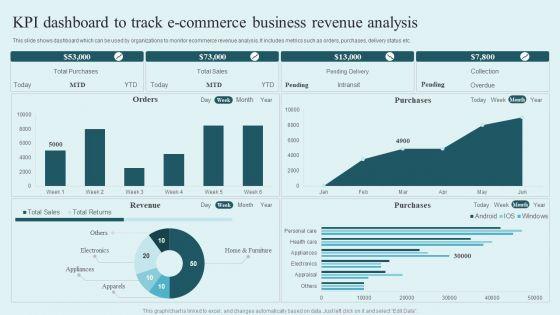
This slide shows dashboard which can be used by organizations to monitor ecommerce revenue analysis. It includes metrics such as orders, purchases, delivery status etc. Pitch your topic with ease and precision using this KPI Dashboard To Track E Commerce Business Revenue Analysis Rules PDF. This layout presents information on Total Purchases, Total Sales, Pending Delivery, Collection. It is also available for immediate download and adjustment. So, changes can be made in the color, design, graphics or any other component to create a unique layout.
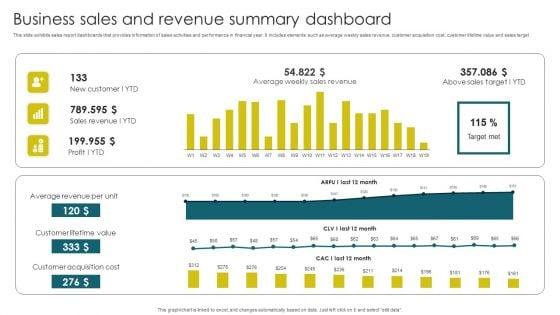

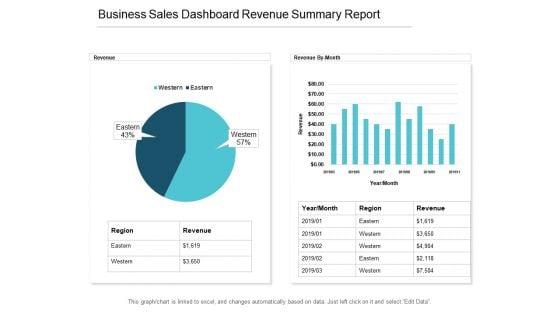
This slide exhibits sales report dashboards that provides information of sales activities and performance in financial year. It includes elements such as average weekly sales revenue, customer acquisition cost, customer lifetime value and sales target. Pitch your topic with ease and precision using this Business Sales And Revenue Summary Dashboard Brochure PDF. This layout presents information on Average Revenue, Customer Lifetime, Customer Acquisition. It is also available for immediate download and adjustment. So, changes can be made in the color, design, graphics or any other component to create a unique layout.
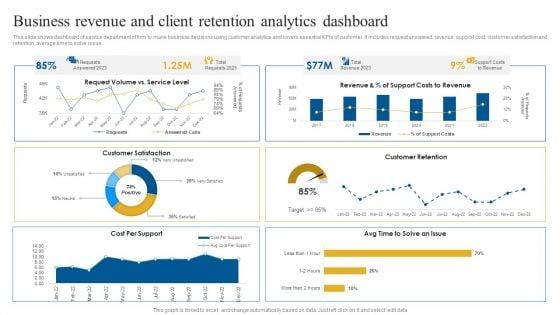
This slide shows dashboard of service department of firm to make business decisions using customer analytics and covers essential KPIs of customer. It includes request answered, revenue, support cost, customer satisfaction and retention, average time to solve issue. Showcasing this set of slides titled Business Revenue And Client Retention Analytics Dashboard Brochure PDF. The topics addressed in these templates are Customer Satisfaction, Customer Retention, Revenue. All the content presented in this PPT design is completely editable. Download it and make adjustments in color, background, font etc. as per your unique business setting.
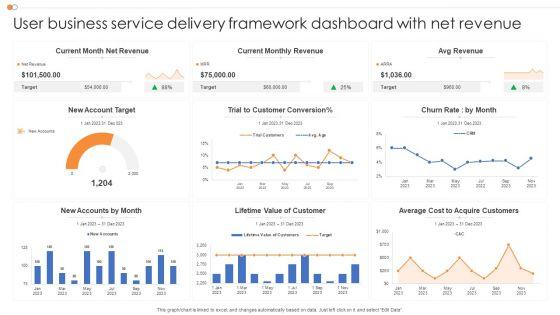

Showcasing this set of slides titled User Business Service Delivery Framework Dashboard With Net Revenue Microsoft PDF. The topics addressed in these templates are Service Delivery, Framework Dashboard, Net Revenue. All the content presented in this PPT design is completely editable. Download it and make adjustments in color, background, font etc. as per your unique business setting.


Pitch your topic with ease and precision using this Customer Business Service Delivery Framework Dashboard With Total Revenue Structure PDF. This layout presents information on Requests Answered, Total Requests, Total Revenue. It is also available for immediate download and adjustment. So, changes can be made in the color, design, graphics or any other component to create a unique layout.
Purpose of the following slide is to show key metrics that can help the organization to track direct marketing efforts, it highlights essential KPIs such as NPS, customer by location etc.This Direct Marketing Dashboard For Tracking Business Revenues Efficient B2B And B2C Marketing Techniques For Organization Elements PDF is perfect for any presentation, be it in front of clients or colleagues. It is a versatile and stylish solution for organizing your meetings. The Direct Marketing Dashboard For Tracking Business Revenues Efficient B2B And B2C Marketing Techniques For Organization Elements PDF features a modern design for your presentation meetings. The adjustable and customizable slides provide unlimited possibilities for acing up your presentation. Slidegeeks has done all the homework before launching the product for you. So, do not wait, grab the presentation templates today.
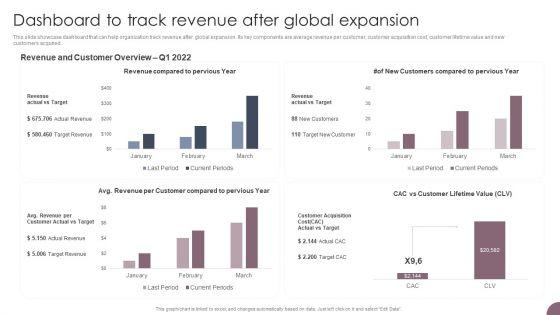

This slide showcase dashboard that can help organization track revenue after global expansion. Its key components are average revenue per customer, customer acquisition cost, customer lifetime value and new customers acquired. Crafting an eye-catching presentation has never been more straightforward. Let your presentation shine with this tasteful yet straightforward International Business Extension Dashboard To Track Revenue After Global Expansion Introduction PDF template. It offers a minimalistic and classy look that is great for making a statement. The colors have been employed intelligently to add a bit of playfulness while still remaining professional. Construct the ideal International Business Extension Dashboard To Track Revenue After Global Expansion Introduction PDF that effortlessly grabs the attention of your audience Begin now and be certain to wow your customers.
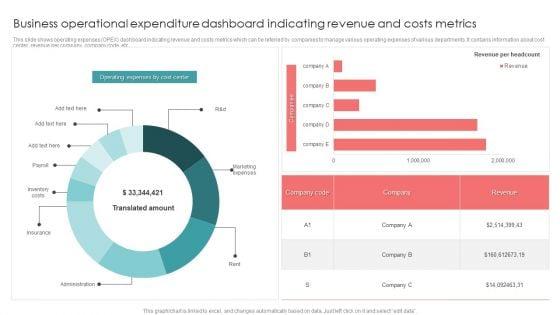

This slide shows operating expenses OPEX dashboard indicating revenue and costs metrics which can be referred by companies to manage various operating expenses of various departments. It contains information about cost center, revenue per company, company code, etc. Pitch your topic with ease and precision using this Business Operational Expenditure Dashboard Indicating Revenue And Costs Metrics Pictures PDF. This layout presents information on Business Operational, Costs Metrics, Revenue. It is also available for immediate download and adjustment. So, changes can be made in the color, design, graphics or any other component to create a unique layout.
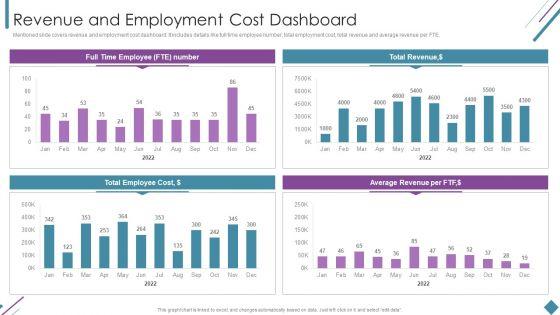

Mentioned slide covers revenue and employment cost dashboard. It includes details like full time employee number, total employment cost, total revenue and average revenue per FTE. Deliver and pitch your topic in the best possible manner with this Metrics To Measure Business Performance Revenue And Employment Cost Dashboard Clipart PDF. Use them to share invaluable insights on Total Revenue, Average Revenue Per, Total Employee Cost and impress your audience. This template can be altered and modified as per your expectations. So, grab it now.

The following slide highlights the business and sales forecasting dashboard illustrating key headings which includes revenue forecast by type, unit sold forecast, forecasting accuracy, sales by type, average sales price trend and revenue trend. Pitch your topic with ease and precision using this business revenue and sales predictive dashboard ppt inspiration background designs pdf. This layout presents information on revenue forecast by type, units sold forecast, forecasting accuracy, average sales price trend, revenue trend. It is also available for immediate download and adjustment. So, changes can be made in the color, design, graphics or any other component to create a unique layout.
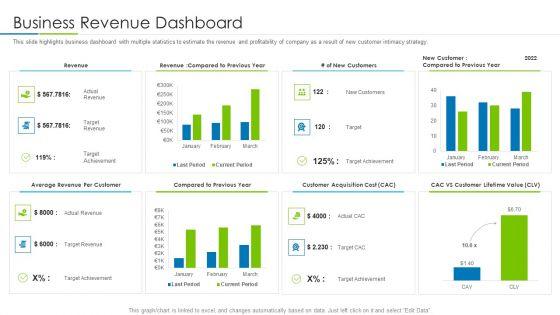

This slide highlights business dashboard with multiple statistics to estimate the revenue and profitability of company as a result of new customer intimacy strategy. Deliver and pitch your topic in the best possible manner with this customer rapport strategy to build loyal client base business revenue dashboard elements pdf. Use them to share invaluable insights on revenue, previous year, customer and impress your audience. This template can be altered and modified as per your expectations. So, grab it now.

This slide highlights business dashboard with multiple statistics to estimate the revenue and profitability of company as a result of new customer intimacy strategy. Deliver an awe inspiring pitch with this creative strategy to enhance buyer intimacy business revenue dashboard ppt designs download pdf bundle. Topics like business revenue dashboard can be discussed with this completely editable template. It is available for immediate download depending on the needs and requirements of the user.


This slide highlights business dashboard with multiple statistics to estimate the revenue and profitability of company as a result of new customer intimacy strategy. Deliver an awe inspiring pitch with this creative tactical procedure for increasing customer intimacy business revenue dashboard diagrams pdf bundle. Topics like average revenue per customer, compared to previous year, customer acquisition cost, cac vs customer lifetime value, revenue can be discussed with this completely editable template. It is available for immediate download depending on the needs and requirements of the user.


Deliver an awe inspiring pitch with this creative business management dashboards revenue ppt layouts gridlines pdf bundle. Topics like revenue, manufacturing, costs, products can be discussed with this completely editable template. It is available for immediate download depending on the needs and requirements of the user.
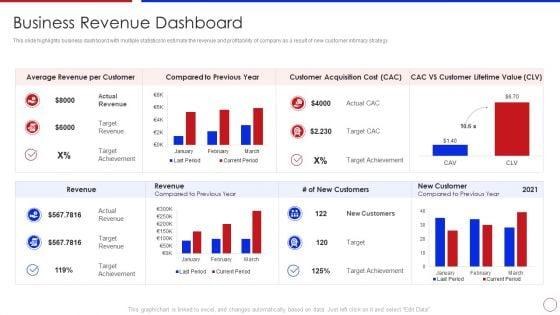
This slide highlights business dashboard with multiple statistics to estimate the revenue and profitability of company as a result of new customer intimacy strategy. Deliver an awe inspiring pitch with this creative customer relationship strategy for building loyalty business revenue dashboard icons pdf bundle. Topics like average revenue per customer, compared to previous year, customer acquisition cost, cac vs customer lifetime value, revenue can be discussed with this completely editable template. It is available for immediate download depending on the needs and requirements of the user.
Deliver and pitch your topic in the best possible manner with this business management dashboards revenue business analysis method ppt inspiration icon pdf. Use them to share invaluable insights on cost, revenue, acquisition, revenue, target and impress your audience. This template can be altered and modified as per your expectations. So, grab it now.


Deliver and pitch your topic in the best possible manner with this business management dashboards revenue designs pdf. Use them to share invaluable insights on revenue and sales, sales by product category and impress your audience. This template can be altered and modified as per your expectations. So, grab it now.


Deliver and pitch your topic in the best possible manner with this corporate regulation business management dashboards revenue ppt model pdf. Use them to share invaluable insights on cost, revenue, acquisition, revenue, target and impress your audience. This template can be altered and modified as per your expectations. So, grab it now.
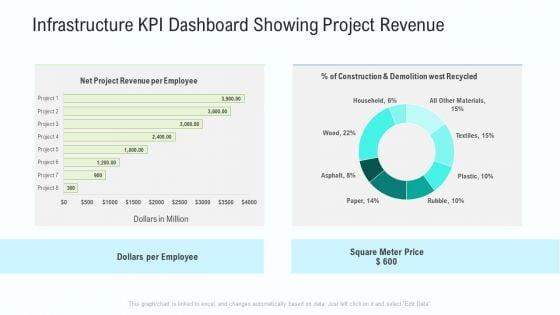
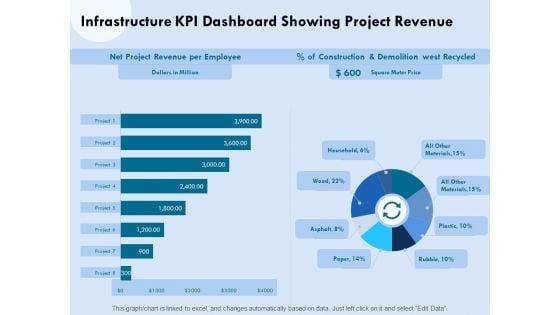
Deliver an awe inspiring pitch with this creative business activities assessment examples infrastructure kpi dashboard showing project revenue infographics pdf bundle. Topics like net project revenue per employee, construction and demolition west recycled, dollars per employee can be discussed with this completely editable template. It is available for immediate download depending on the needs and requirements of the user.


Deliver an awe inspiring pitch with this creative business strategy development process business management dashboards revenue download pdf bundle. Topics like business management dashboards can be discussed with this completely editable template. It is available for immediate download depending on the needs and requirements of the user.

Deliver and pitch your topic in the best possible manner with this administrative regulation business management dashboards revenue ppt powerpoint presentation professional graphics design pdf. Use them to share invaluable insights on out costs, adverts, products, revenue, manufacturing, operations and impress your audience. This template can be altered and modified as per your expectations. So, grab it now.
Showcasing this set of slides titled dashboard for tracking and measuring business sales and revenue ppt powerpoint presentation slides introduction pdf. The topics addressed in these templates are revenue by pipeline jun 2020, new deals by month this year 2020, forecast june 2020, revenue goal attainment by owner jun 2020, revenue goal attainment jun 2020, pipeline coverage jul 2020. All the content presented in this PPT design is completely editable. Download it and make adjustments in color, background, font etc. as per your unique business setting.
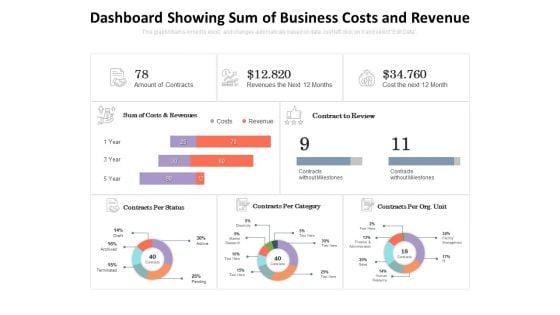
Presenting this set of slides with name dashboard showing sum of business costs and revenue ppt powerpoint presentation inspiration gallery pdf. The topics discussed in these slides are sum of costs and revenues, contract to review, contracts per org unit, contracts per category, contracts per status. This is a completely editable PowerPoint presentation and is available for immediate download. Download now and impress your audience.
Presenting this set of slides with name business dashboard showing total revenue ppt powerpoint presentation visual aids icon pdf. The topics discussed in these slides are total revenue, 22 product types share in total revenue, 6 product lines product types revenue share within product line, profit and quatity running total, product line color key. This is a completely editable PowerPoint presentation and is available for immediate download. Download now and impress your audience.
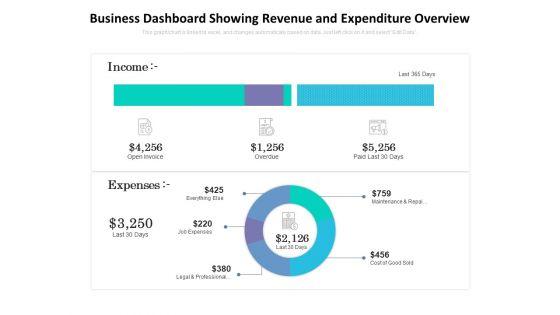

Presenting this set of slides with name business dashboard showing revenue and expenditure overview ppt powerpoint presentation infographics templates pdf. The topics discussed in these slides are income, expenses, open invoice, cost good sold, maintenance and repai, paid last 30 days. This is a completely editable PowerPoint presentation and is available for immediate download. Download now and impress your audience.

Presenting this set of slides with name functional analysis of business operations infrastructure kpi dashboard showing project revenue clipart pdf. The topics discussed in these slides are revenue, project, employee, construction, price. This is a completely editable PowerPoint presentation and is available for immediate download. Download now and impress your audience.

Presenting this set of slides with name key features for effective business management infrastructure kpi dashboard showing project revenue ppt ideas file formats pdf. The topics discussed in these slides are construction and demolition west recycled, net project revenue per employee, square meter price, dollars per employee. This is a completely editable PowerPoint presentation and is available for immediate download. Download now and impress your audience.
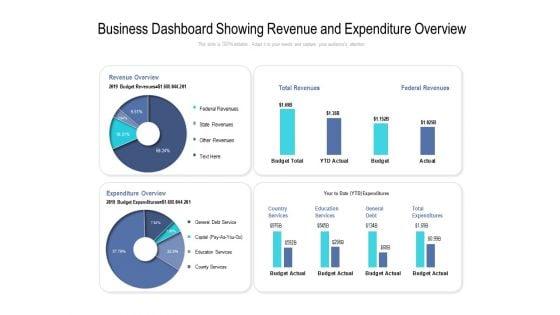
Presenting this set of slides with namebusiness dashboard showing revenue and expenditure overview ppt powerpoint presentation portfolio styles. The topics discussed in these slides are federal revenues, total revenues, country services, education services, general debt, total expenditures, revenue overview, expenditure overview. This is a completely editable PowerPoint presentation and is available for immediate download. Download now and impress your audience.


This slide shows the KPI dashboards of restaurant business revenue generation to generate more leads. It includes KPIs such as total sales, margin,profit, etc. Present like a pro with Revenue Generation Dashboard Of Restaurant Business Create An Effective Restaurant. Create beautiful presentations together with your team, using our easy-to-use presentation slides. Share your ideas in real-time and make changes on the fly by downloading our templates. So whether you are in the office, on the go, or in a remote location, you can stay in sync with your team and present your ideas with confidence. With Slidegeeks presentation got a whole lot easier. Grab these presentations today. This slide shows the KPI dashboards of restaurant business revenue generation to generate more leads. It includes KPIs such as total sales, margin,profit, etc.
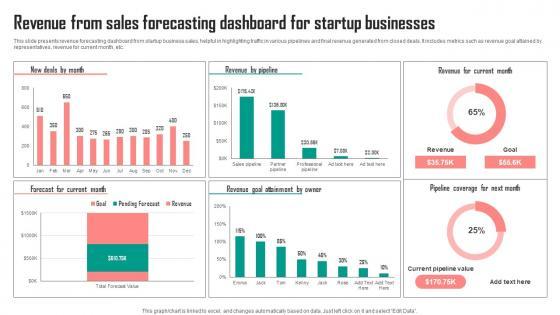

This slide presents revenue forecasting dashboard from startup business sales, helpful in highlighting traffic in various pipelines and final revenue generated from closed deals. It includes metrics such as revenue goal attained by representatives, revenue for current month, etc. Showcasing this set of slides titled Revenue From Sales Forecasting Dashboard For Startup Businesses Graphics Pdf. The topics addressed in these templates are Owner, Current Month, Businesses. All the content presented in this PPT design is completely editable. Download it and make adjustments in color, background, font etc. as per your unique business setting. This slide presents revenue forecasting dashboard from startup business sales, helpful in highlighting traffic in various pipelines and final revenue generated from closed deals. It includes metrics such as revenue goal attained by representatives, revenue for current month, etc.
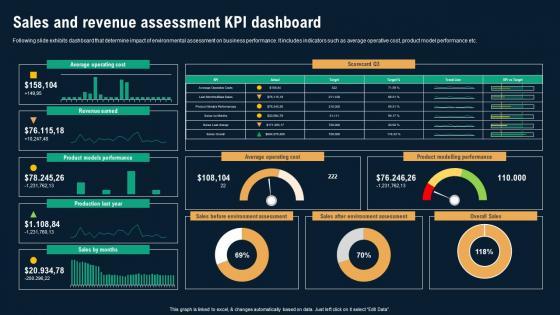
Following slide exhibits dashboard that determine impact of environmental assessment on business performance. It includes indicators such as average operative cost, product model performance etc. There are so many reasons you need a Sales And Revenue Assessment KPI Dashboard Business Environmental Analysis Ideas Pdf The first reason is you can not spend time making everything from scratch, Thus, Slidegeeks has made presentation templates for you too. You can easily download these templates from our website easily. Following slide exhibits dashboard that determine impact of environmental assessment on business performance. It includes indicators such as average operative cost, product model performance etc.
45 Item(s)