- Sign up
- Sign In
 AI PPT Maker
 Templates
 PPT Bundles
 Design Services
 Business PPTs
 Business Plan
 Management
 Strategy
 Introduction PPT
 Roadmap
 Self Introduction
 Timelines
 Process
 Marketing
 Agenda
 Technology
 Medical
 Startup Business Plan
 Cyber Security
 Dashboards
 SWOT
SWOT Proposals
 Education
 Pitch Deck
 Digital Marketing
 KPIs
KPIs Project Management
 Product Management
 Artificial Intelligence
 Target Market
 Communication
 Supply Chain
 Google Slides
 Research Services
 One Pagers
 All Categories
Decision-analysis PowerPoint Presentation Templates and Google Slides
DISPLAYING: 60 of 67 Item(s)
Page


If designing a presentation takes a lot of your time and resources and you are looking for a better alternative, then this Make Or Buy Decision Analysis Ppt PowerPoint Presentation Complete With Slides is the right fit for you. This is a prefabricated set that can help you deliver a great presentation on the topic. All the seventeen slides included in this sample template can be used to present a birds-eye view of the topic. These slides are also fully editable, giving you enough freedom to add specific details to make this layout more suited to your business setting. Apart from the content, all other elements like color, design, theme are also replaceable and editable. This helps in designing a variety of presentations with a single layout. Not only this, you can use this PPT design in formats like PDF, PNG, and JPG once downloaded. Therefore, without any further ado, download and utilize this sample presentation as per your liking.

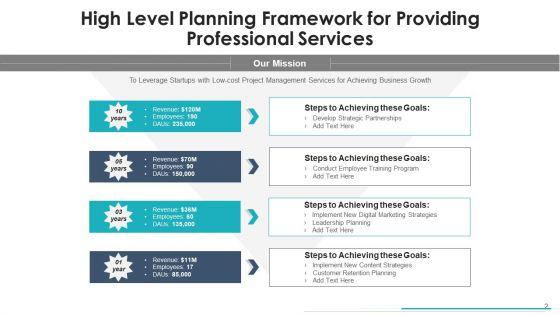

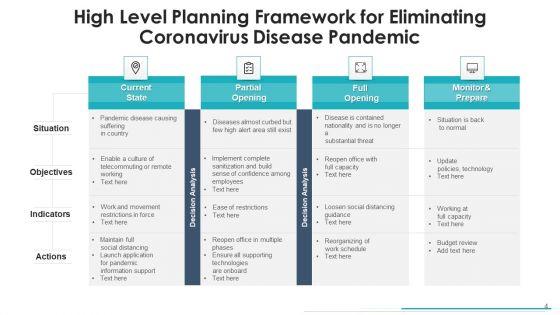

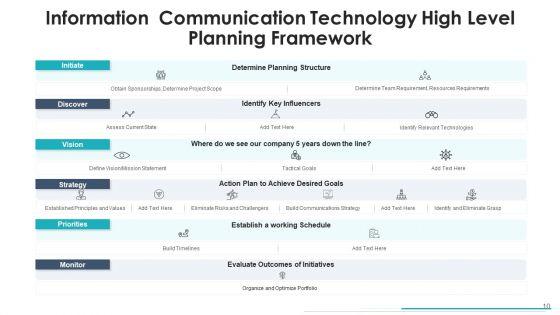
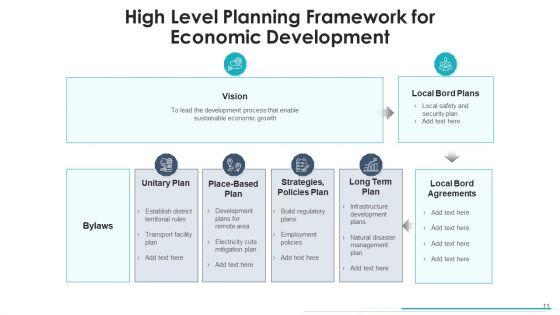

If designing a presentation takes a lot of your time and resources and you are looking for a better alternative, then this top level planning model decision analysis ppt powerpoint presentation complete deck with slides is the right fit for you. This is a prefabricated set that can help you deliver a great presentation on the topic. All the twelve slides included in this sample template can be used to present a birds-eye view of the topic. These slides are also fully editable, giving you enough freedom to add specific details to make this layout more suited to your business setting. Apart from the content, all other elements like color, design, theme are also replaceable and editable. This helps in designing a variety of presentations with a single layout. Not only this, you can use this PPT design in formats like PDF, PNG, and JPG once downloaded. Therefore, without any further ado, download and utilize this sample presentation as per your liking.


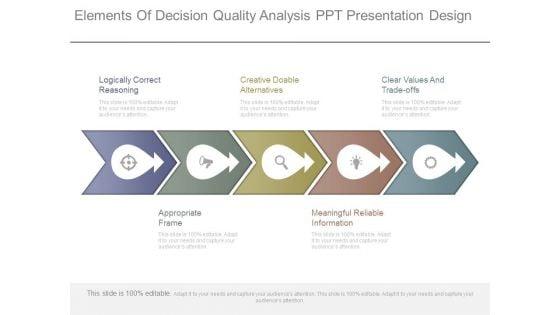


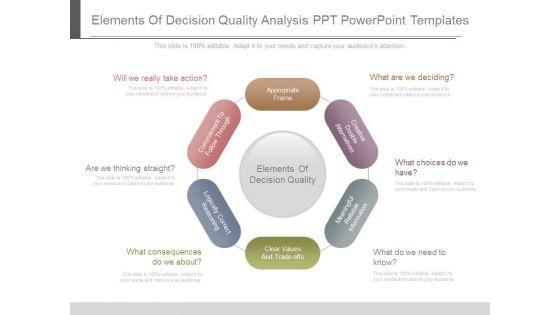


This is a elements of decision quality analysis ppt powerpoint templates. This is a six stage process. The stages in this process are appropriate frame, creative doable alternatives, meaningful reliable information, clear values and trade offs, logically correct reasoning, commitment to follow through.
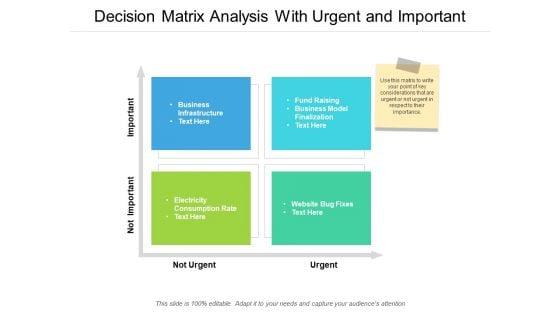


Presenting this set of slides with name decision matrix analysis with urgent and important ppt powerpoint presentation portfolio grid. This is a four stage process. The stages in this process are key considerations, business, growth strategy. This is a completely editable PowerPoint presentation and is available for immediate download. Download now and impress your audience.


Draw Out The Best In You With Our Sales Diagram Decision Analysis Tree Business Finance Strategy Development Powerpoint Templates. Let Your Inner Brilliance Come To The Surface. Draw Out The Talents Of Your Team. Use Our Sales Diagram Decision Analysis Tree Business Finance Strategy Development Powerpoint Templates To Give Them An Incentive.


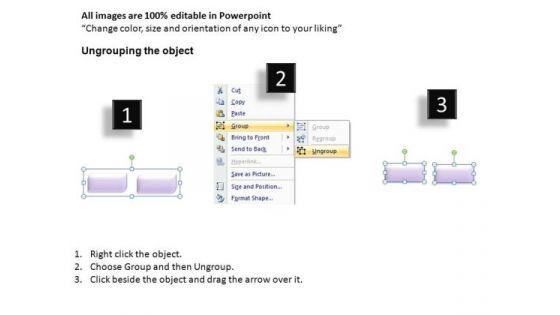
Editable Text boxes Decision tree Analysis diagram for PowerPoint Slides-These high quality powerpoint pre-designed slides and powerpoint templates have been carefully created by our professional team to help you impress your audience. All slides have been created and are 100% editable in powerpoint. Each and every property of any graphic - color, size, orientation, shading, outline etc. can be modified to help you build an effective powerpoint presentation. Any text can be entered at any point in the powerpoint template or slide. Simply DOWNLOAD, TYPE and PRESENT! These PowerPoint presentation slides can be used to represent themes relating to --Arrow, black, blackboard, blank, blue, brainstorming, chalk, chalkboard, chart, color, decision, diagram, dust, eraser, frame, green, making, map, mind, nobody, note, pattern, smudge, square, sticky, white Be exemplary with our Editable Text Boxes Decision Tree Analysis Diagram For PowerPoint Slides. You will prove a class act to follow.


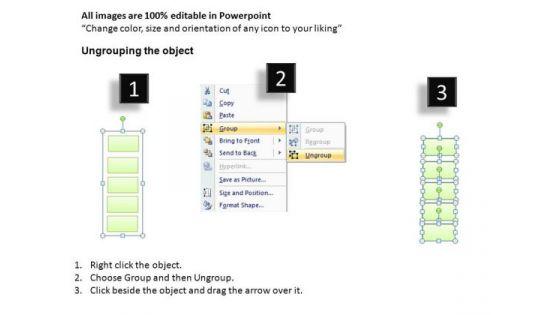
Download PPT templates Decision tree analysis Diagrams for PowerPoint-These high quality powerpoint pre-designed slides and powerpoint templates have been carefully created by our professional team to help you impress your audience. All slides have been created and are 100% editable in powerpoint. Each and every property of any graphic - color, size, orientation, shading, outline etc. can be modified to help you build an effective powerpoint presentation. Any text can be entered at any point in the powerpoint template or slide. Simply DOWNLOAD, TYPE and PRESENT! These PowerPoint presentation slides can be used to represent themes relating to --Arrow, black, blackboard, blank, blue, brainstorming, chalk, chalkboard, chart, color, decision, diagram, dust, eraser, frame, green, making, map, mind, nobody, note, pattern, smudge, square, sticky, white Optimize your business cyclewith our Download Ppt Templates Decision Tree Analysis Diagrams For PowerPoint. You'll deliver your best presentation yet.


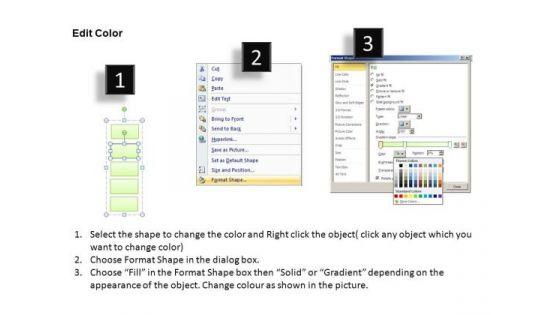
PowerPoint Decision Tree Analysis Slides-These high quality powerpoint pre-designed slides and powerpoint templates have been carefully created by our professional team to help you impress your audience. All slides have been created and are 100% editable in powerpoint. Each and every property of any graphic - color, size, orientation, shading, outline etc. can be modified to help you build an effective powerpoint presentation. Any text can be entered at any point in the powerpoint template or slide. Simply DOWNLOAD, TYPE and PRESENT! Encourage them to dream with our PowerPoint Decision Tree Analysis Slides. Get them going and thinking big.

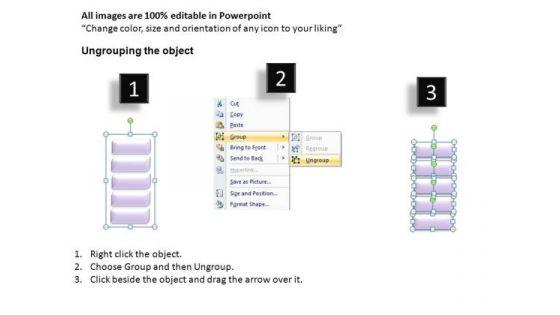
Decision Tree Analysis PowerPoint Templates-These high quality powerpoint pre-designed slides and powerpoint templates have been carefully created by our professional team to help you impress your audience. All slides have been created and are 100% editable in powerpoint. Each and every property of any graphic - color, size, orientation, shading, outline etc. can be modified to help you build an effective powerpoint presentation. Any text can be entered at any point in the powerpoint template or slide. Simply DOWNLOAD, TYPE and PRESENT! Resolve the feud with our Decision Tree Analysis PowerPoint Templates. Take all different approaches into consideration.


Decision Tree Analysis PowerPoint Presentation Slides-These high quality powerpoint pre-designed slides and powerpoint templates have been carefully created by our professional team to help you impress your audience. All slides have been created and are 100% editable in powerpoint. Each and every property of any graphic - color, size, orientation, shading, outline etc. can be modified to help you build an effective powerpoint presentation. Any text can be entered at any point in the powerpoint template or slide. Simply DOWNLOAD, TYPE and PRESENT! Fly in the face of conservative approaches. Our Decision Tree Analysis PowerPoint Presentation Slides encourage bold actions.


Decision tree Analysis PowerPoint Diagrams-These high quality powerpoint pre-designed slides and powerpoint templates have been carefully created by our professional team to help you impress your audience. All slides have been created and are 100% editable in powerpoint. Each and every property of any graphic - color, size, orientation, shading, outline etc. can be modified to help you build an effective powerpoint presentation. Any text can be entered at any point in the powerpoint template or slide. Simply DOWNLOAD, TYPE and PRESENT! Acquire a flourish with our Decision Tree Analysis PowerPoint Diagrams. Your thoughts will begin to flower.
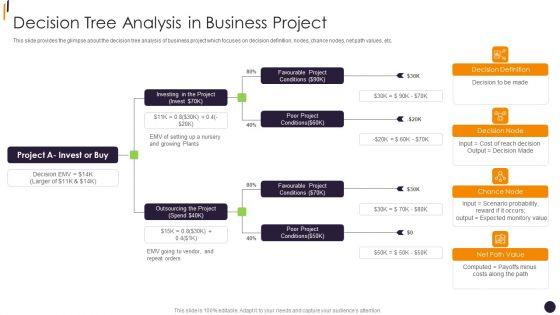

This slide provides the glimpse about the decision tree analysis of business project which focuses on decision definition, nodes, chance nodes, net path values, etc.Deliver and pitch your topic in the best possible manner with this PMP Tools Decision Tree Analysis In Business Project Brochure PDF Use them to share invaluable insights on Outsourcing The Project, Favourable Project, Favourable Project and impress your audience. This template can be altered and modified as per your expectations. So, grab it now.
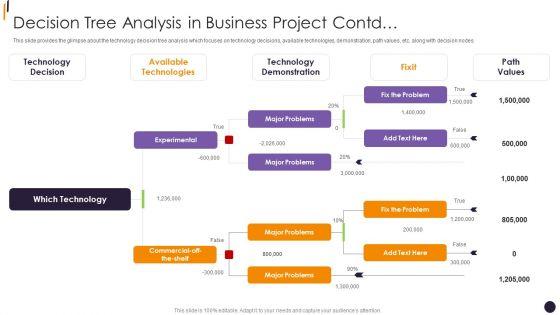

This slide provides the glimpse about the technology decision tree analysis which focuses on technology decisions, available technologies, demonstration, path values, etc. along with decision nodes.Deliver an awe inspiring pitch with this creative PMP Tools Decision Tree Analysis In Business Project Contd Rules PDF bundle. Topics like Available Technologies, Technology Demonstration, Technology Decision can be discussed with this completely editable template. It is available for immediate download depending on the needs and requirements of the user.
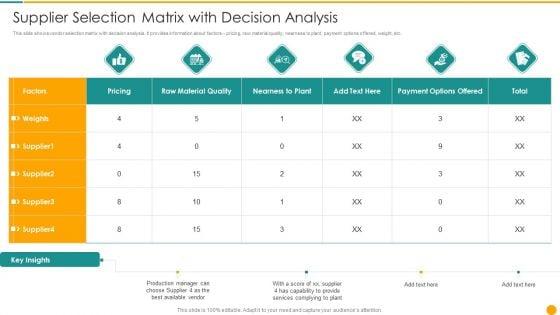

This slide shows vendor selection matrix with decision analysis. It provides information about factors pricing, raw material quality, nearness to plant, payment options offered, weight, etc. Pitch your topic with ease and precision using this Supplier Selection Matrix With Decision Analysis Brochure PDF. This layout presents information on Capability, Supplier, Material. It is also available for immediate download and adjustment. So, changes can be made in the color, design, graphics or any other component to create a unique layout.


This slide provides the glimpse about the technology decision tree analysis which focuses on technology decisions, available technologies, demonstration, path values, etc. along with decision nodes. Deliver an awe inspiring pitch with this creative Quantitative Risk Assessment Decision Tree Analysis In Business Project Introduction PDF bundle. Topics like Available Technologies, Technology Demonstration, Technology Decision can be discussed with this completely editable template. It is available for immediate download depending on the needs and requirements of the user.

This slide provides the glimpse about the technology decision tree analysis which focuses on technology decisions, available technologies, demonstration, path values, etc. along with decision nodes. Deliver an awe inspiring pitch with this creative Quantitative Risk Assessment Decision Tree Analysis In Business Project Value Structure PDF bundle. Topics like Decision Tree Analysis In Business Project can be discussed with this completely editable template. It is available for immediate download depending on the needs and requirements of the user.
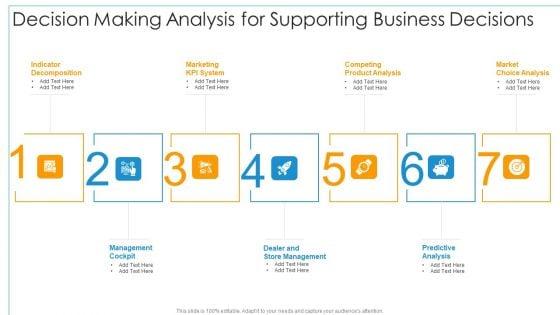
Persuade your audience using this decision making analysis for supporting business decisions ideas pdf. This PPT design covers seven stages, thus making it a great tool to use. It also caters to a variety of topics including marketing kpi system, competing product analysis, market choice analysis. Download this PPT design now to present a convincing pitch that not only emphasizes the topic but also showcases your presentation skills.


This slide provides the glimpse about the decision tree analysis of business project which focuses on decision definition, nodes, chance nodes, net path values, etc.This is a business operation modeling approaches decision tree analysis in business mockup pdf template with various stages. Focus and dispense information on two stages using this creative set, that comes with editable features. It contains large content boxes to add your information on topics like investing in the project, favourable project conditions, poor project conditions You can also showcase facts, figures, and other relevant content using this PPT layout. Grab it now.
This slide provides the glimpse about the technology decision tree analysis which focuses on technology decisions, available technologies, demonstration, path values, etc. along with decision nodes.Presenting business operation modeling approaches decision tree analysis in business project icons pdf to provide visual cues and insights. Share and navigate important information on two stages that need your due attention. This template can be used to pitch topics like technology decision, available technologies, technology demonstration In addtion, this PPT design contains high resolution images, graphics, etc, that are easily editable and available for immediate download.


This slide provides the glimpse about the decision tree analysis of business project which focuses on decision definition, nodes, chance nodes, net path values, etc. This is a project management modelling techniques it decision tree analysis in business project invest themes pdf template with various stages. Focus and dispense information on two stages using this creative set, that comes with editable features. It contains large content boxes to add your information on topics like decision definition, nodes, chance nodes, net path values. You can also showcase facts, figures, and other relevant content using this PPT layout. Grab it now.
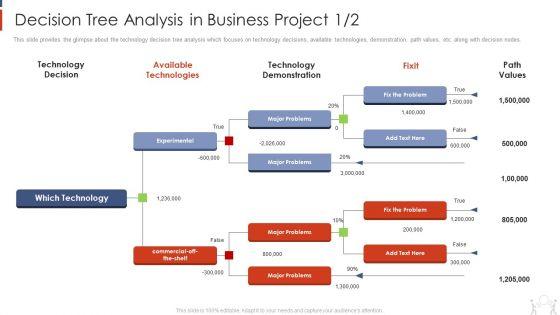
This slide provides the glimpse about the technology decision tree analysis which focuses on technology decisions, available technologies, demonstration, path values, etc. along with decision nodes. Presenting project management modelling techniques it decision tree analysis in business project available microsoft pdf to provide visual cues and insights. Share and navigate important information on three stages that need your due attention. This template can be used to pitch topics like technology decision, available technologies, technology demonstration, fixit, path values. In addtion, this PPT design contains high resolution images, graphics, etc, that are easily editable and available for immediate download.
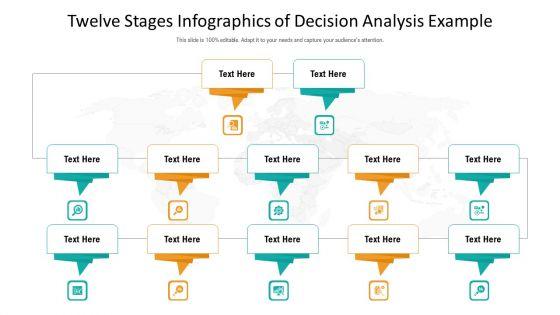

Twelve Stages Infographics Of Decision Analysis Example Ppt PowerPoint Presentation Gallery Good PDF
Persuade your audience using this twelve stages infographics of decision analysis example ppt powerpoint presentation gallery good pdf. This PPT design covers twelve stages, thus making it a great tool to use. It also caters to a variety of topics including twelve stages infographics of decision analysis example. Download this PPT design now to present a convincing pitch that not only emphasizes the topic but also showcases your presentation skills.

Persuade your audience using this corporate key economic decisions analysis ppt powerpoint presentation file layouts pdf. This PPT design covers three stages, thus making it a great tool to use. It also caters to a variety of topics including investment decision, financing decision, dividend decision. Download this PPT design now to present a convincing pitch that not only emphasizes the topic but also showcases your presentation skills.
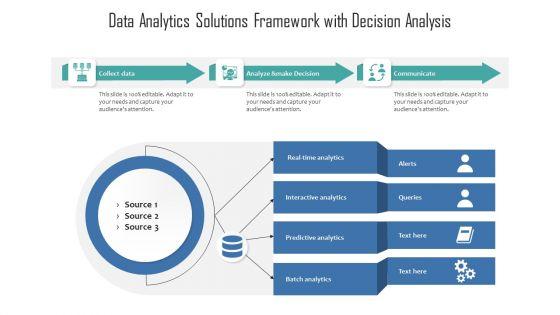

Presenting data analytics solutions framework with decision analysis ppt powerpoint presentation file background designs pdf to dispense important information. This template comprises four stages. It also presents valuable insights into the topics including source, analytics, communicate. This is a completely customizable PowerPoint theme that can be put to use immediately. So, download it and address the topic impactfully.


Three Stages For Business Decision Analysis Ppt PowerPoint Presentation Infographics Influencers PDF
Presenting three stages for business decision analysis ppt powerpoint presentation infographics influencers pdf to dispense important information. This template comprises three stages. It also presents valuable insights into the topics including identify the significance of decision, communication within organization, decision analysis. This is a completely customizable PowerPoint theme that can be put to use immediately. So, download it and address the topic impactfully.
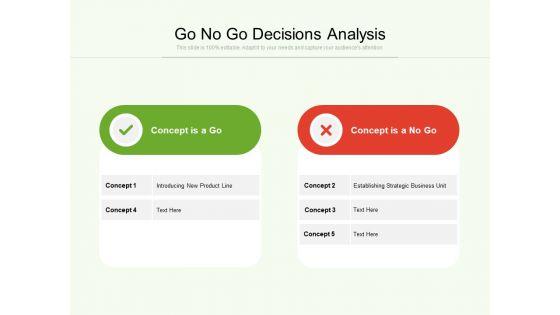
Presenting go no go decisions analysis ppt powerpoint presentation gallery model pdf to dispense important information. This template comprises two stages. It also presents valuable insights into the topics including go no go decisions analysis. This is a completely customizable PowerPoint theme that can be put to use immediately. So, download it and address the topic impactfully.
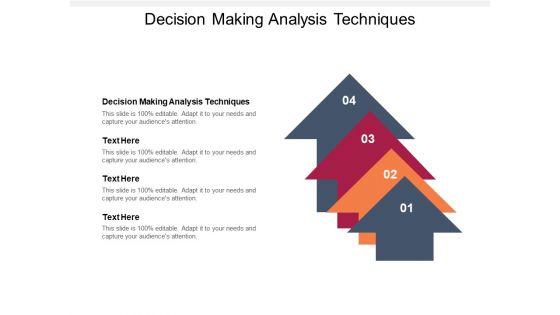

Presenting this set of slides with name decision making analysis techniques ppt powerpoint presentation pictures sample cpb pdf. This is an editable Powerpoint four stages graphic that deals with topics like decision making analysis techniques to help convey your message better graphically. This product is a premium product available for immediate download and is 100 percent editable in Powerpoint. Download this now and use it in your presentations to impress your audience.
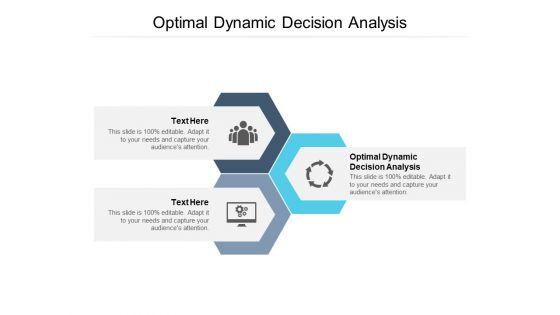
Presenting this set of slides with name optimal dynamic decision analysis ppt powerpoint presentation infographics portfolio cpb pdf. This is an editable Powerpoint three stages graphic that deals with topics like optimal dynamic decision analysis to help convey your message better graphically. This product is a premium product available for immediate download and is 100 percent editable in Powerpoint. Download this now and use it in your presentations to impress your audience.
Presenting this set of slides with name decision tree analysis business ppt powerpoint presentation slides icon cpb. This is an editable Powerpoint five stages graphic that deals with topics like decision tree analysis business to help convey your message better graphically. This product is a premium product available for immediate download and is 100 percent editable in Powerpoint. Download this now and use it in your presentations to impress your audience.
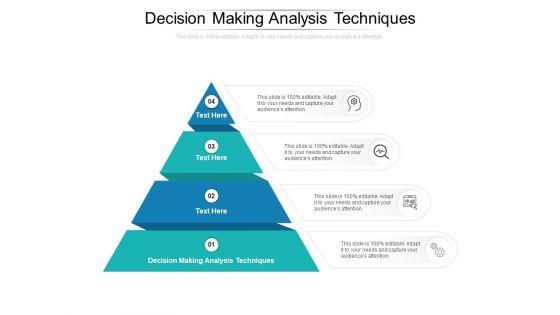
Presenting this set of slides with name decision making analysis techniques ppt powerpoint presentation styles graphic images cpb. This is an editable Powerpoint four stages graphic that deals with topics like decision making analysis techniques to help convey your message better graphically. This product is a premium product available for immediate download and is 100 percent editable in Powerpoint. Download this now and use it in your presentations to impress your audience.
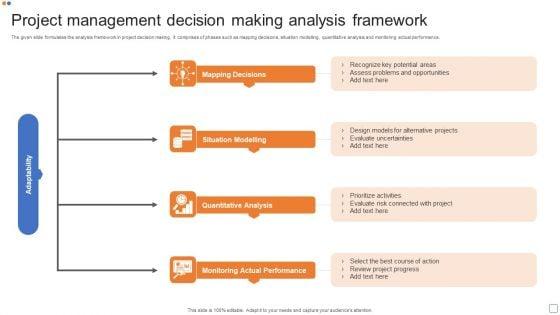


The given slide formulates the analysis framework in project decision making. It comprises of phases such as mapping decisions, situation modelling, quantitative analysis and monitoring actual performance. Presenting Project Management Decision Making Analysis Framework Summary PDF to dispense important information. This template comprises four stages. It also presents valuable insights into the topics including Mapping Decisions, Situation Modelling, Quantitative Analysis. This is a completely customizable PowerPoint theme that can be put to use immediately. So, download it and address the topic impactfully.
This slide exhibits decision tree analysis to help identify suitable contractors for the project. It includes vendor decisions, the chance of being late and path value. From laying roadmaps to briefing everything in detail, our templates are perfect for you. You can set the stage with your presentation slides. All you have to do is download these easy to edit and customizable templates. Risk Assessment Decision Tree Analysis To Evaluate Options Icons PDF will help you deliver an outstanding performance that everyone would remember and praise you for. Do download this presentation today.
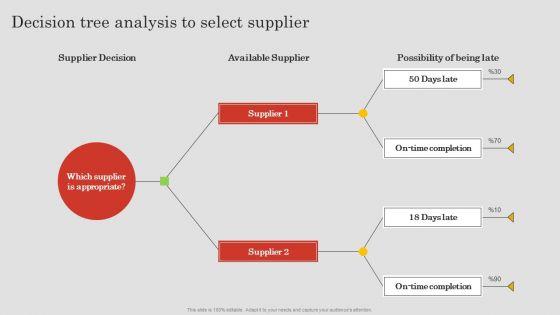
If you are looking for a format to display your unique thoughts, then the professionally designed Project Risk Management And Reduction Decision Tree Analysis To Select Supplier Microsoft PDF is the one for you. You can use it as a Google Slides template or a PowerPoint template. Incorporate impressive visuals, symbols, images, and other charts. Modify or reorganize the text boxes as you desire. Experiment with shade schemes and font pairings. Alter, share or cooperate with other people on your work. Download Project Risk Management And Reduction Decision Tree Analysis To Select Supplier Microsoft PDF and find out how to give a successful presentation. Present a perfect display to your team and make your presentation unforgettable.
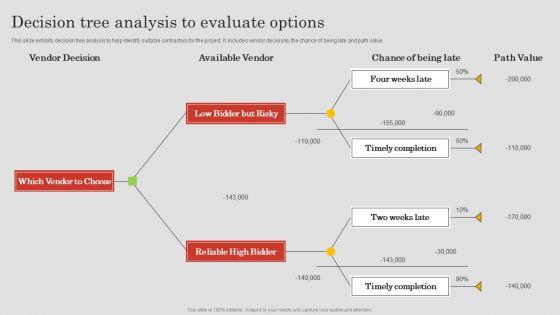
This slide exhibits decision tree analysis to help identify suitable contractors for the project. It includes vendor decisions, the chance of being late and path value. If your project calls for a presentation, then Slidegeeks is your go-to partner because we have professionally designed, easy-to-edit templates that are perfect for any presentation. After downloading, you can easily edit Project Risk Management And Reduction Decision Tree Analysis To Evaluate Options Background PDF and make the changes accordingly. You can rearrange slides or fill them with different images. Check out all the handy templates

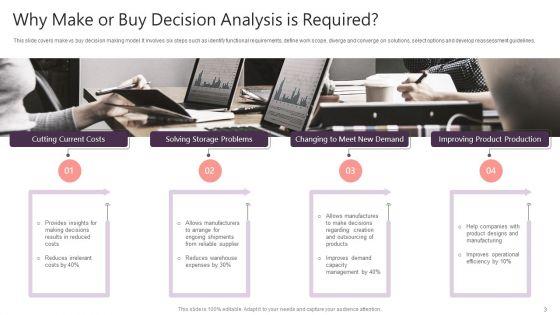
This slide covers make vs buy decision making model. It involves six steps such as identify functional requirements, define work scope, diverge and converge on solutions, select options and develop reassessment guidelines. Presenting Why Make Or Buy Decision Analysis Is Required Designs PDF to dispense important information. This template comprises four stages. It also presents valuable insights into the topics including Cutting Current Costs, Storage Problems, Improving Product Production. This is a completely customizable PowerPoint theme that can be put to use immediately. So, download it and address the topic impactfully.

This slide covers make vs buy decision making analysis for software development. It based on criteria such as technology and compatibility, features, performance, design and cost and ROI. Showcasing this set of slides titled Make Or Buy Decision Making Analysis For Software Development Themes PDF. The topics addressed in these templates are Technology And Compatibility, Design, Cost. All the content presented in this PPT design is completely editable. Download it and make adjustments in color, background, font etc. as per your unique business setting.

This slide covers make vs buy sourcing decision framework. It involves five steps such as finalize criteria and sub criteria, assign weights and scores, identify best fit model and take weighted average of criteria score. Presenting Make Or Buy Decision Analysis Sourcing Decision Framework Summary PDF to dispense important information. This template comprises five stages. It also presents valuable insights into the topics including Outsourcing Suitability, Average, Analysis Sourcing. This is a completely customizable PowerPoint theme that can be put to use immediately. So, download it and address the topic impactfully.
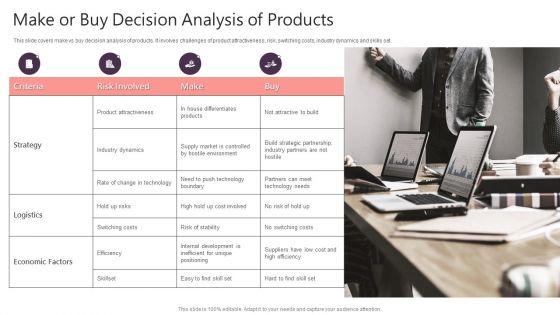
This slide covers make vs buy decision analysis of products. It involves challenges of product attractiveness, risk, switching costs, industry dynamics and skills set. Persuade your audience using this Make Or Buy Decision Analysis Of Products Summary PDF. This PPT design covers four stages, thus making it a great tool to use. It also caters to a variety of topics including Economic Factors, Strategy, Risk Involved. Download this PPT design now to present a convincing pitch that not only emphasizes the topic but also showcases your presentation skills.
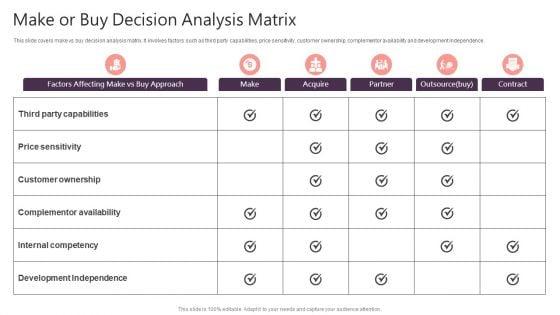
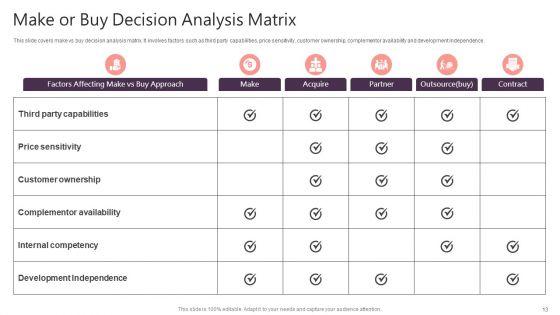
This slide covers make vs buy decision analysis matrix. It involves factors such as third party capabilities, price sensitivity, customer ownership, complementor availability and development independence. Showcasing this set of slides titled Make Or Buy Decision Analysis Matrix Mockup PDF. The topics addressed in these templates are Customer Ownership, Price Sensitivity, Development Independence. All the content presented in this PPT design is completely editable. Download it and make adjustments in color, background, font etc. as per your unique business setting.

This slide covers make vs buy decision making process. It involves four stages such as preparation, data collection, data analysis and feedback to ensure most reliable decision results. Persuade your audience using this Make Or Buy Decision Analysis Making Process Template PDF. This PPT design covers four stages, thus making it a great tool to use. It also caters to a variety of topics including Preparation, Data Collection, Data Analysis. Download this PPT design now to present a convincing pitch that not only emphasizes the topic but also showcases your presentation skills.

This slide covers make vs buy decision making model. It involves six steps such as identify functional requirements, define work scope, diverge and converge on solutions, select options and develop reassessment guidelines. Presenting Make Or Buy Decision Analysis Making Model Professional PDF to dispense important information. This template comprises six stages. It also presents valuable insights into the topics including Requirements, Develop Reassessment Guidelines. This is a completely customizable PowerPoint theme that can be put to use immediately. So, download it and address the topic impactfully.

This slide covers make vs buy decision making matrix by providing scores to alternative solutions. It involves criteria such as provides cost effective solution, can meet delivery timeline, deliver on projected costs and has skills to complete work. Showcasing this set of slides titled Make Or Buy Decision Analysis Making Matrix Background PDF. The topics addressed in these templates are Projected Costs, Provides Cost. All the content presented in this PPT design is completely editable. Download it and make adjustments in color, background, font etc. as per your unique business setting.
Presenting Make Or Buy Decision Analysis Making Icon Microsoft PDF to dispense important information. This template comprises two stages. It also presents valuable insights into the topics including Analysis Making Icon, Make Or Buy Decision. This is a completely customizable PowerPoint theme that can be put to use immediately. So, download it and address the topic impactfully.
Presenting Make Or Buy Decision Analysis Icon Portrait PDF to dispense important information. This template comprises three stages. It also presents valuable insights into the topics including Analysis Icon, Make Or Buy Decision. This is a completely customizable PowerPoint theme that can be put to use immediately. So, download it and address the topic impactfully.
Presenting Make Or Buy Decision Analysis For Product Icon Clipart PDF to dispense important information. This template comprises three stages. It also presents valuable insights into the topics including Product Icon, Buy Decision Analysis. This is a completely customizable PowerPoint theme that can be put to use immediately. So, download it and address the topic impactfully.
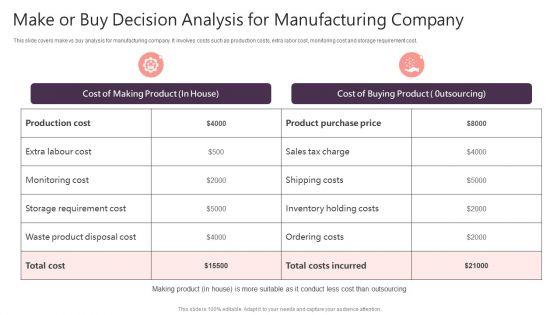
This slide covers make vs buy analysis for manufacturing company. It involves costs such as production costs, extra labor cost, monitoring cost and storage requirement cost. Pitch your topic with ease and precision using this Make Or Buy Decision Analysis For Manufacturing Company Topics PDF. This layout presents information on Production Cost, Extra Labour Cost, Monitoring Cost. It is also available for immediate download and adjustment. So, changes can be made in the color, design, graphics or any other component to create a unique layout.

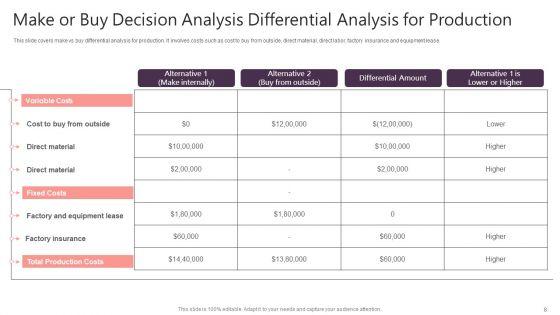
This slide covers make vs buy differential analysis for production. It involves costs such as cost to buy from outside, direct material, direct labor, factory insurance and equipment lease. Showcasing this set of slides titled Make Or Buy Decision Analysis Differential Analysis For Production Graphics PDF. The topics addressed in these templates are Direct Material, Production Costs, Variable Costs. All the content presented in this PPT design is completely editable. Download it and make adjustments in color, background, font etc. as per your unique business setting.

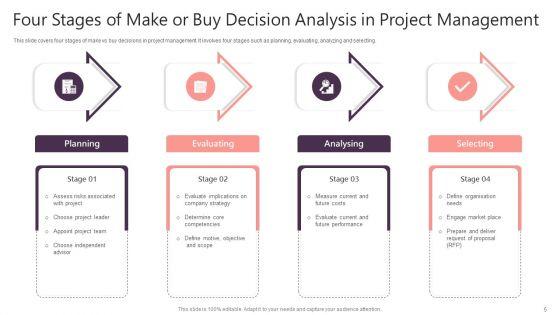
This slide covers four stages of make vs buy decisions in project management. It involves four stages such as planning, evaluating, analyzing and selecting. Persuade your audience using this Four Stages Of Make Or Buy Decision Analysis In Project Management Structure PDF. This PPT design covers four stages, thus making it a great tool to use. It also caters to a variety of topics including Planning, Evaluating, Analysing. Download this PPT design now to present a convincing pitch that not only emphasizes the topic but also showcases your presentation skills.

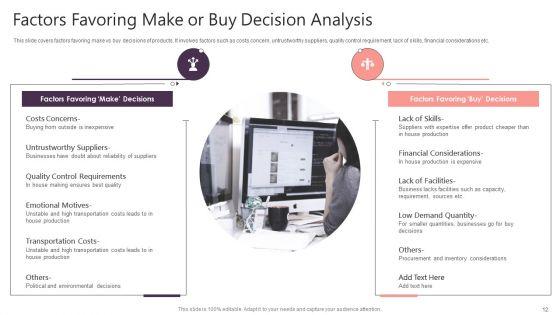
This slide covers factors favoring make vs buy decisions of products. It involves factors such as costs concern, untrustworthy suppliers, quality control requirement, lack of skills, financial considerations etc. Presenting Factors Favoring Make Or Buy Decision Analysis Diagrams PDF to dispense important information. This template comprises two stages. It also presents valuable insights into the topics including Financial Considerations, Low Demand Quantity, Transportation Costs. This is a completely customizable PowerPoint theme that can be put to use immediately. So, download it and address the topic impactfully.
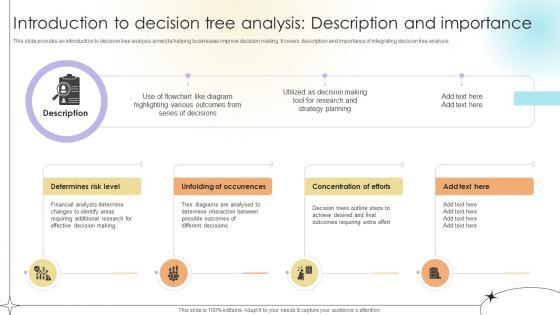
This slide provides an introduction to decision tree analysis aimed ta helping businesses improve decision making. It covers description and importance of integrating decision tree analysis.Slidegeeks is one of the best resources for PowerPoint templates. You can download easily and regulate Introduction To Decision Tree Analysis Description And Importance Data Analytics SS V for your personal presentations from our wonderful collection. A few clicks is all it takes to discover and get the most relevant and appropriate templates. Use our Templates to add a unique zing and appeal to your presentation and meetings. All the slides are easy to edit and you can use them even for advertisement purposes. This slide provides an introduction to decision tree analysis aimed ta helping businesses improve decision making. It covers description and importance of integrating decision tree analysis.
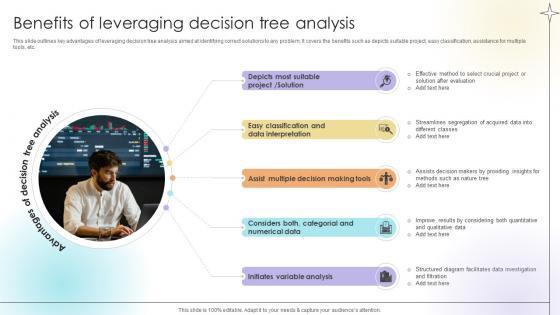
This slide outlines key advantages of leveraging decision tree analysis aimed at identifying correct solutions to any problem. It covers the benefits such as depicts suitable project, easy classification, assistance for multiple tools, etc.Coming up with a presentation necessitates that the majority of the effort goes into the content and the message you intend to convey. The visuals of a PowerPoint presentation can only be effective if it supplements and supports the story that is being told. Keeping this in mind our experts created Benefits Of Leveraging Decision Tree Analysis Data Analytics SS V to reduce the time that goes into designing the presentation. This way, you can concentrate on the message while our designers take care of providing you with the right template for the situation. This slide outlines key advantages of leveraging decision tree analysis aimed at identifying correct solutions to any problem. It covers the benefits such as depicts suitable project, easy classification, assistance for multiple tools, etc.
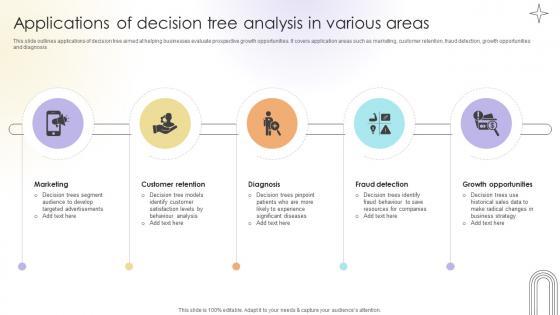
This slide outlines applications of decision tree aimed at helping businesses evaluate prospective growth opportunities. It covers application areas such as marketing, customer retention, fraud detection, growth opportunities and diagnosis.Get a simple yet stunning designed Applications Of Decision Tree Analysis In Various Areas Data Analytics SS V. It is the best one to establish the tone in your meetings. It is an excellent way to make your presentations highly effective. So, download this PPT today from Slidegeeks and see the positive impacts. Our easy-to-edit Applications Of Decision Tree Analysis In Various Areas Data Analytics SS V can be your go-to option for all upcoming conferences and meetings. So, what are you waiting for Grab this template today. This slide outlines applications of decision tree aimed at helping businesses evaluate prospective growth opportunities. It covers application areas such as marketing, customer retention, fraud detection, growth opportunities and diagnosis.
DISPLAYING: 60 of 67 Item(s)
Page