- Sign up
- Sign In
 AI PPT Maker
 Templates
 PPT Bundles
 Design Services
 Business PPTs
 Business Plan
 Management
 Strategy
 Introduction PPT
 Roadmap
 Self Introduction
 Timelines
 Process
 Marketing
 Agenda
 Technology
 Medical
 Startup Business Plan
 Cyber Security
 Dashboards
 SWOT
SWOT Proposals
 Education
 Pitch Deck
 Digital Marketing
 KPIs
KPIs Project Management
 Product Management
 Artificial Intelligence
 Target Market
 Communication
 Supply Chain
 Google Slides
 Research Services
 One Pagers
 All Categories
Analytics data visualizations PowerPoint Presentation Templates and Google Slides
29 Item(s)


Presenting this set of slides with name data analytics strategy ppt powerpoint presentation visual aids layouts cpb. This is a six stage process. The stages in this process are data analytics strategy. This is a completely editable PowerPoint presentation and is available for immediate download. Download now and impress your audience.


Pitch your topic with ease and precision using this Visual Analytical KPI Dashboard For Data Warehouse Template PDF This layout presents information on Machine Learning Based, Volume Change, Revenue Change It is also available for immediate download and adjustment. So, changes can be made in the color, design, graphics or any other component to create a unique layout.


This slide represents the data visualization with an augmented analytics dashboard covering sales, spending per customer, gross profit, unique customers, unique purchase, and gross profit. Deliver an awe inspiring pitch with this creative Augmented Analytics Implementation IT Data Visualization With Augmented Analytics Microsoft PDF bundle. Topics like Category Contribution, Category Year To Year Growth, Top Products, Sales, Gross Profit can be discussed with this completely editable template. It is available for immediate download depending on the needs and requirements of the user.
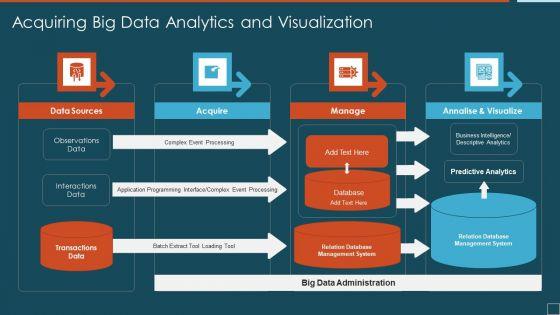
Presenting acquiring big data analytics and visualization ideas pdf to dispense important information. This template comprises four stages. It also presents valuable insights into the topics including data sources, acquire, manage. This is a completely customizable PowerPoint theme that can be put to use immediately. So, download it and address the topic impactfully.


This slide defines the checklist for effective data science integration in business, and it includes an understanding of business requirements, compelling communication, and so on. Presenting checklist for effective data analytics integration in business resources ppt visual aids pdf to provide visual cues and insights. Share and navigate important information on six stages that need your due attention. This template can be used to pitch topics like resources, analysis. In addtion, this PPT design contains high resolution images, graphics, etc, that are easily editable and available for immediate download.

This slide depicts the tasks performed by a Database Administrator and skills that he should possess, such as backup and recovery, data modeling and design, and distributive computing. Presenting data analytics tasks and skills of database administrator ppt visual aids pdf to provide visual cues and insights. Share and navigate important information on six stages that need your due attention. This template can be used to pitch topics like data security, database systems, distributive computing, information. In addtion, this PPT design contains high resolution images, graphics, etc, that are easily editable and available for immediate download.


This slide depicts the data visualization service provided by the oracle analytics cloud and how it allows users to experiment with data easily to visualize data from different perspectives. Deliver an awe inspiring pitch with this creative oracle cloud data analytics administration it oracle data visualization cloud service dvcs inspiration pdf bundle. Topics like experiments, representations, sources, visualizations can be discussed with this completely editable template. It is available for immediate download depending on the needs and requirements of the user.
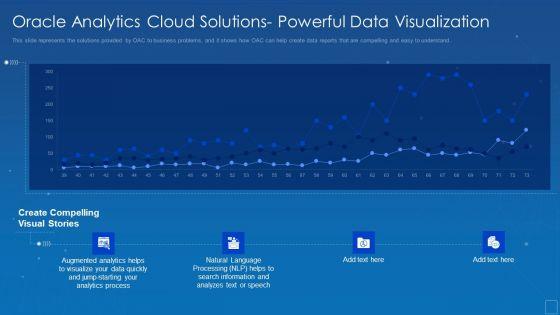
This slide represents the predictive analytics solution of the oracle analytics cloud and how it is helpful to predict outputs and display quickly with the help of ML. Deliver an awe inspiring pitch with this creative oracle analytics cloud solutions powerful data visualization template pdf bundle. Topics like oracle analytics cloud solutions powerful data visualization can be discussed with this completely editable template. It is available for immediate download depending on the needs and requirements of the user.
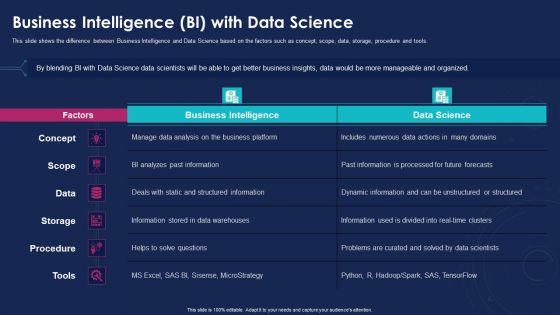

This slide shows the difference between Business Intelligence and Data Science based on the factors such as concept, scope, data, storage, procedure and tools. Deliver an awe inspiring pitch with this creative data analytics it business intelligence bi with data science ppt file visuals pdf bundle. Topics like concept, scope, data, storage, procedure, tools can be discussed with this completely editable template. It is available for immediate download depending on the needs and requirements of the user.
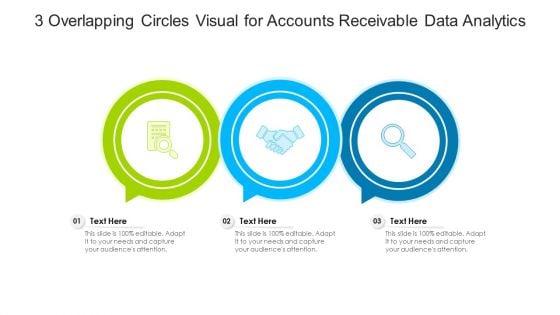
Presenting 3 overlapping circles visual for accounts receivable data analytics ppt powerpoint presentation gallery background pdf to dispense important information. This template comprises three stages. It also presents valuable insights into the topics including 3 overlapping circles visual for accounts receivable data analytics. This is a completely customizable PowerPoint theme that can be put to use immediately. So, download it and address the topic impactfully.

This is a healthcare management healthcare management data analytics architecture ppt file visuals pdf template with various stages. Focus and dispense information on two stages using this creative set, that comes with editable features. It contains large content boxes to add your information on topics like line of business, external sources, management, performance improvement, financial management. You can also showcase facts, figures, and other relevant content using this PPT layout. Grab it now.


This is a nursing administration healthcare management data analytics architecture ppt visual aids pictures pdf template with various stages. Focus and dispense information on two stages using this creative set, that comes with editable features. It contains large content boxes to add your information on topics like line of business, external sources, management, performance improvement, financial management. You can also showcase facts, figures, and other relevant content using this PPT layout. Grab it now.

Deliver an awe inspiring pitch with this creative analytics where does big data come from ppt visual aids styles pdf bundle. Topics like transactions, log data, social media can be discussed with this completely editable template. It is available for immediate download depending on the needs and requirements of the user.
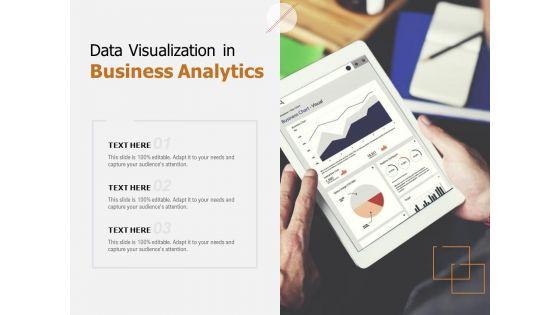
Presenting this set of slides with name data visualization in business analytics ppt powerpoint presentation portfolio file formats. This is a three stage process. The stages in this process are data visualization, business analytics. This is a completely editable PowerPoint presentation and is available for immediate download. Download now and impress your audience.


Presenting this set of slides with name data visualization techniques data analytics ppt powerpoint presentation outline clipart images cpb. This is an editable Powerpoint six stages graphic that deals with topics like data visualization techniques data analytics to help convey your message better graphically. This product is a premium product available for immediate download and is 100 percent editable in Powerpoint. Download this now and use it in your presentations to impress your audience.
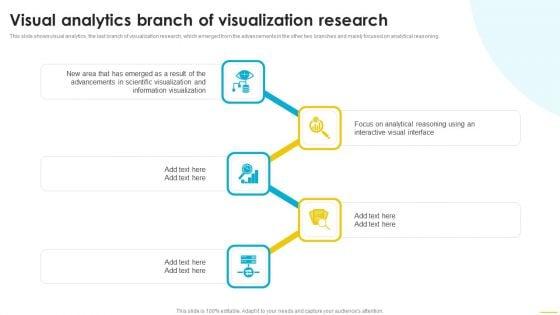


This slide shows visual analytics, the last branch of visualization research, which emerged from the advancements in the other two branches and mainly focused on analytical reasoning. Make sure to capture your audiences attention in your business displays with our gratis customizable Data And Information Visualization Visual Analytics Branch Of Visualization Research Designs PDF. These are great for business strategies, office conferences, capital raising or task suggestions. If you desire to acquire more customers for your tech business and ensure they stay satisfied, create your own sales presentation with these plain slides.

This template illustrates that the high performance computation engine of the analytics software company, the data platform connects to various data sources, automates the data preparation workflow, and scales to big data scenarios. Deliver an awe inspiring pitch with this creative Information Visualizations Playbook How To Overcome Analytics From All The Data At Scale Challenges Mockup PDF bundle. Topics like Purchases, Marketing, Data Pipeline can be discussed with this completely editable template. It is available for immediate download depending on the needs and requirements of the user.

Deliver an awe inspiring pitch with this creative Information Visualizations Playbook Data Management Framework After Data Analytics Solution Formats PDF bundle. Topics like Data Discovery, Data Sharing, Data Harmonization can be discussed with this completely editable template. It is available for immediate download depending on the needs and requirements of the user.
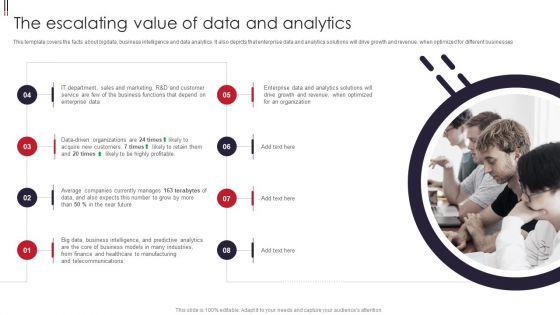
This template covers the facts about bigdata, business intelligence and data analytics. It also depicts that enterprise data and analytics solutions will drive growth and revenue, when optimized for different businesses. This is a Information Visualizations Playbook The Escalating Value Of Data And Analytics Portrait PDF template with various stages. Focus and dispense information on eight stages using this creative set, that comes with editable features. It contains large content boxes to add your information on topics like Data Driven Organizations, Acquire New Customers, Profitable. You can also showcase facts, figures, and other relevant content using this PPT layout. Grab it now.
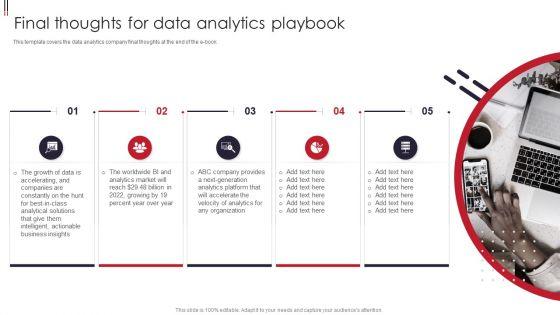
This template covers the data analytics company final thoughts at the end of the e book. Presenting Information Visualizations Playbook Final Thoughts For Data Analytics Playbook Pictures PDF to provide visual cues and insights. Share and navigate important information on five stages that need your due attention. This template can be used to pitch topics like Organization, Business Insights, Growth. In addtion, this PPT design contains high resolution images, graphics, etc, that are easily editable and available for immediate download.

This template covers the problems while implementing analytics from all the data, at scale in the organization. The challenges are large and complex data and analytic slowdown. Presenting Information Visualizations Playbook Analytics From All The Data At Scale Challenges Structure PDF to provide visual cues and insights. Share and navigate important information on two stages that need your due attention. This template can be used to pitch topics like Complex Data, Analytic Slowdown. In addtion, this PPT design contains high resolution images, graphics, etc, that are easily editable and available for immediate download.
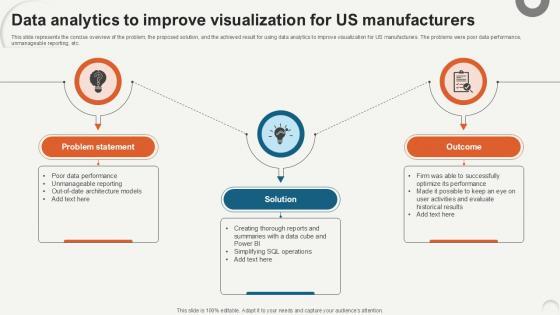
This slide represents the concise overview of the problem, the proposed solution, and the achieved result for using data analytics to improve visualization for US manufacturers. The problems were poor data performance, unmanageable reporting, etc. Whether you have daily or monthly meetings, a brilliant presentation is necessary. Data Analytics To Improve Visualization Data Analytics For Informed Decision Ppt PowerPoint can be your best option for delivering a presentation. Represent everything in detail using Data Analytics To Improve Visualization Data Analytics For Informed Decision Ppt PowerPoint and make yourself stand out in meetings. The template is versatile and follows a structure that will cater to your requirements. All the templates prepared by Slidegeeks are easy to download and edit. Our research experts have taken care of the corporate themes as well. So, give it a try and see the results. This slide represents the concise overview of the problem, the proposed solution, and the achieved result for using data analytics to improve visualization for US manufacturers. The problems were poor data performance, unmanageable reporting, etc.
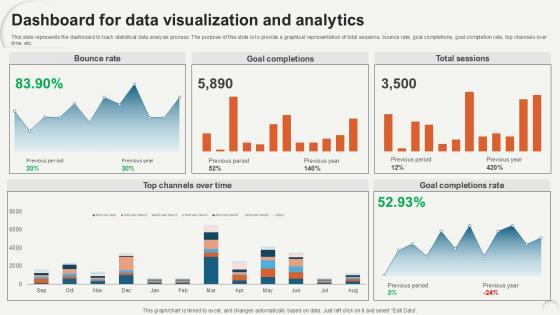
This slide represents the dashboard to track statistical data analysis process. The purpose of this slide is to provide a graphical representation of total sessions, bounce rate, goal completions, goal completion rate, top channels over time, etc. Do you have an important presentation coming up Are you looking for something that will make your presentation stand out from the rest Look no further than Dashboard For Data Visualization Data Analytics For Informed Decision Ppt Sample. With our professional designs, you can trust that your presentation will pop and make delivering it a smooth process. And with Slidegeeks, you can trust that your presentation will be unique and memorable. So why wait Grab Dashboard For Data Visualization Data Analytics For Informed Decision Ppt Sample today and make your presentation stand out from the rest This slide represents the dashboard to track statistical data analysis process. The purpose of this slide is to provide a graphical representation of total sessions, bounce rate, goal completions, goal completion rate, top channels over time, etc.

This slide represents the concise overview of the problem, the proposed solution, and the achieved result for using data analytics to improve visualization for US manufacturers. The problems were poor data performance, unmanageable reporting, etc. Crafting an eye-catching presentation has never been more straightforward. Let your presentation shine with this tasteful yet straightforward Statistical Tools For Evidence Data Analytics To Improve Visualization For Us Manufacturers template. It offers a minimalistic and classy look that is great for making a statement. The colors have been employed intelligently to add a bit of playfulness while still remaining professional. Construct the ideal Statistical Tools For Evidence Data Analytics To Improve Visualization For Us Manufacturers that effortlessly grabs the attention of your audience Begin now and be certain to wow your customers This slide represents the concise overview of the problem, the proposed solution, and the achieved result for using data analytics to improve visualization for US manufacturers. The problems were poor data performance, unmanageable reporting, etc.
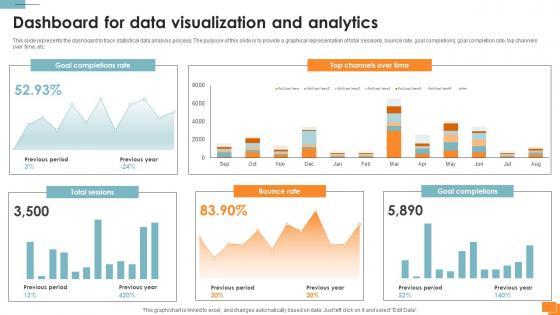
This slide represents the dashboard to track statistical data analysis process. The purpose of this slide is to provide a graphical representation of total sessions, bounce rate, goal completions, goal completion rate, top channels over time, etc. Are you in need of a template that can accommodate all of your creative concepts This one is crafted professionally and can be altered to fit any style. Use it with Google Slides or PowerPoint. Include striking photographs, symbols, depictions, and other visuals. Fill, move around, or remove text boxes as desired. Test out color palettes and font mixtures. Edit and save your work, or work with colleagues. Download Statistical Tools For Evidence Dashboard For Data Visualization And Analytics and observe how to make your presentation outstanding. Give an impeccable presentation to your group and make your presentation unforgettable. This slide represents the dashboard to track statistical data analysis process. The purpose of this slide is to provide a graphical representation of total sessions, bounce rate, goal completions, goal completion rate, top channels over time, etc.

The following slide highlights real time big data visualization tools with their ratings and pricing. It includes various software such as tableau, Microsoft power BI and Minitab. Pitch your topic with ease and precision using this Real Time Big Data Analytics Visualization Tools Ppt Portfolio Example Pdf. This layout presents information on Visualization Tools, User Rating, Pricing Per Month. It is also available for immediate download and adjustment. So, changes can be made in the color, design, graphics or any other component to create a unique layout. The following slide highlights real time big data visualization tools with their ratings and pricing. It includes various software such as tableau, Microsoft power BI and Minitab.
29 Item(s)